
Sized 22x Heavier on MSFT: The Trade Pays When Nothing Happens
Capex intensity says MSFT gets 22x the NVDA notional. Under that sizing, carry works and vol decay pays; mechanism confirmation becomes the loss.

This is the last part of the Tech Schism series. Part 1 laid out the capex-driven fracture inside the AI trade. Part 1.5 explained why the correlation trade is a trap. Part 2 mapped the dispersion the options market hasn’t priced and we discussed publishing the NVDA/MSFT position math with the sizing, the four break scenarios, and the specific stops. The prequel — QQQ Is Lying to You — is my concentration argument that started all this.
Immortal Zugzwang Game
As some of you know, I love chess. Well, I’m not particularly good at it but I enjoy playing it.
In the Immortal Zugzwang Game (Copenhagen, 1923), Aron Nimzowitsch (playing Black) built a position against Friedrich Sämisch where every legal move worsened White’s position. Nimzowitsch’s 25th move was a quiet pawn push — h6 — that did absolutely nothing. It made no attack, no capture, and no threat. Nimzowitsch then supposedly said “Jetzt müssen Sie ziehen!” (“Now you must move!”). Reuben Fine called it “the most remarkable winning move on record.” Of course, Sämisch resigned rather than move.
I think that game exemplifies this post more than anything.
Summary in ~300 Words
In Part 2, I committed to publishing the NVDA/MSFT position math with the sizing, the four break scenarios, and the specific stops. Between then and now, I’ve done 3 pieces of work (full code link at the bottom):
Built the sizing model from trailing-4-quarter capex normalized by market cap and adjusted for the vol differential
Priced out four breaking scenarios on the resulting book using historical analogs and Black-Scholes vega/theta
Interpreted the Alphabet term-structure resolution after its July 22 earnings print against what Part 2 flagged.
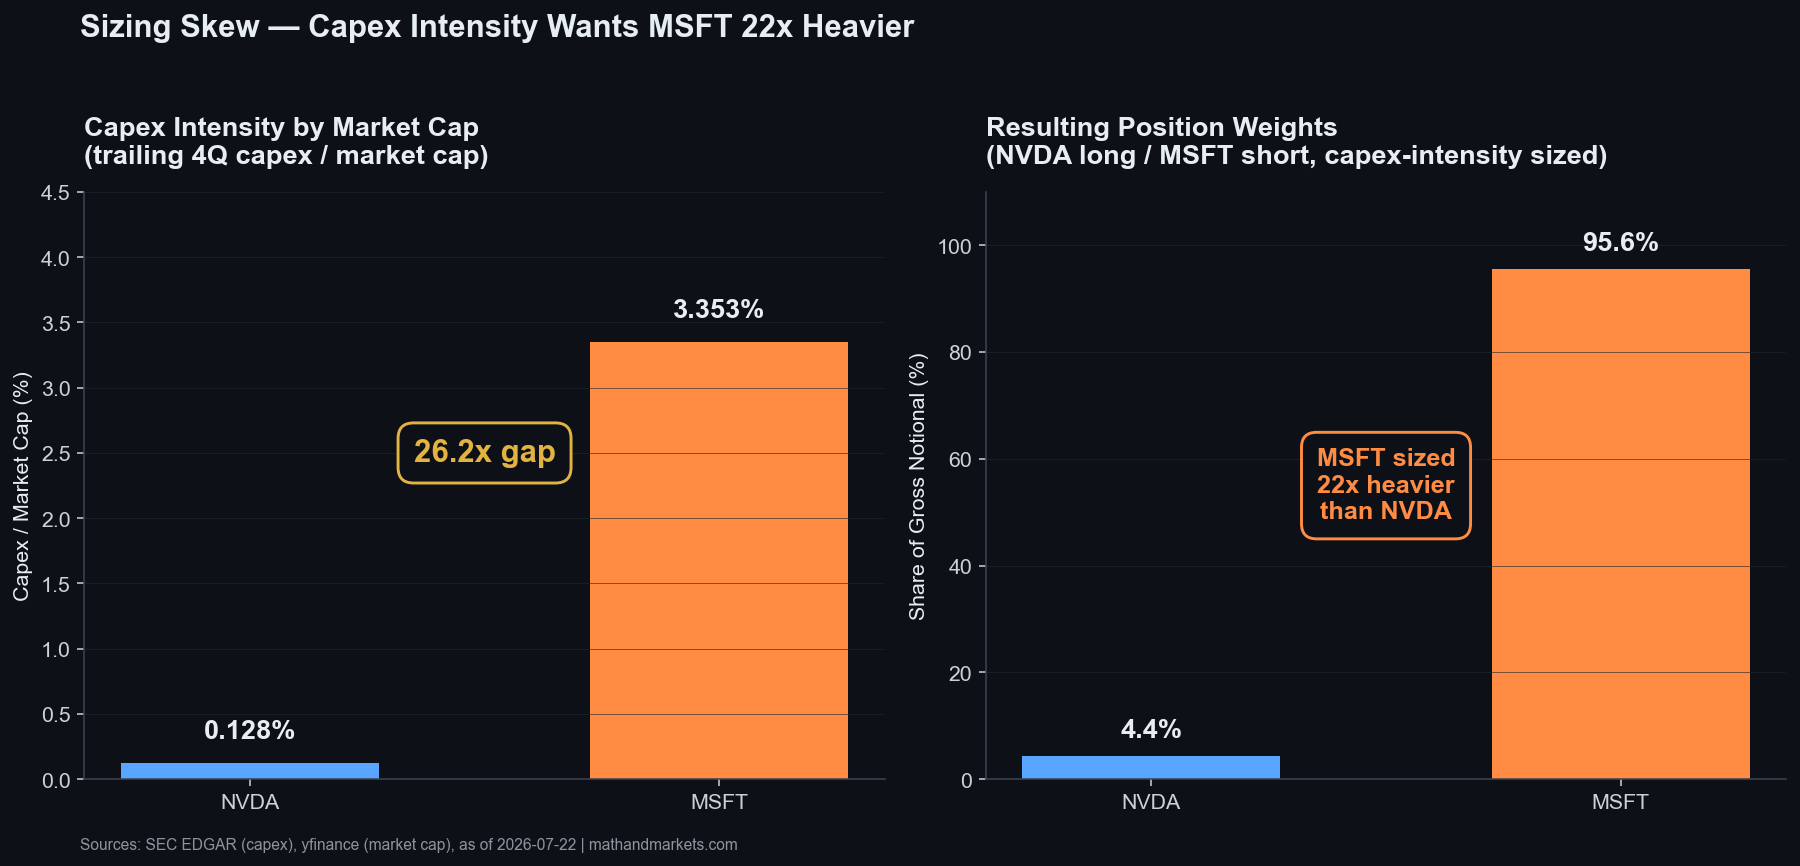
The most important takeaway is that the sizing model recommended MSFT weighted ~22x heavier than NVDA on the short vol leg.
Please note that that is a position weighting, not a return multiple. This is an important caveat.
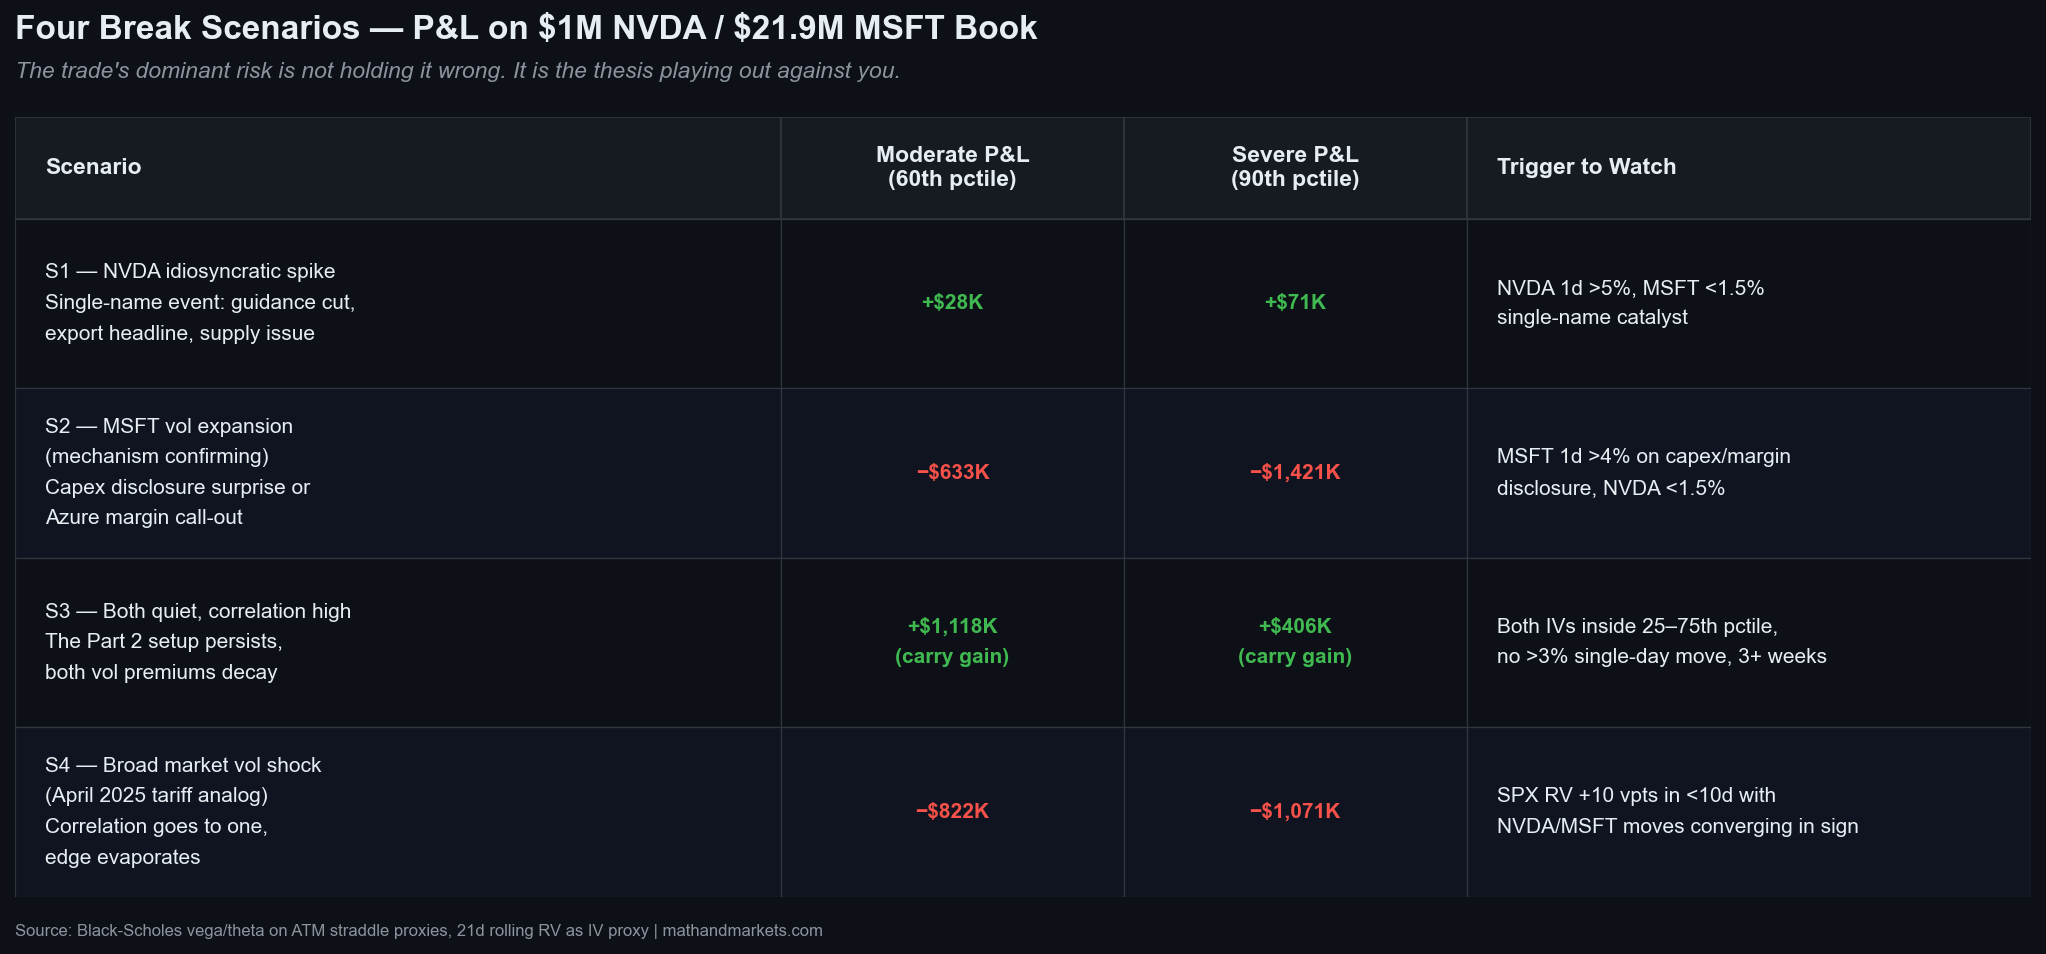
On an illustrative $1M NVDA notional / $21.9M MSFT notional book, the four scenario outcomes sit in the single-digit-percent range on gross notional, and their signs invert what the trade brief anticipated. The mechanism confirming (MSFT vol expansion on capex disclosure) is a loss of $633K to $1.42M. Both names compressing is a carry gain of $406K to $1.12M. The trade’s dominant risk is not holding it wrong but rather the thesis playing out against you.
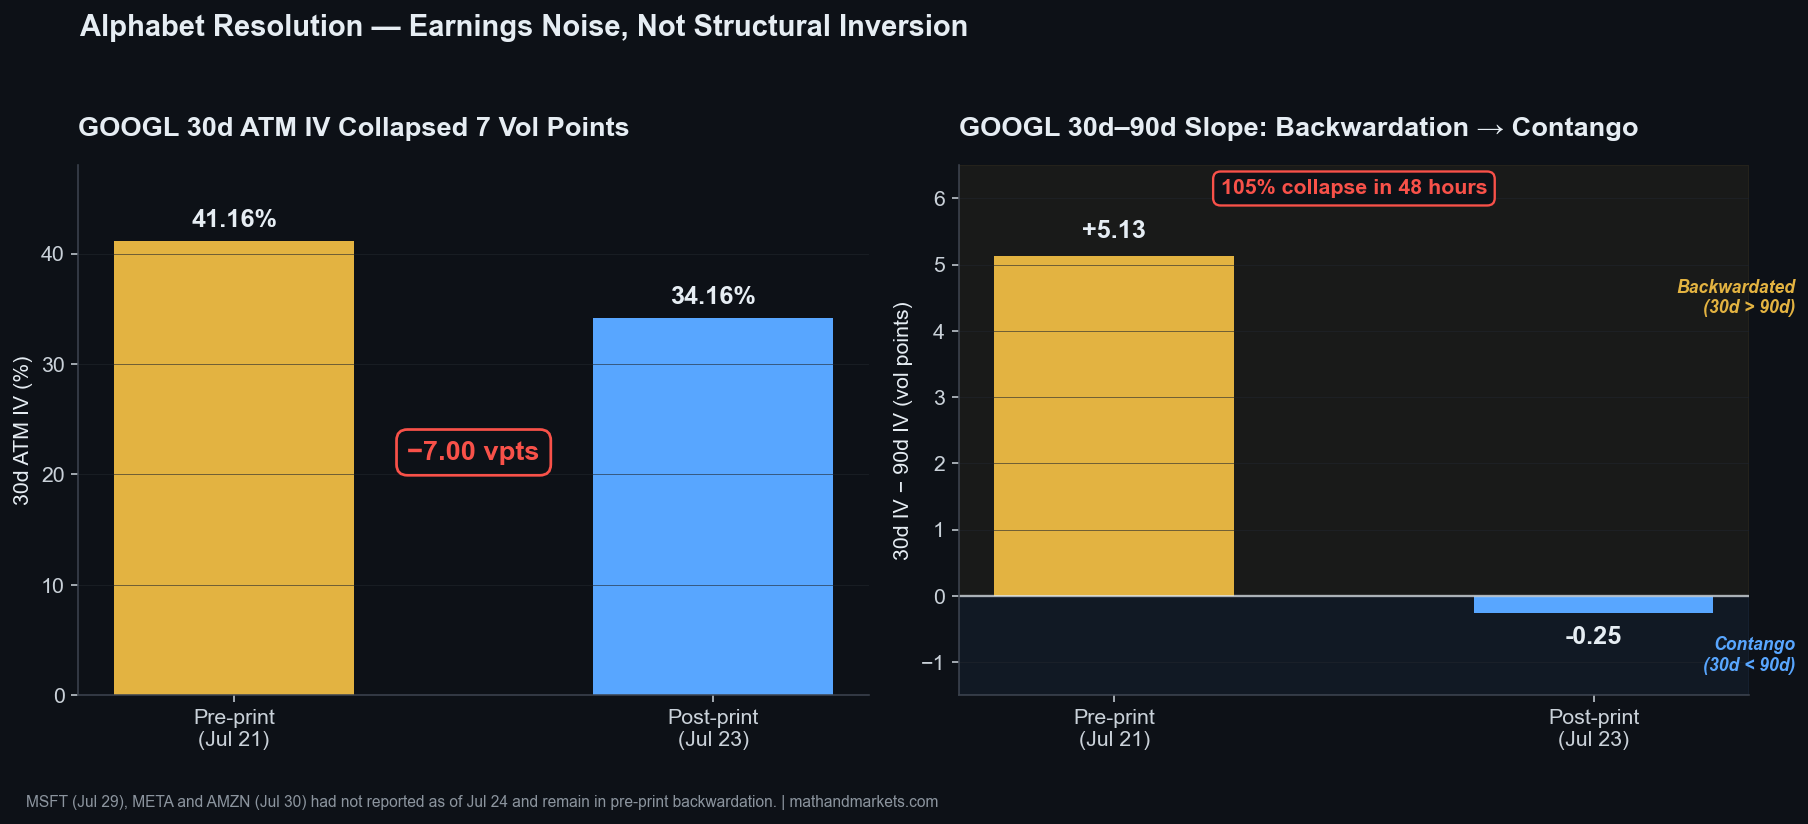
Alphabet’s term-structure signal from Part 2 resolved as earnings noise and not as a structural inversion. Alphabet’s 30d IV collapsed 7 vol points post-print and the 30d-90d slope went from +5.13 to -0.25 vpts — a 105% collapse into contango.
One note: MSFT, META, and AMZN (none of which have reported) are still in backwardation. So part 2’s quick eyeballing test was right.
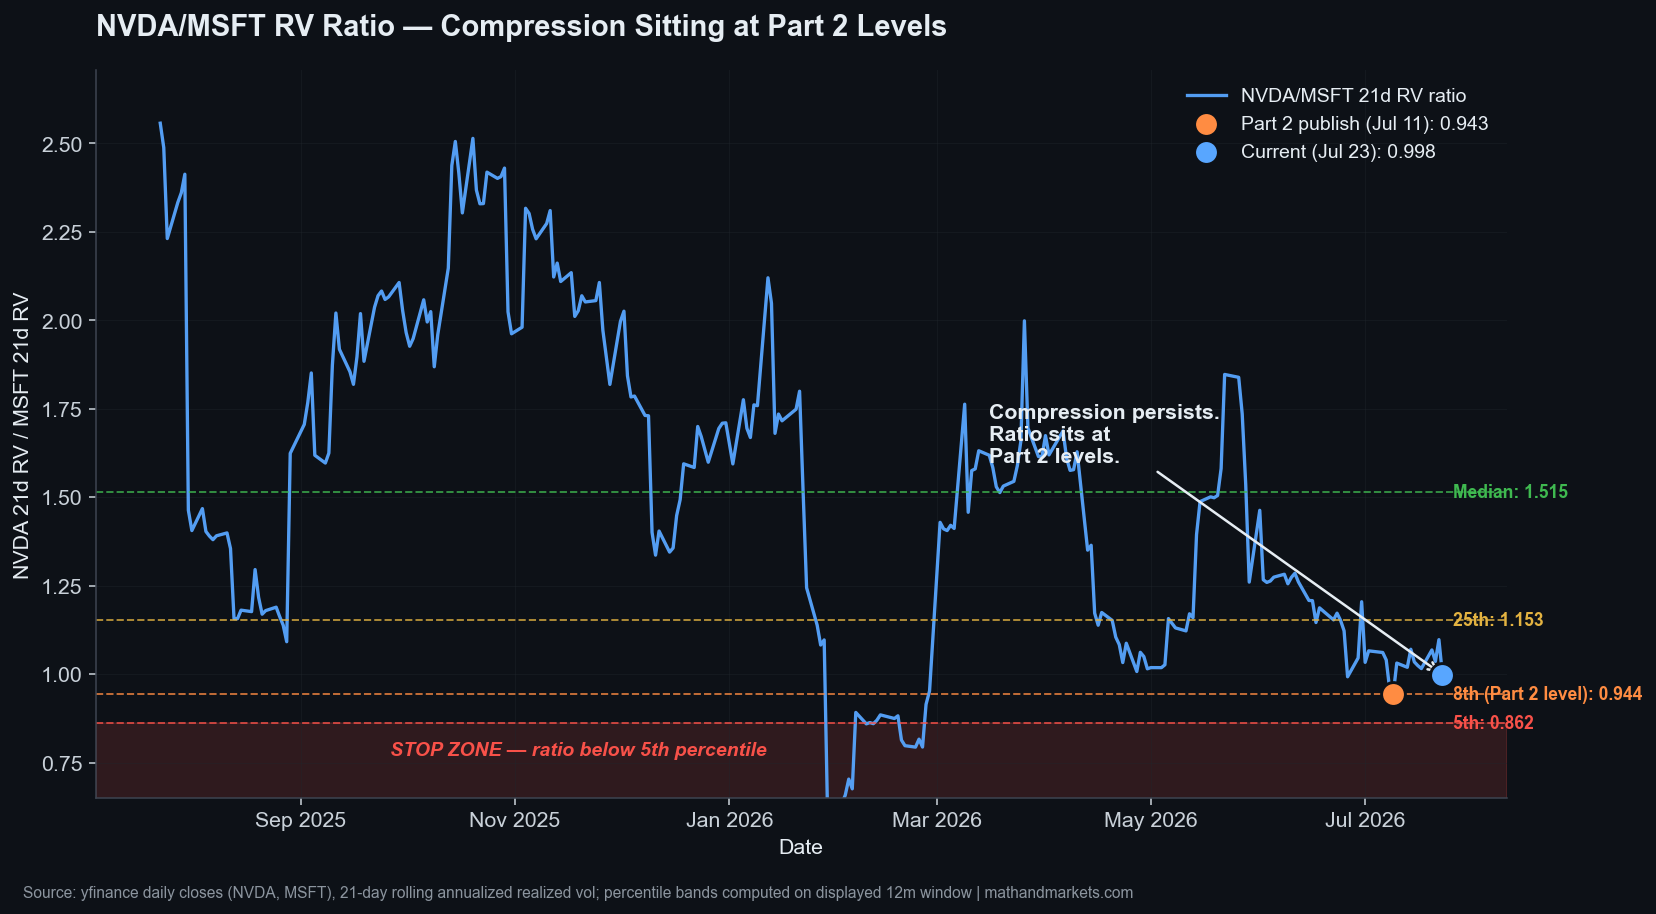
It’s important to note that NVDA/MSFT RV ratio has already moved from the 8th to the 20th percentile over two weeks.
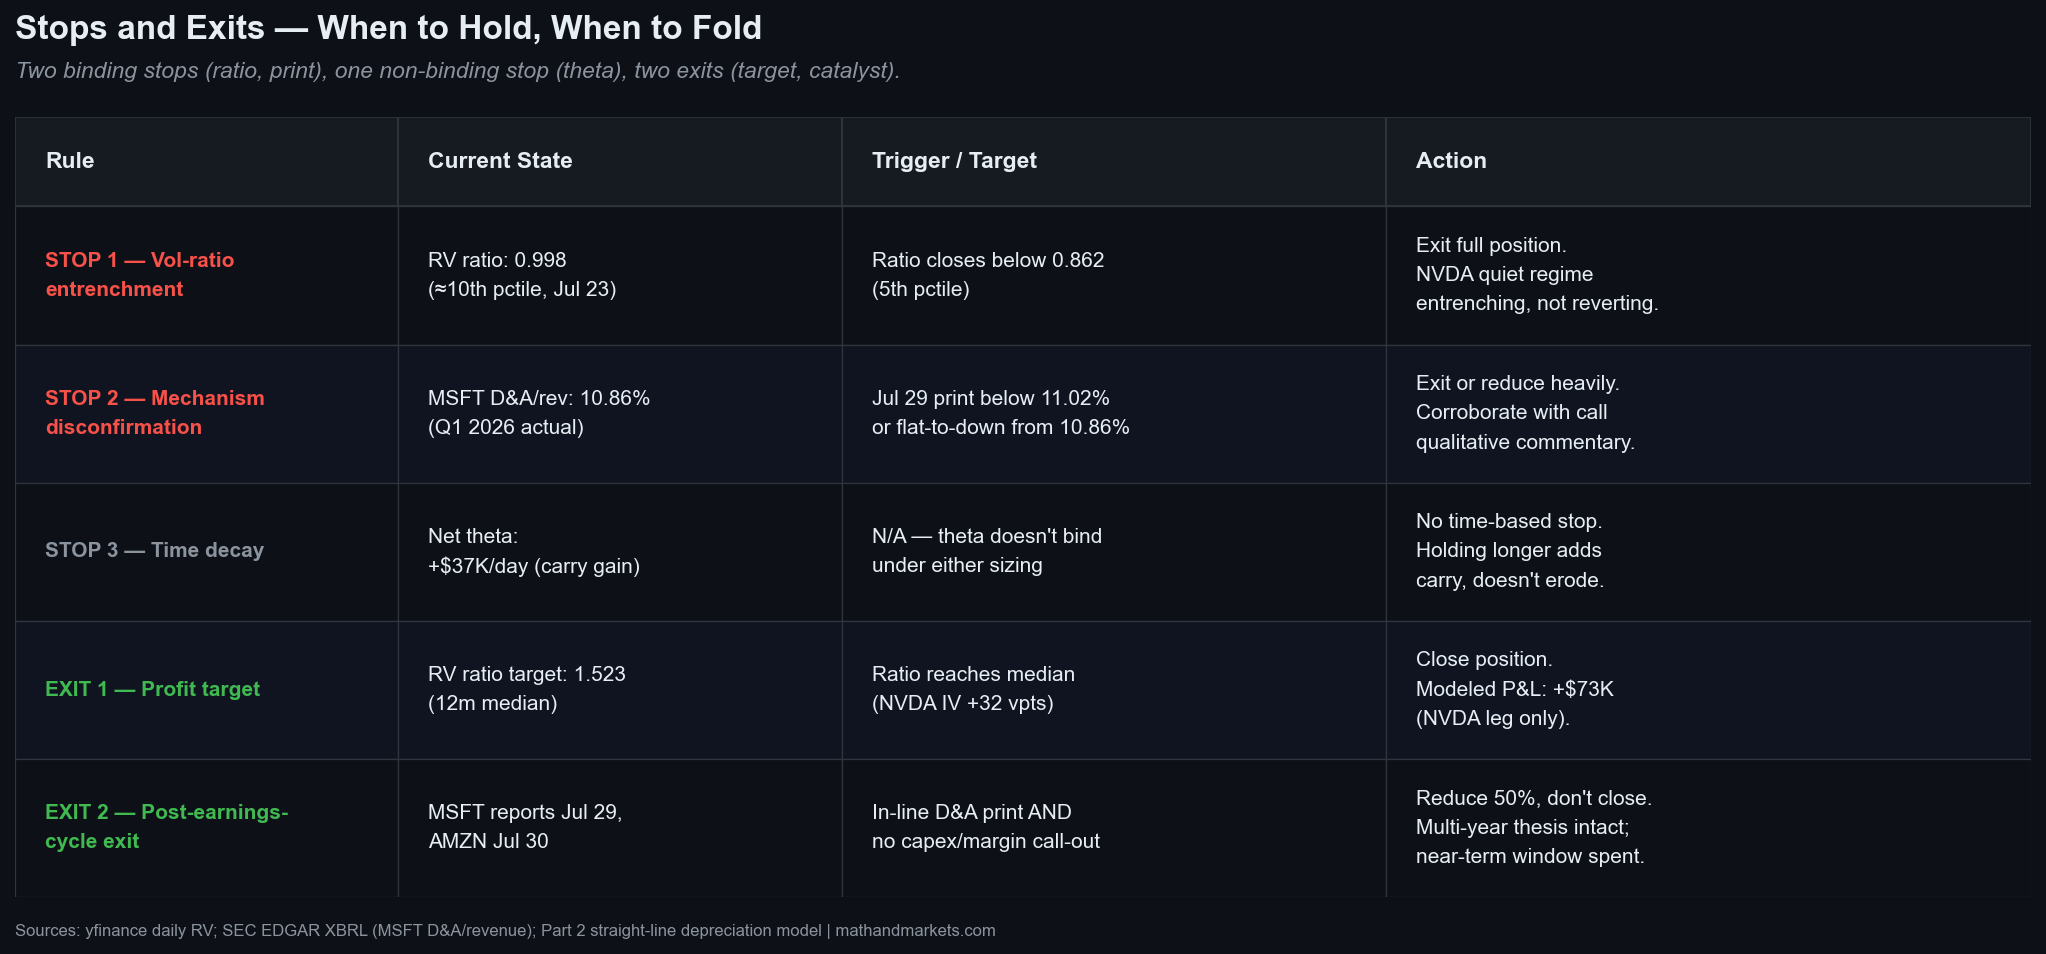
So, the trade window is narrowing. The binding stops are the ratio breaking below the 5th percentile (0.8615, currently 1.097) and MSFT’s July 29 print showing D&A/revenue below the model’s 11.02% trajectory. Theta doesn’t bind on either sizing basis — it is a tailwind at the recommended sizing and a wash at par notional.
(I ran the tests again today after market close, but I am leaving it in as an insight into the importance of using the most current information to trade…)
The NVDA/MSFT RV ratio sits at 0.998 as of July 23 close — essentially at the Part 2 level of 0.944 (8th percentile) and one bad session from the 5th-percentile stop trigger at 0.862. So the setup Part 2 identified is fully intact. The compression didn’t unwind; the Jul 22 pop to 1.097 (20th percentile) reversed the next session. Binding stops are the ratio closing below 0.862 and MSFT’s July 29 print showing D&A/revenue below the model’s 11.02% trajectory. Theta doesn’t bind on either sizing basis.
The Sizing Math
The capex-intensity approach is pretty straightforward. Take each name’s trailing-4-quarter capex, normalize by market cap, and then you use the ratio to set position size.
NVDA’s trailing-4Q capex is $6.6B against a market cap north of $5T —> so capex/mcap of 0.128%.
MSFT’s trailing-4Q capex is $97.2B against a market cap around $2.9T —> so capex/mcap of 3.353%.
That is a 26.2x gap in capex intensity by market cap, and the forward 2027 estimates push it to 30.2x.
Adjusting for the vol differential (NVDA 30d ATM IV of 39.03%, MSFT of 46.76%, so MSFT’s vega is roughly proportional to its higher spot and comparable IV level), the recommended sizing ratio is:
NVDA_notional / MSFT_notional = 0.0457
Or, equivalently: for every $1 of long NVDA vol you put on, capex-intensity math wants $21.9 of short MSFT vol on the other side. On a $1M NVDA notional basis, the paired MSFT leg is $21.88M.
That is an extreme sizing skew, so what exactly does this mean?
Well, for one it does not mean the trade returns 22x. It means the pair is weighted so heavily toward the short-MSFT leg that MSFT vol dominates the P&L on both sides — MSFT vol expansion is the worst case, MSFT vol compression is the best case, and the NVDA leg is a directional tilt riding on top.
Now, to be candid the reality is that 22x is likely too extreme to trade as a book-level exposure. A more moderate implementation would treat capex intensity as a directional bias, where it is sized somewhere between vol-equivalent (roughly par notional) and the full 22x. And do so while keeping the trade’s core logic intact. Everything that follows uses the full 22x sizing because that is what the math suggests. So you must scale the P&L linearly to your actual weighting.
The Alphabet Resolution
Now in Part 2, I said I’d publish what Alphabet’s July 22 print did to the term-structure signal. I had flagged that the Alphabet backwardation might just be pre-earnings positioning and it was (yes, yes, proud noises…) ;-)
Alphabet’s 30d ATM IV went from 41.16% pre-print to 34.16% post-print — a 7.00 vol-point collapse. The 30d-90d slope went from +5.13 vpts (backwardated) to -0.25 vpts (contango) — a 105% collapse in less than 48 hours.
GOOGL sold off 1.46% on July 22 close and 7.13% on July 23. The move was earnings-driven, and it is worth noting that the pre-print term-structure inversion was priced-in event risk vs. the options market waking up to the capex-cycle mechanism.
Now, the three hyperscalers that have not yet reported (MSFT July 29, META & AMZN July 30) continue to remain in backwardation. The Part 2 dispersion signal on the pre-print set survived Alphabet’s print. What Alphabet resolved is that we cannot read a single hyperscaler’s term structure as evidence of the mechanism being priced.
This is super important — we have to read the set collectively, and I am eager to see what happens through the MSFT and AMZN prints next week.
The Four Break Scenarios
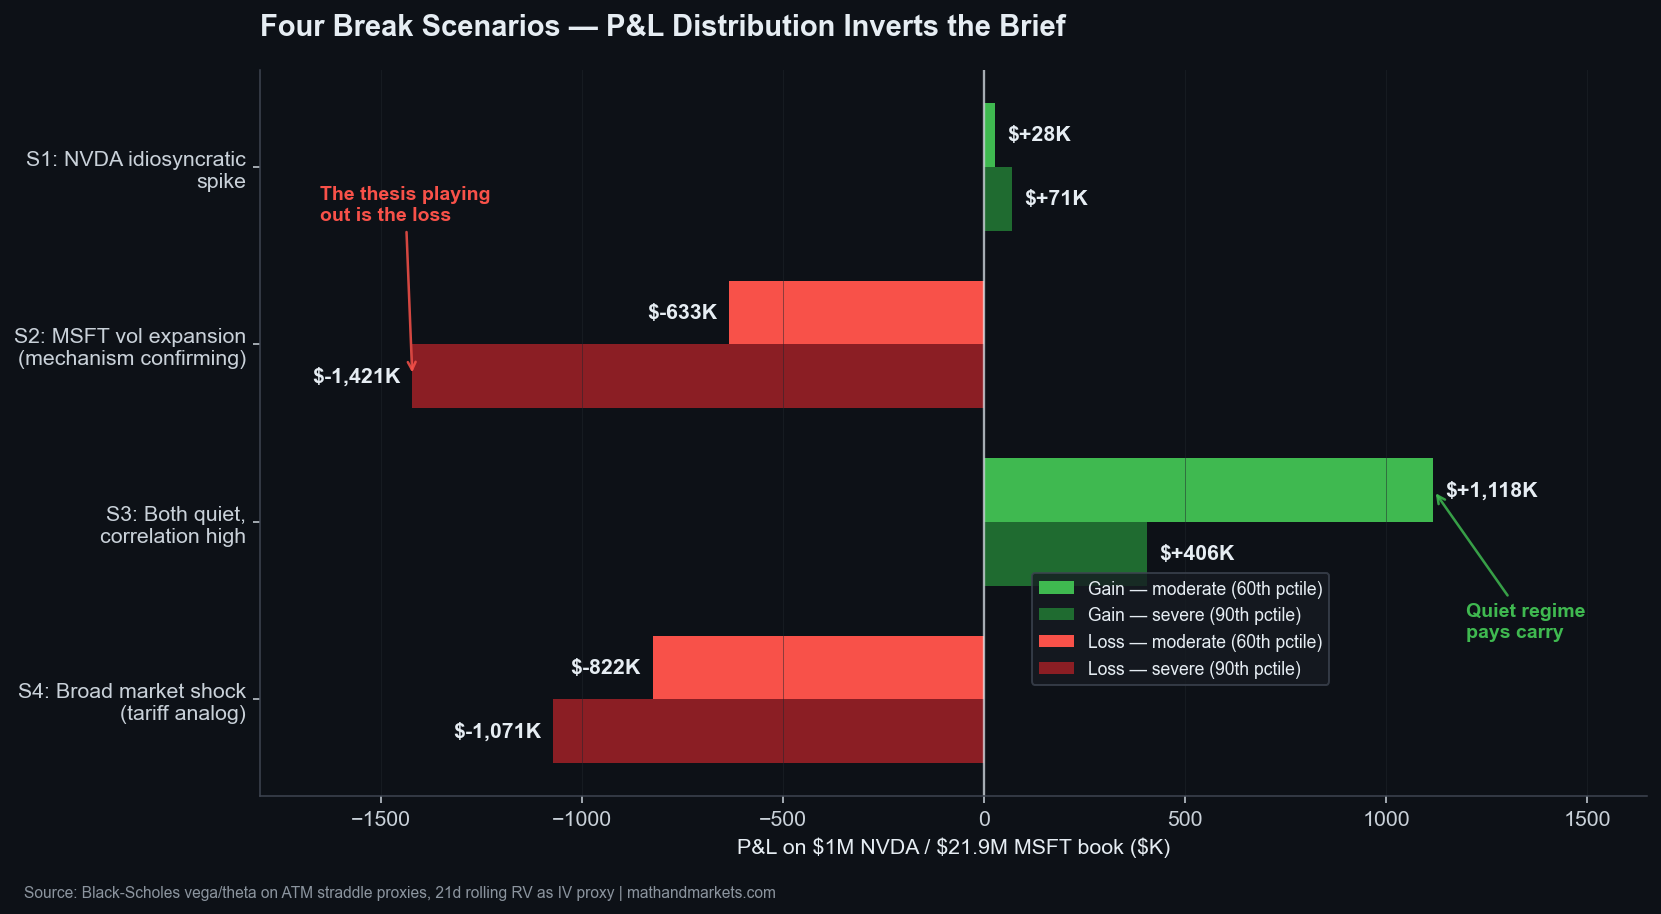
Every scenario below is priced on the illustrative $1M NVDA / $21.9M MSFT book at current spot and 30d ATM IV, using Black-Scholes vega and theta on ATM straddle proxies. You can scale linearly to your actual sizing.
Now, I can’t stress this enough — but this is directional and don’t take this as gospel. Sizing is its own thing, and you should find out what balances your risk appetite vs. ROI. If you are interested, you can read my series on the Kelly Criterion and Position Sizing.
Okay, with that out of the way, here are the four scenarios (I used Claude to model these):
Stops and Exits
Every trigger and target below is calibrated off the 21d rolling RV ratio, the trailing 12-month percentile distribution, and MSFT’s straight-line D&A/revenue trajectory from Part 2. Nothing here is a fixed price level — the ratio itself is the state variable, and it recomputes every close.
And I’ll say the same caveat as above here. Whatever stop distances and profit targets you use should reflect your own conviction, risk appetite, holding period, and how much of the position you can afford to be wrong on.
At some point, I’ll write more about the machinery behind percentile-based stops and how they compare to fixed-price stops.
What Comes Next
This closes the Tech Schism arc as I’d originally planned it. My next next post will pick up the thread that we very briefly discussed but did not fully resolve, i.e. whether the dispersion signal generalizes past the NVDA/MSFT pair to the broader hyperscaler and semi-cap-equipment complex, and what the META and AMZN prints tell us about that.
The arc’s core claim is that the AI trade is fracturing along capex-intensity lines and the options market is only partially pricing it — I firmly believe that hypothesis is still very much intact.
My experiment above is simply one implementation of that claim but obviously not the only one.
Sources: yfinance daily price history (NVDA, MSFT, GOOGL, SPX); SEC EDGAR XBRL actuals for MSFT D&A/revenue; Part 2 straight-line depreciation model for the projected quarter ending June 30, 2026; point-in-time options data for GOOGL 30d/90d ATM IV.
Full methodology and code: https://github.com/kniyer/silicon-post3
Not financial advice. Alpha is never guaranteed. Blah blah blah. Seriously, this is for educational purposes so use it as such.