
The Software Names Getting Crushed by GPU Depreciation
Part 2 of the Tech-Schism Arc: AI capex is transferring margin from software to silicon on a schedule

This is post 2 in the Tech Schism series, where I’m arguing that the tech “sector” has fractured into two economies that don’t behave the same anymore — and that the market is starting to price the fracture, but not by enough.
Previous posts: QQQ Is Lying to You opened the argument by showing SMH and IGV have decoupled 87 points YTD inside a QQQ that looks calm on the surface. The Correlation Trade Is a Trap explained why the obvious pairs trade fails, and what the real trade is.
This post is the mechanism piece: why the fracture is structural, mechanical, and running on a schedule.
The Read, In ~200 Words
The thesis. Hyperscaler AI capex is transferring 800 to 1,100 basis points of margin from software to silicon over the next three years. The mechanism is depreciation. The schedule is a straight line. Growth needs to outpace the schedule, or margin gets absorbed.
Where I’d be looking for longs. ADBE and INTU. They score lowest on every vulnerability dimension I measured. Adobe’s yield beta is the only one in the group with statistical significance. The market is already differentiating these two, and the mechanism supports the differentiation.
Where I’d be looking for shorts, or at least reducing exposure. SNOW, DDOG, and ZS. These are the compute renters with the highest gross margins, the least pricing power against hyperscaler cost pass-through, and the deepest marketplace dependencies. The mechanism hits them at the top of the P&L, where they have no operating leverage to absorb it.
Where to watch the growth story bend. MSFT is the biggest exposure by absolute dollars — Q4 2027 projected D&A hits ~17% of revenue, up from ~7% two years ago. The bull case (Azure AI grows through it) is possible. The market is pricing it as guaranteed. When Azure AI growth misses, this is where you’ll see it first.
Now the detailed analysis. Github links with code and CSVs at the bottom.
The number that started this
By Q4 2027, Microsoft’s depreciation expense will consume roughly 17% of its revenue. Today it consumes 10%. Two years ago it consumed 7%.
That’s not a growth story. That’s a margin transfer, from software’s P&L to silicon’s P&L, running quarter by quarter on a schedule no earnings call can pull forward and no rate cut can reverse.
The number matters because depreciation is not a decision. It’s the calendar. Once capex is spent and the asset is placed in service, the P&L hit arrives on a schedule you can compute from a straight line. Microsoft spent $30.9 billion on capex in Q1 2026 alone. Alphabet spent $35.7 billion. Meta spent $19.0 billion. Those dollars are already committed. The GPUs are already racked. The depreciation shows up whether or not the AI revenue does.
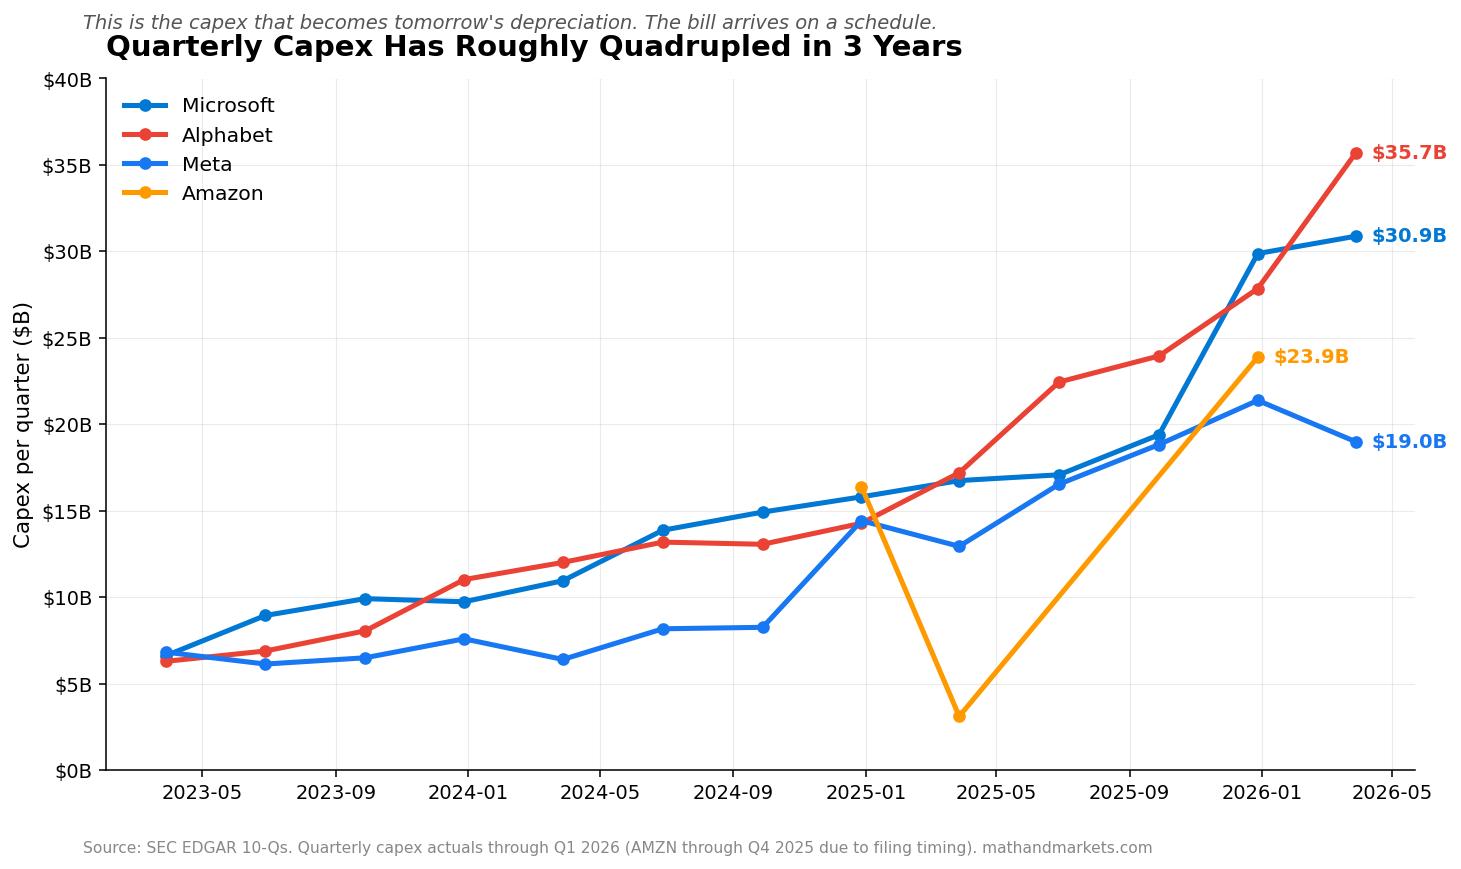
Capex quadrupled in three years. This is the fuel. What follows is the fire.
The wave hasn’t crested
Straight-line depreciation is boring, and that’s the point. It’s why the mechanism is legible.
Take the capex a hyperscaler has already committed. Assume a useful life — Meta explicitly discloses 5 years for AI hardware, Amazon uses 5 years for servers, Microsoft and Alphabet use 6 years. Divide capex by useful life. That’s your depreciation run rate from that cohort. Do it every quarter, cumulate, and you get a curve.
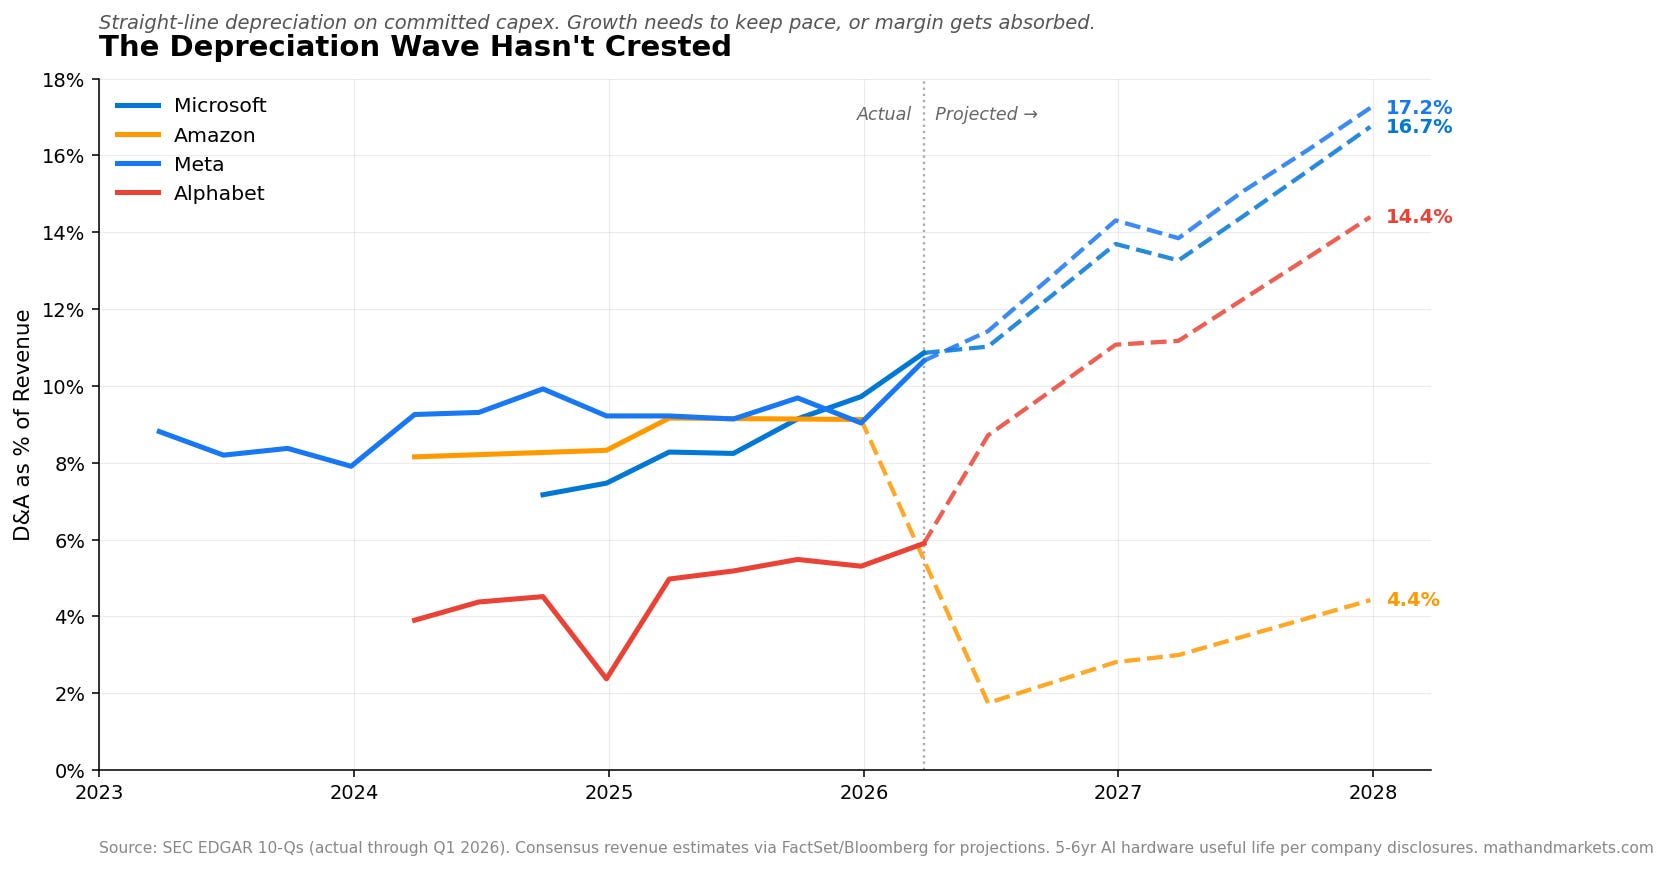
The curve is not close to done climbing. Meta’s D&A goes from $15.5B in 2024 to a projected $37.4B in 2027 — a 141% increase. Meta’s D&A-to-revenue ratio moves from 9.4% to 15.6%. That is 614 basis points of gross margin that has to come from somewhere.
Alphabet: $15.3B to $57.9B, up 278%. D&A-to-revenue from 4.4% to 12.8%. That’s 841 basis points.
Microsoft: $9.9B to $53.7B, up 442%. D&A-to-revenue from 4.0% to 15.0%. That’s 1,096 basis points. Over eleven points of revenue in three years, on the largest software company in the world.
Amazon is the exception, and worth pausing on. Their trajectory looks flat because AWS revenue is already large enough and growing fast enough to absorb depreciation on the current capex trajectory. Amazon has been running heavy infrastructure spend for longer, and the base is already there. The other three are still climbing the same curve Amazon climbed years ago.
None of this requires an AI winter. None of it requires a growth disappointment. It just requires the calendar.
What growth would have to do to save this
There’s exactly one thing that saves this. Revenue has to grow fast enough to keep the ratio flat.
If you do the math on Microsoft, total revenue for the last twelve months is around $328B. For D&A/revenue to hold at 10% through 2027 — not improve, just not deteriorate — revenue has to grow to roughly $537B. That’s 64% growth in eighteen months. Consensus is not pricing that.
Alphabet: from ~$400B to ~$580B just to hold the D&A/revenue ratio at ~5%. Meta: from ~$180B to ~$240B to keep the ratio flat. These are not growth numbers. They are growth numbers plus the assumption that Azure AI, Google Cloud AI, and Meta’s AI monetization all convert at rates no one has yet demonstrated.
The market is currently paying multiples that require these growth numbers to arrive. If they don’t, the depreciation still does.
Why the coal-to-gas parallel breaks
The obvious analogy is coal-to-gas. Utilities in the 2010-2015 window were locked into new natural gas capex while their coal cost structure remained. Depreciation on the new gas plants hit their P&L. Their margins should have compressed. That story maps neatly onto software absorbing hyperscaler infrastructure depreciation.
I ran the numbers — but it doesn’t hold.
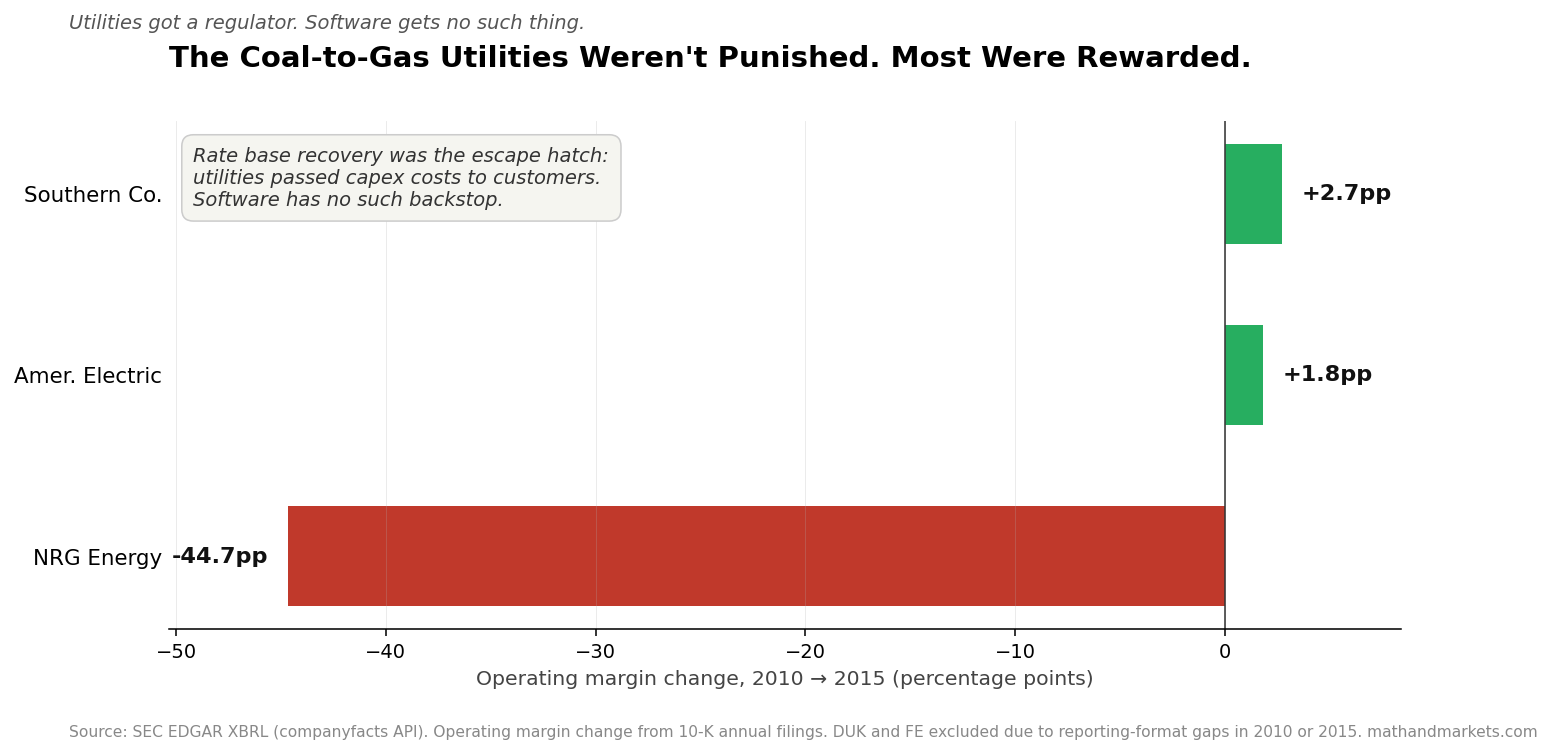
Southern Company’s operating margin expanded by 270 basis points from 2010 to 2015. American Electric Power’s expanded by 180. Their D&A-to-revenue ratios did rise — SO by 3.2 percentage points, AEP by 0.8 — but operating margins expanded anyway. Total returns for both crushed the utility ETF by 10 to 41 percentage points.
The utilities that got hurt in that window got hurt for different reasons. NRG collapsed 47%, but NRG was a merchant power generator exposed to spot electricity prices. The story was commodity, not capex.
So the historical parallel doesn’t validate the software thesis. It actively undermines it — until you understand why.
Utilities have a rate base. When they commit capex, they file for rate recovery, and the regulator grants them a return on that invested capital. Depreciation flows through the P&L, but revenue rises in tandem to absorb it. Utilities weren’t punished for spending on gas capacity. They were rewarded for it.
Software has no rate base.
There is no regulator who will grant Microsoft the right to raise Office 365 prices by 12% to offset AI infrastructure depreciation. There is no filing Snowflake can make to pass through GPU costs to customers on a mandated schedule. When capex hits the P&L as depreciation, the only offset is to grow revenue faster than the ratio can rise, or to compress operating cost elsewhere. That’s not rate recovery. That’s execution.
The coal-to-gas analogy fails as a parallel and succeeds as a contrast. Utilities were protected by regulation. Software isn’t protected by anything.
Two ways to die of the same disease
The margin transfer doesn’t hit all software equally. It hits differently depending on where the depreciation lands. There are two mechanisms, and they produce different mortality tables.
The Capex Payers carry the depreciation on their own balance sheet. Microsoft, Alphabet, Meta, Amazon, and Oracle are the obvious ones — they are the hyperscalers, spending the money, absorbing the D&A directly. Their gross margin is the residual after their own AI infrastructure costs are booked as depreciation and running costs. As their D&A/revenue ratio climbs, their operating margin compresses by the same amount unless revenue growth outpaces the schedule.
The Compute Renters don’t own the infrastructure. They pay AWS, Azure, and GCP for compute, and that bill shows up in their COGS. When hyperscaler pricing rises to recover their depreciation — and it will — the fees flow through to the renters as gross margin compression at the top of the P&L. There is no operating leverage story that saves them, because the compression happens before operating expenses. They can only outrun it by raising their prices to their customers faster than their infrastructure costs are rising.
That is the “so what” of the compute renter mechanism, in plain English. Their COGS just gets more expensive, and the only way out is to hike prices faster than the vendors upstream of them.
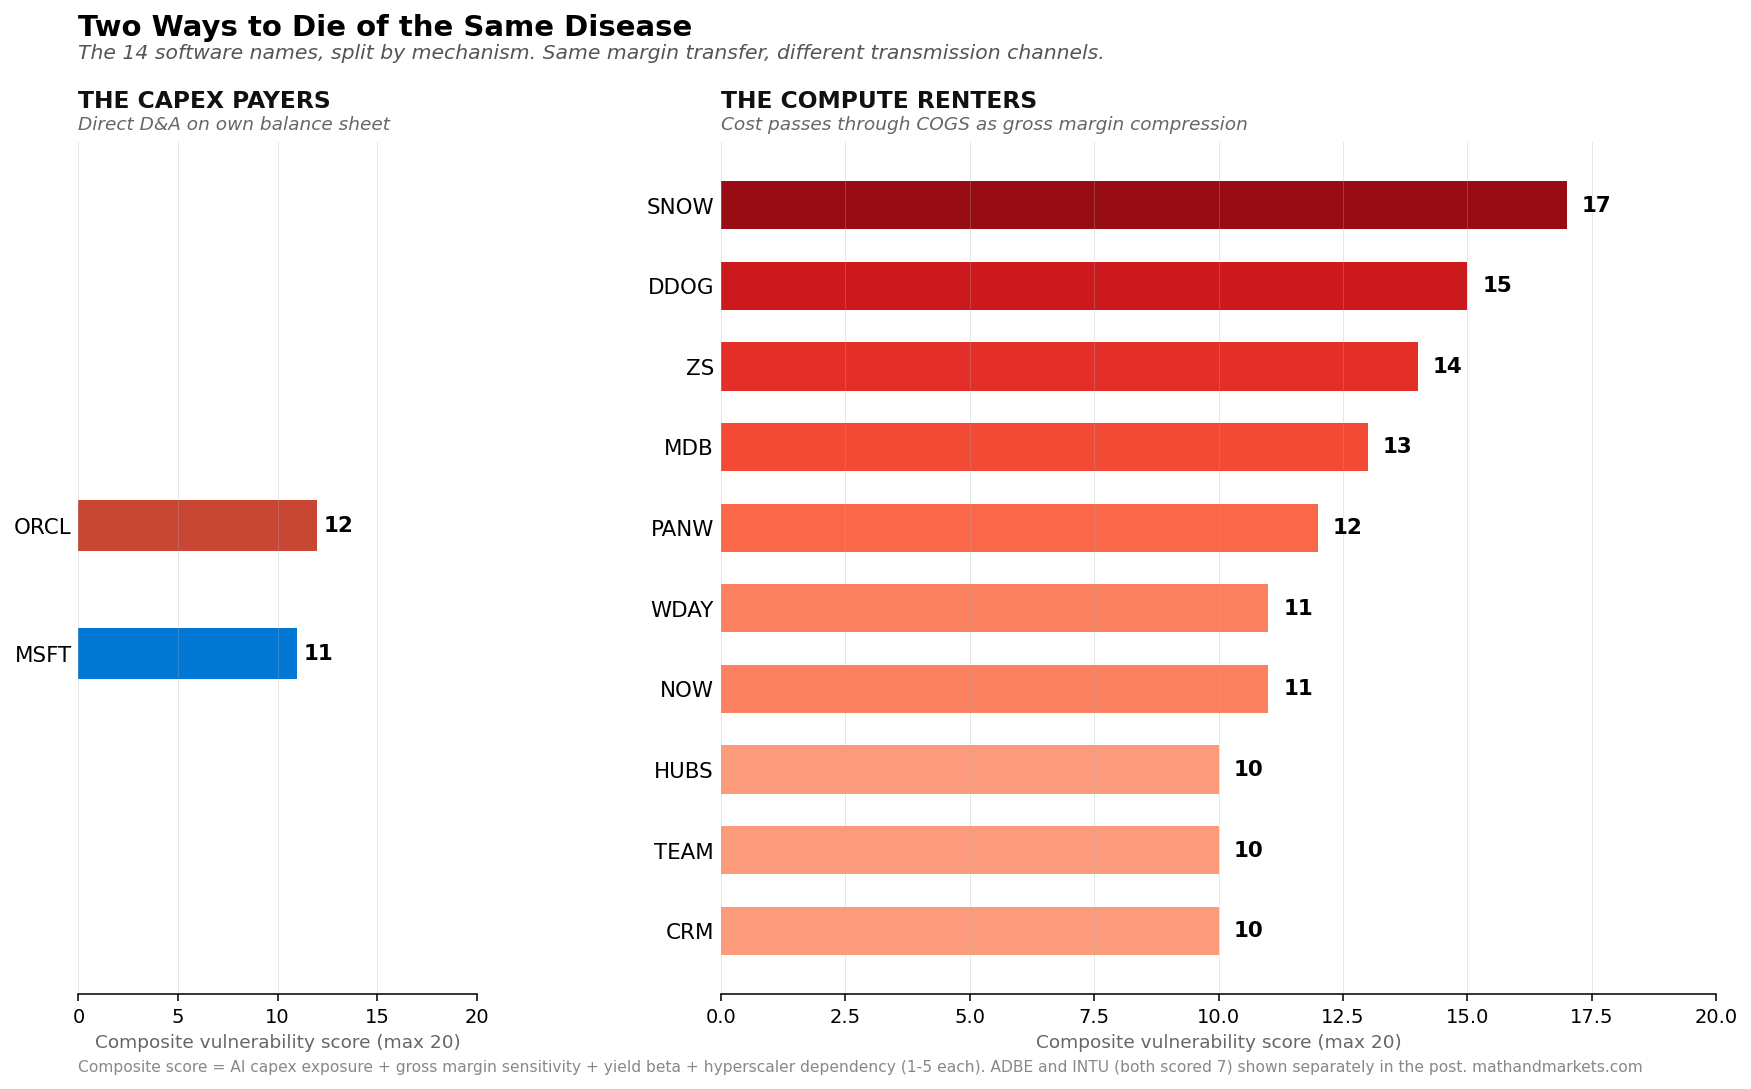
The Compute Renters — ranked
I scored ten pure-SaaS names on four dimensions: (A) AI capex exposure, (B) gross margin sensitivity, (C) yield beta from a 2023–2026 weekly regression, and (D) hyperscaler dependency. Each dimension scored 1 to 5. Composite score is the sum, range 4 to 20.
The top three by composite:
SNOW (17) — Snowflake is the purest expression of the mechanism. It runs entirely on AWS/Azure/GCP infrastructure. Its Cortex AI product runs on hyperscaler GPU-backed workloads. Its ~66% product gross margin already absorbs infrastructure pass-through and rises directly with compute-intensive AI workloads. If hyperscaler unit economics tighten — which the depreciation math says they will — Snowflake’s COGS rises whether or not Snowflake changes anything about how it operates. SNOW has the least optionality to offset the transfer.
DDOG (15) — Datadog’s LLM observability and AI monitoring segments are among the fastest-growing lines in the pipeline, which sounds like the good news until you notice the delivery mechanism. Roughly 35% of contracts flow through hyperscaler marketplaces and co-sell motions. The ~81% gross margin has farther to fall than most, and ingestion pipelines are getting more compute-heavy, not less. High margin plus rising infrastructure pass-through equals large absolute compression.
ZS (14) — Zscaler operates its own Zero Trust infrastructure, which sounds like a hedge, but the platform relies on hyperscaler transit and its yield beta (+0.061) suggests the market is not pricing it as a rate-cut winner. About 30% of bookings run through hyperscaler marketplace co-sell. Gross margin (~78%) is high enough that a 200-300 basis point pass-through hit is visible in the P&L.
Below the top three, the middle (MDB at 13, PANW at 12, WDAY/NOW at 11) tells a more nuanced story that I’ll pick up separately with the options-chain read. The composite treats them as similar, but the market is not.
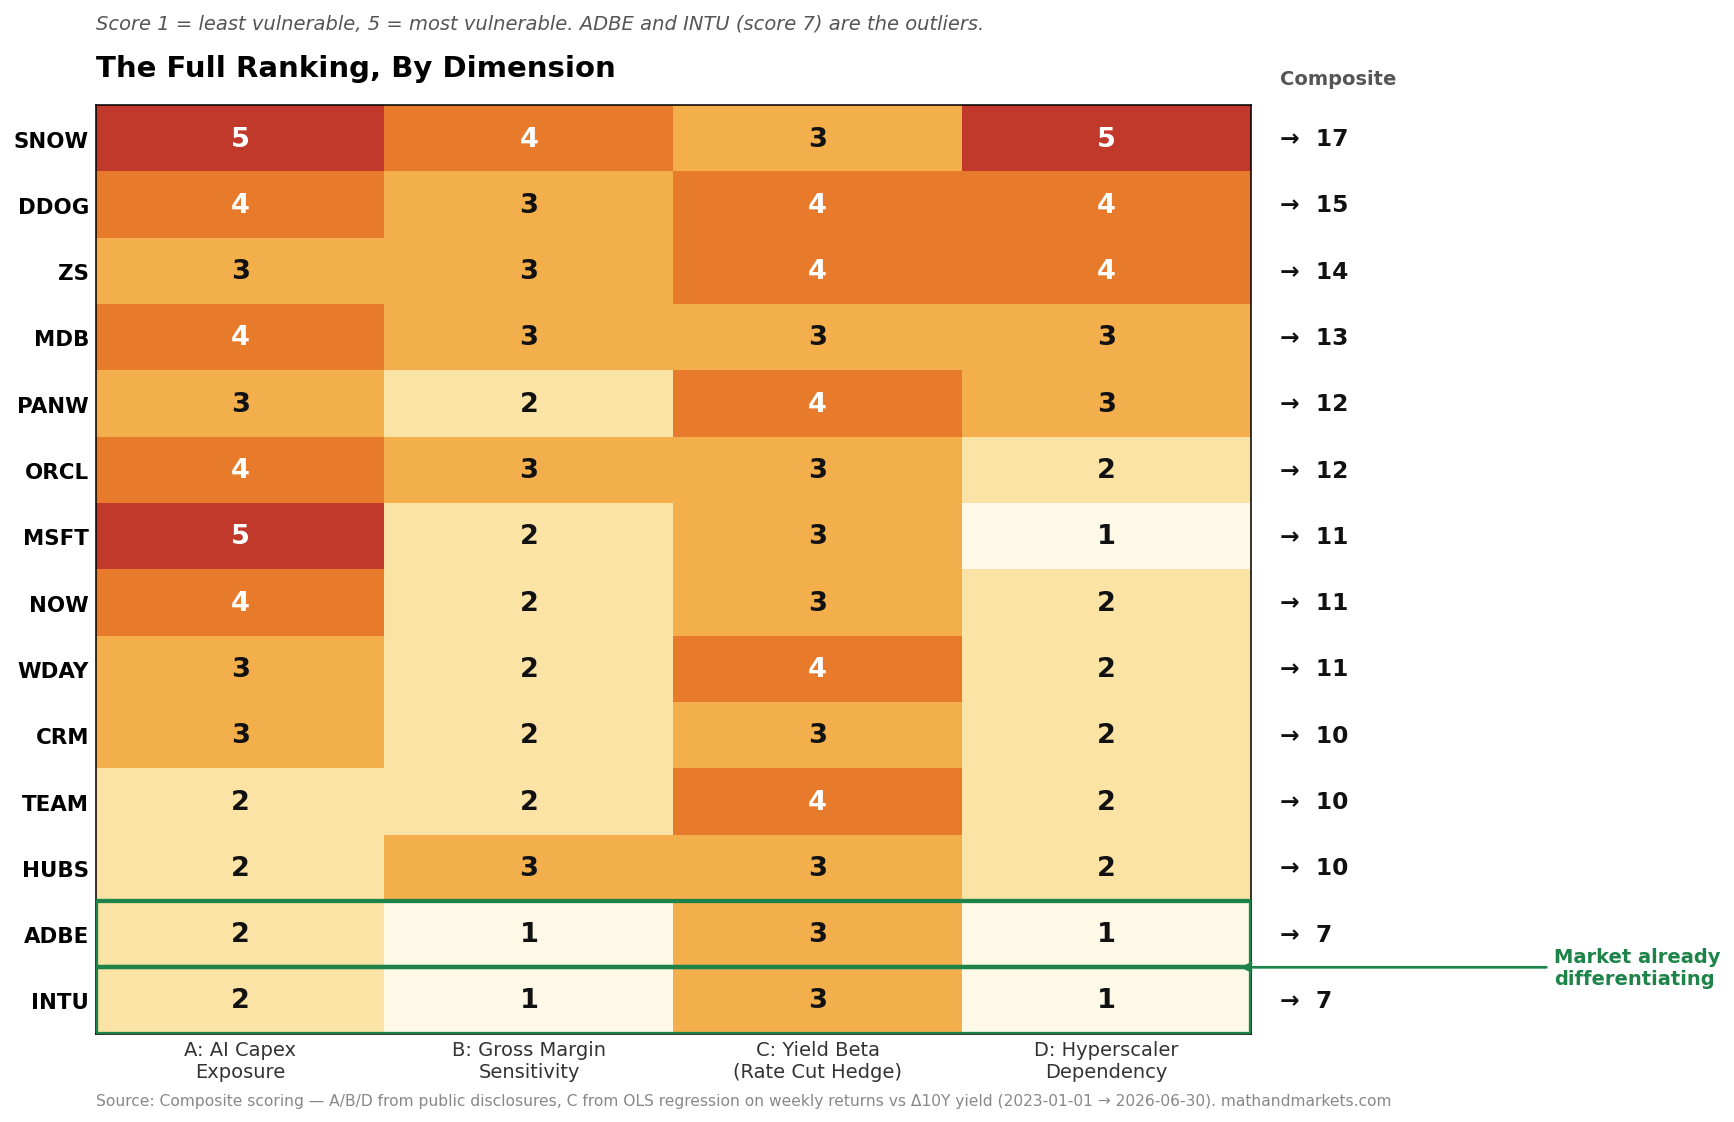
The heatmap shows why the composite alone hides the argument. SNOW’s 17 comes from A=5 and D=5 — the mechanism hits it from both ends. DDOG’s 15 comes from C=4 and D=4 — market pricing and channel exposure. ZS’s 14 comes almost entirely from C and D — the yield beta says the market doesn’t see it as a rate-cut winner, and the marketplace dependency makes hyperscaler pricing a pass-through hit. The mechanism doesn’t score them equally, even when the composite does.
The Capex Payers — MSFT and ORCL, honestly
Microsoft scores 11, ranked below Snowflake and Datadog in a composite scoring system. That’s a scoring artifact, not a mechanism claim. Microsoft is the largest AI capex payer in the world by absolute dollars. Its Q4 2027 projected D&A/revenue ratio is 16.7%, up from ~7% just two years ago. On a mechanism basis, MSFT is the most exposed name on the list.
The reason the composite understates it is straightforward: MSFT scores low on hyperscaler dependency (it is the hyperscaler) and low on gross margin sensitivity (it’s already at 68% and has been steady). Both are true. Neither offsets the fact that a 1,000 basis point swing in D&A/revenue over three years is a very large number to absorb.
There is a counter-argument, and it deserves to be stated fairly. Azure AI revenue is growing quickly. If it grows fast enough, MSFT can compound through the depreciation wave, absorb the ratio increase in a rising revenue base, and preserve margins. That is the bull case. It is possible.
But the market is currently pricing that outcome as if it is guaranteed. Microsoft’s forward multiple assumes AI revenue conversion at a rate that requires everything to go right — hyperscaler GPU utilization to stay high, enterprise AI adoption to accelerate, and no competitive pressure on Azure AI pricing. If any of those assumptions bends, the depreciation still lands on schedule. That’s the asymmetry.
Oracle at composite 12 is the same story in miniature. OCI is Oracle’s flagship growth engine, and its GPU cluster buildout has moved Oracle from software-multiple to hyperscaler-multiple territory. If OCI revenue grows into the capex, Oracle rerates. If it doesn’t, Oracle has taken on hyperscaler-scale depreciation without hyperscaler-scale absorption capacity. The dispersion in outcomes is wider for ORCL than for MSFT, but the mechanism is identical.
The names the market is already differentiating
Two names scored 7 on the composite — the lowest scores in the group: Adobe (ADBE) and Intuit (INTU).
Adobe carries a ~89% gross margin, uses its own infrastructure for Firefly AI, has minimal hyperscaler dependency, and sells through direct enterprise and consumer channels. Intuit runs at ~79% gross margin, its AI features (TurboTax, Assist) are ancillary to the core tax and SMB workflows, and its infrastructure exposure to hyperscaler GPU pricing is close to zero. Neither company is in the depreciation-wave supply chain in any meaningful way.
If the thesis in this post is correct — margin transfer from software to silicon is real and mechanical — then ADBE and INTU should trade very differently from the top of the vulnerability ranking. Adobe’s yield beta (-0.051) is the only regression in the 14 with a p-value below 0.10 — the market is already pricing Adobe as a rate-cut winner in a way it isn’t pricing the others. Intuit’s beta is smaller but similarly directional.
The market is already pricing the mechanism. It’s just pricing it name by name, with dispersion, without saying out loud what the dispersion is about. What the depreciation math above does is name the mechanism.
The Read, Again
The thesis one more time, at the end where it belongs:
Software is transferring margin to silicon. The mechanism is depreciation on committed capex, running on a schedule. The Capex Payers absorb it directly on their P&L. The Compute Renters absorb it through hyperscaler cost pass-through into their COGS. The names insulated from both mechanisms — ADBE, INTU — are the ones the market is already treating differently, and the mechanism supports that treatment.
Where I’d be looking for longs: ADBE, INTU. The mechanism doesn’t touch them, and the market is starting to price the difference.
Where I’d be looking for shorts or reducing exposure: SNOW, DDOG, ZS. Highest gross margins in the compute renter group, weakest pricing power against hyperscaler cost pass-through, deepest marketplace dependencies.
Where to watch the growth story bend: MSFT, ORCL. Both are pricing the growth-through-depreciation story as if it’s guaranteed. It isn’t. When it bends, it bends fast.
None of this is a recommendation to buy or sell any specific security. It is an argument about where the burden of proof sits, name by name. Utilities in 2010-2015 got saved by their regulator. Software has no regulator. Whoever gets saved has to earn it in the market.
Sources: SEC EDGAR XBRL companyfacts API (all quarterly and annual financials); consensus revenue estimates for 2026–2027 projections via FactSet/Bloomberg (approximate, ~July 2026); yfinance for total return calculations; EIA Natural Gas Monthly Table 9.11 and Electric Power Annual Table 6.1 for coal-to-gas macro context. Yield beta regressions run over 2023-01-01 to 2026-06-30 weekly returns. Vulnerability composite is unweighted (1-5 per dimension); a weighted score would rerank materially. Straight-line depreciation model assumes AI-attributable capex is depreciated over disclosed useful life (5 years META/AMZN, 6 years MSFT/GOOGL). The AI-attributable estimate is a proxy based on baseline capex trend extrapolation; no hyperscaler discloses AI capex as a formal line item. Analysis performed July 10, 2026.
Full code and analysis available at: https://github.com/kniyer/software-vs-silicon
Part 2 next Wednesday, July 15, is the market-in-motion companion piece: Software Is Dead. Long Live Silicon. Part 2 — What the Options Chain Says. Fresh data, pulled the morning of, on how the vol surface is pricing the mechanism this post just laid out. Which names have implied-vol setups that reflect the exposure. Which don’t, and why the mispricing might be the trade. Different reader, different job. If Part 1 was the mechanism, Part 2 is the read on how the market is currently pricing it — and where the gap is.
Post 3 the Saturday after — July 25 — is the trade writeup. Long NVDA, short MSFT, sized by capex intensity rather than realized vol, with the exact position math, the four ways the trade breaks, and the specific stop and exit conditions. It’s a fundamental thesis expressed as a pair, not a correlation edge with a fundamental story tacked on.
As always, the material presented in Math & Markets is for informational purposes only. It does not constitute investment or financial advice.
Alpha is never guaranteed and the backtest is a liar until proven otherwise.