
The Correlation Trade Is a Trap. The Capex Trade Isn't
Buying SMH and shorting IGV on a correlation signal. Three failed stress tests.

Last Saturday I published QQQ Is Lying to You — Part 1 of the Tech Schism series. The argument: an 87-point year-to-date spread between SMH and IGV inside a benign-looking +15% Nasdaq is not sentiment, it’s a structural capital transfer, and it’s still accelerating.
Doc McGraw and I were chatting on how we could trade this and I went down a rabbit hole. I ran the numbers on the tradable version of my own thesis and here are the findings.
The setup
The natural follow-up to Post 1 was obvious: if the schism is real, how would you trade it? Long SMH, short IGV, size it vol-equalized, and wait for mean reversion.
Doc raised the point that the bid-ask spread for those would be pretty wide, so I started looking at actual names — notably MSFT and NVDA.
I was mid-planning that trade when Doc pushed back. His question was this: “We need something we can actually reproduce. Individual-name capex analysis is fundamental work — how do we do this with ETFs and standard correlation primitives? Something like MAGS versus IGV, on rolling 1-month correlation, with vol-equalized sizing.”
That’s a good question, and it’s the right question for a systematic trader. So I went and ran some tests.
Three tests, in order:
Is the current correlation z-score actually rare — or is this pair fracturing at its historical baseline?
Does entering the trade at low-correlation readings actually produce forward returns?
Does the vol-equalized sizing hold up between rebalances, or does the hedge drift so fast that “vol-neutral” is a fiction?
I set the tests up so they could kill the systematic trade cleanly. All three did.
Test 1: the “rare event” framing was wrong
Post 1 leaned on the SMH/IGV divergence being unusual — an outlier in a market that mostly moves as one asset class. The correlation z-score sits at −2.69 on a 3-month window. On its face, that looks tail.
It isn’t.
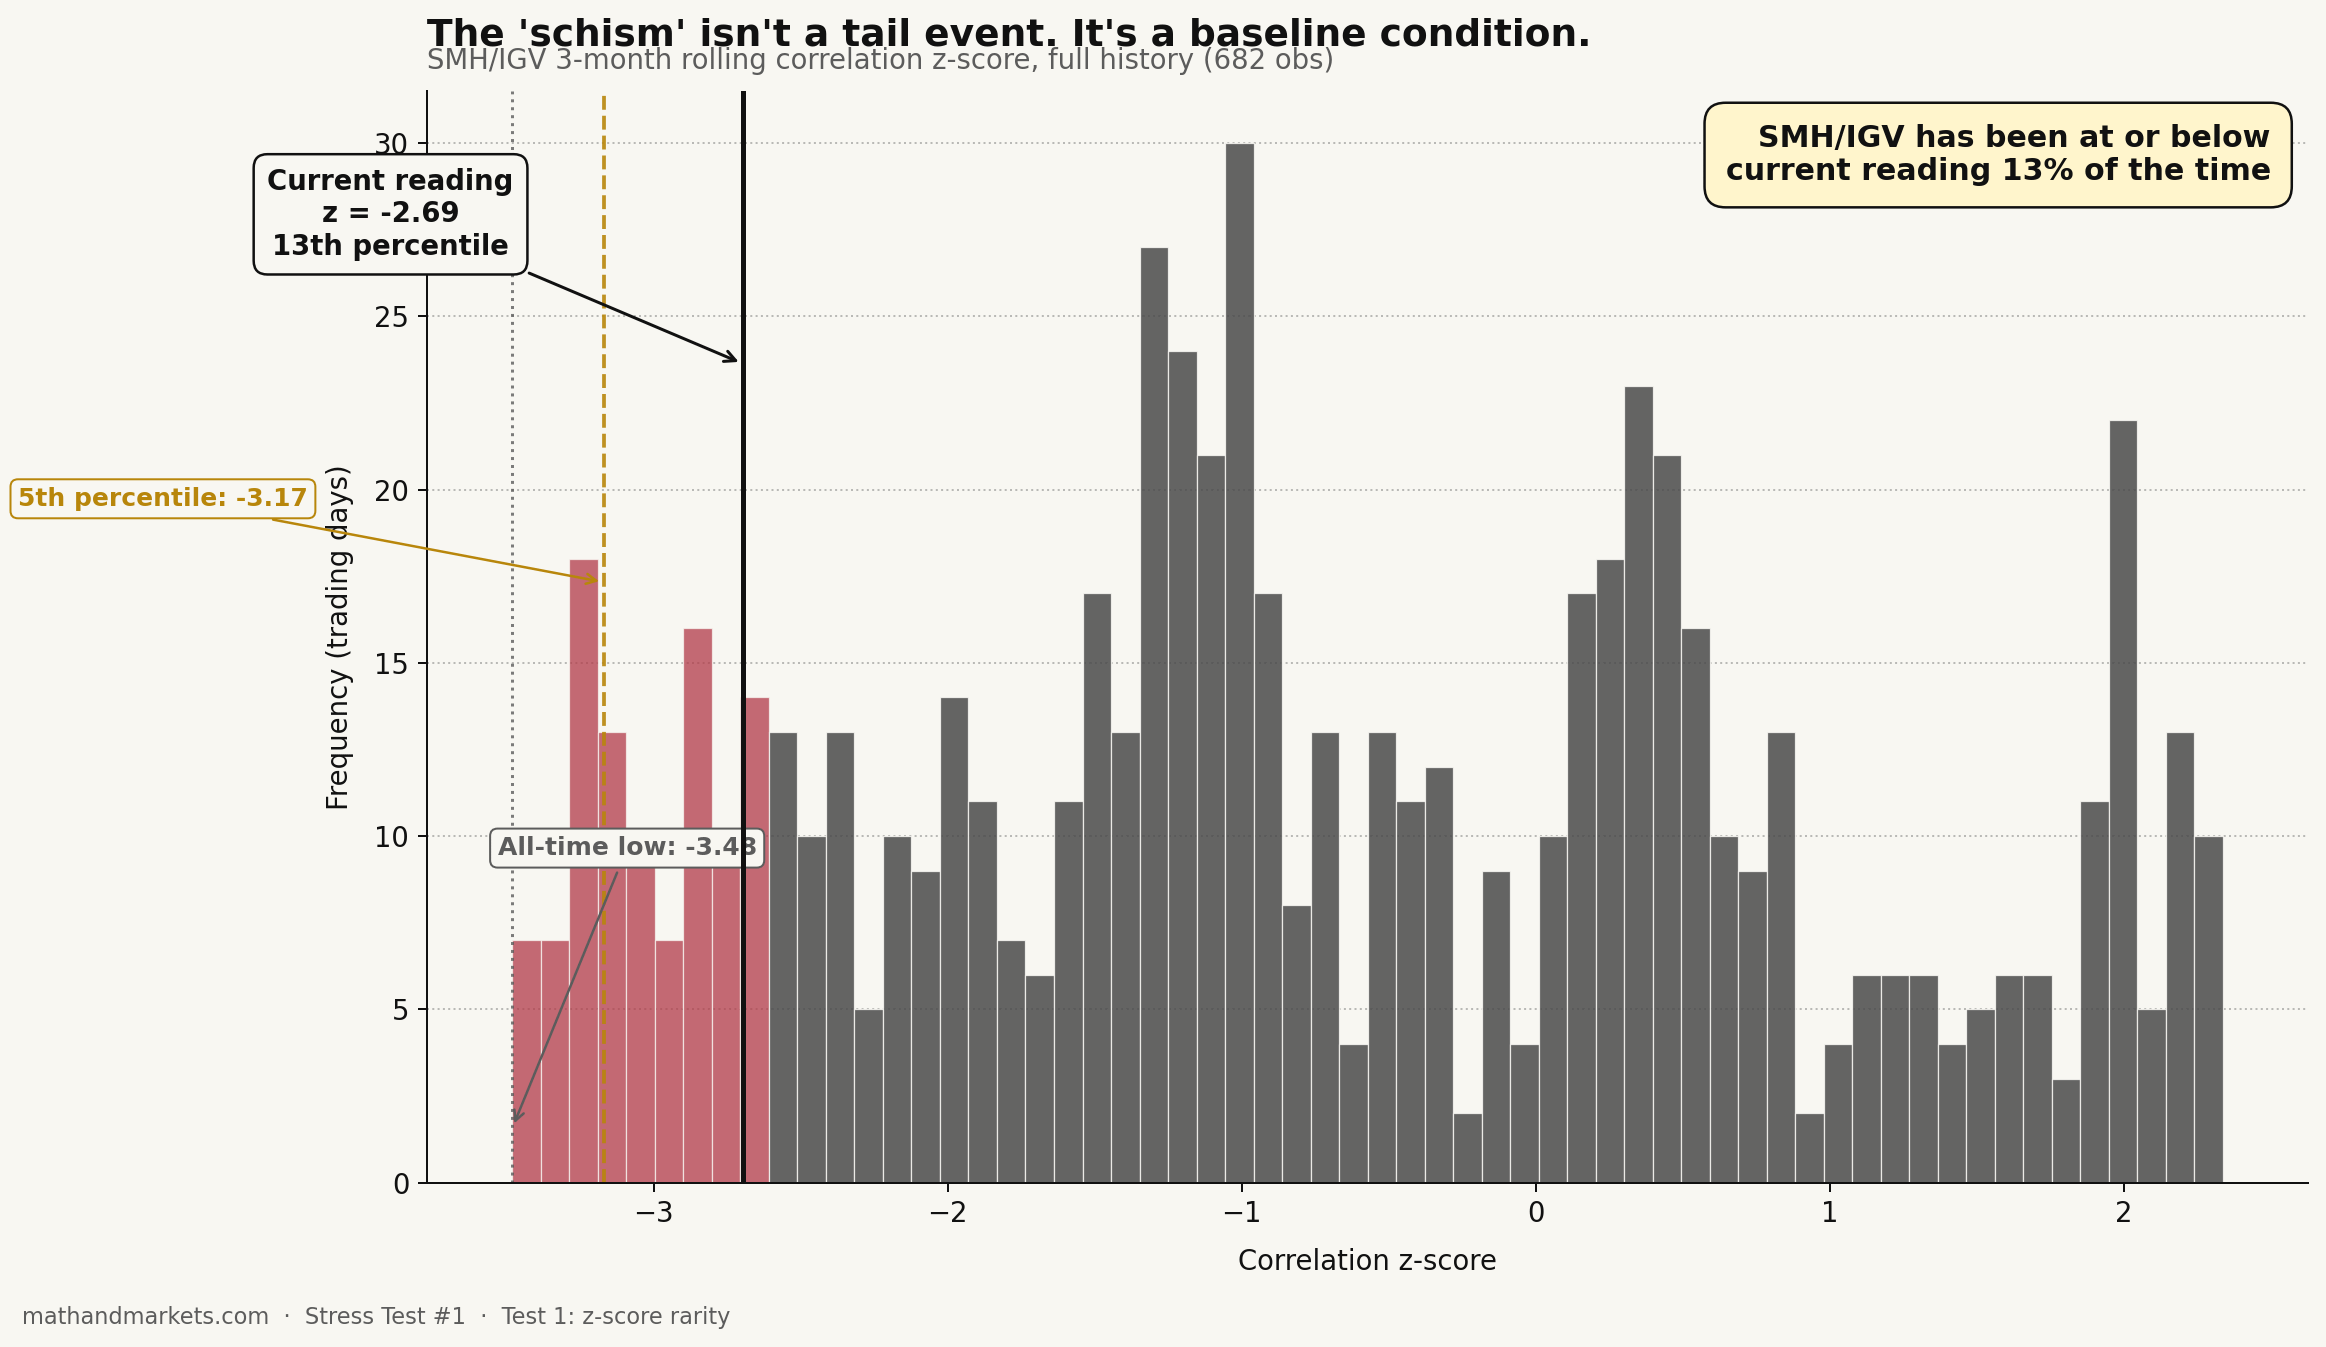
SMH/IGV has printed a 3-month correlation z-score at or below the current −2.69 reading on 13% of trading days across its observable history. The 5th percentile threshold — what would actually qualify as a rare event — sits at −3.17. The all-time low is −3.48. Today’s reading is closer to the pair’s baseline decoupling than to its tails.
Extending this to the other pairs makes the picture worse for the “rare event” story:
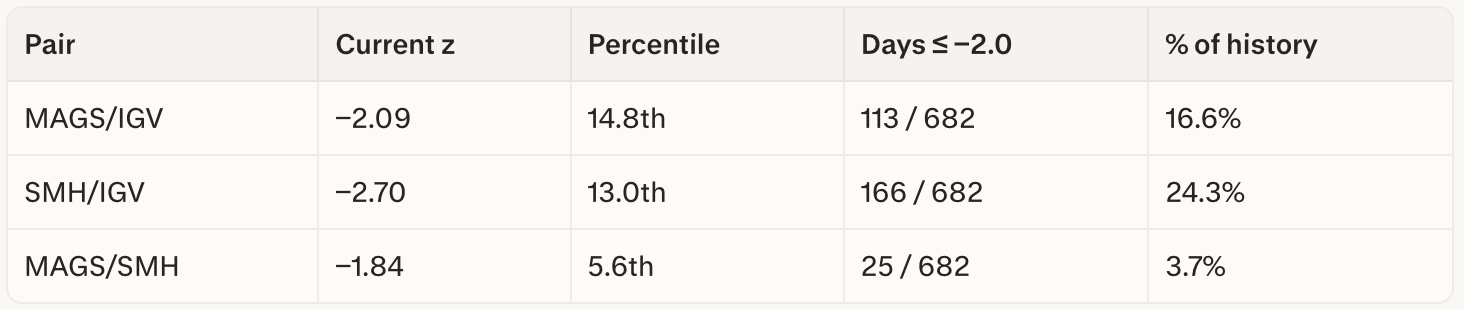
SMH/IGV has spent nearly a quarter of its history at or below a z of −2.0. This pair fractures like this all the time. Calling it a schism because it’s fracturing right now doesn’t make it a tail event.
That does not mean the phenomenon in Post 1 is not real. The 87-point YTD spread is real; the $58B/quarter capex step-up is real; the margin transfer is a live structural process. But the correlation collapse isn’t rare, so the correlation collapse cannot be the signal. The story has to survive on the mechanism, not the statistic.
Verdict on Test 1: the framing was wrong. The schism is a recurring feature of the pair, not a regime break.
Test 2: the trade signal is marginal at best
If a low z-score can’t be a rarity signal, maybe it’s still a timing signal. That’s the second question: at historical dates where SMH/IGV 3-month correlation z-score fell below −2.0, what did a vol-equalized long-SMH / short-IGV position return over the next 1, 3, and 6 months?
There have been 15 independent entries meeting that condition since April 2024 — enough to run the arithmetic, not enough to be confident in it.
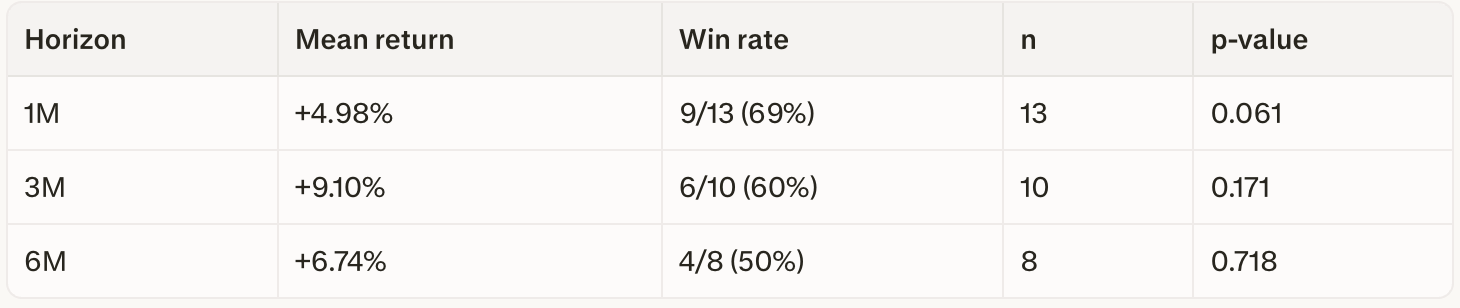
The aggregate looks decent at 1M. At 3M it degrades. At 6M it is indistinguishable from a coin flip — 50% win rate, p = 0.72.
But the aggregate is the wrong number to look at. The trades individually tell you something the mean doesn’t.
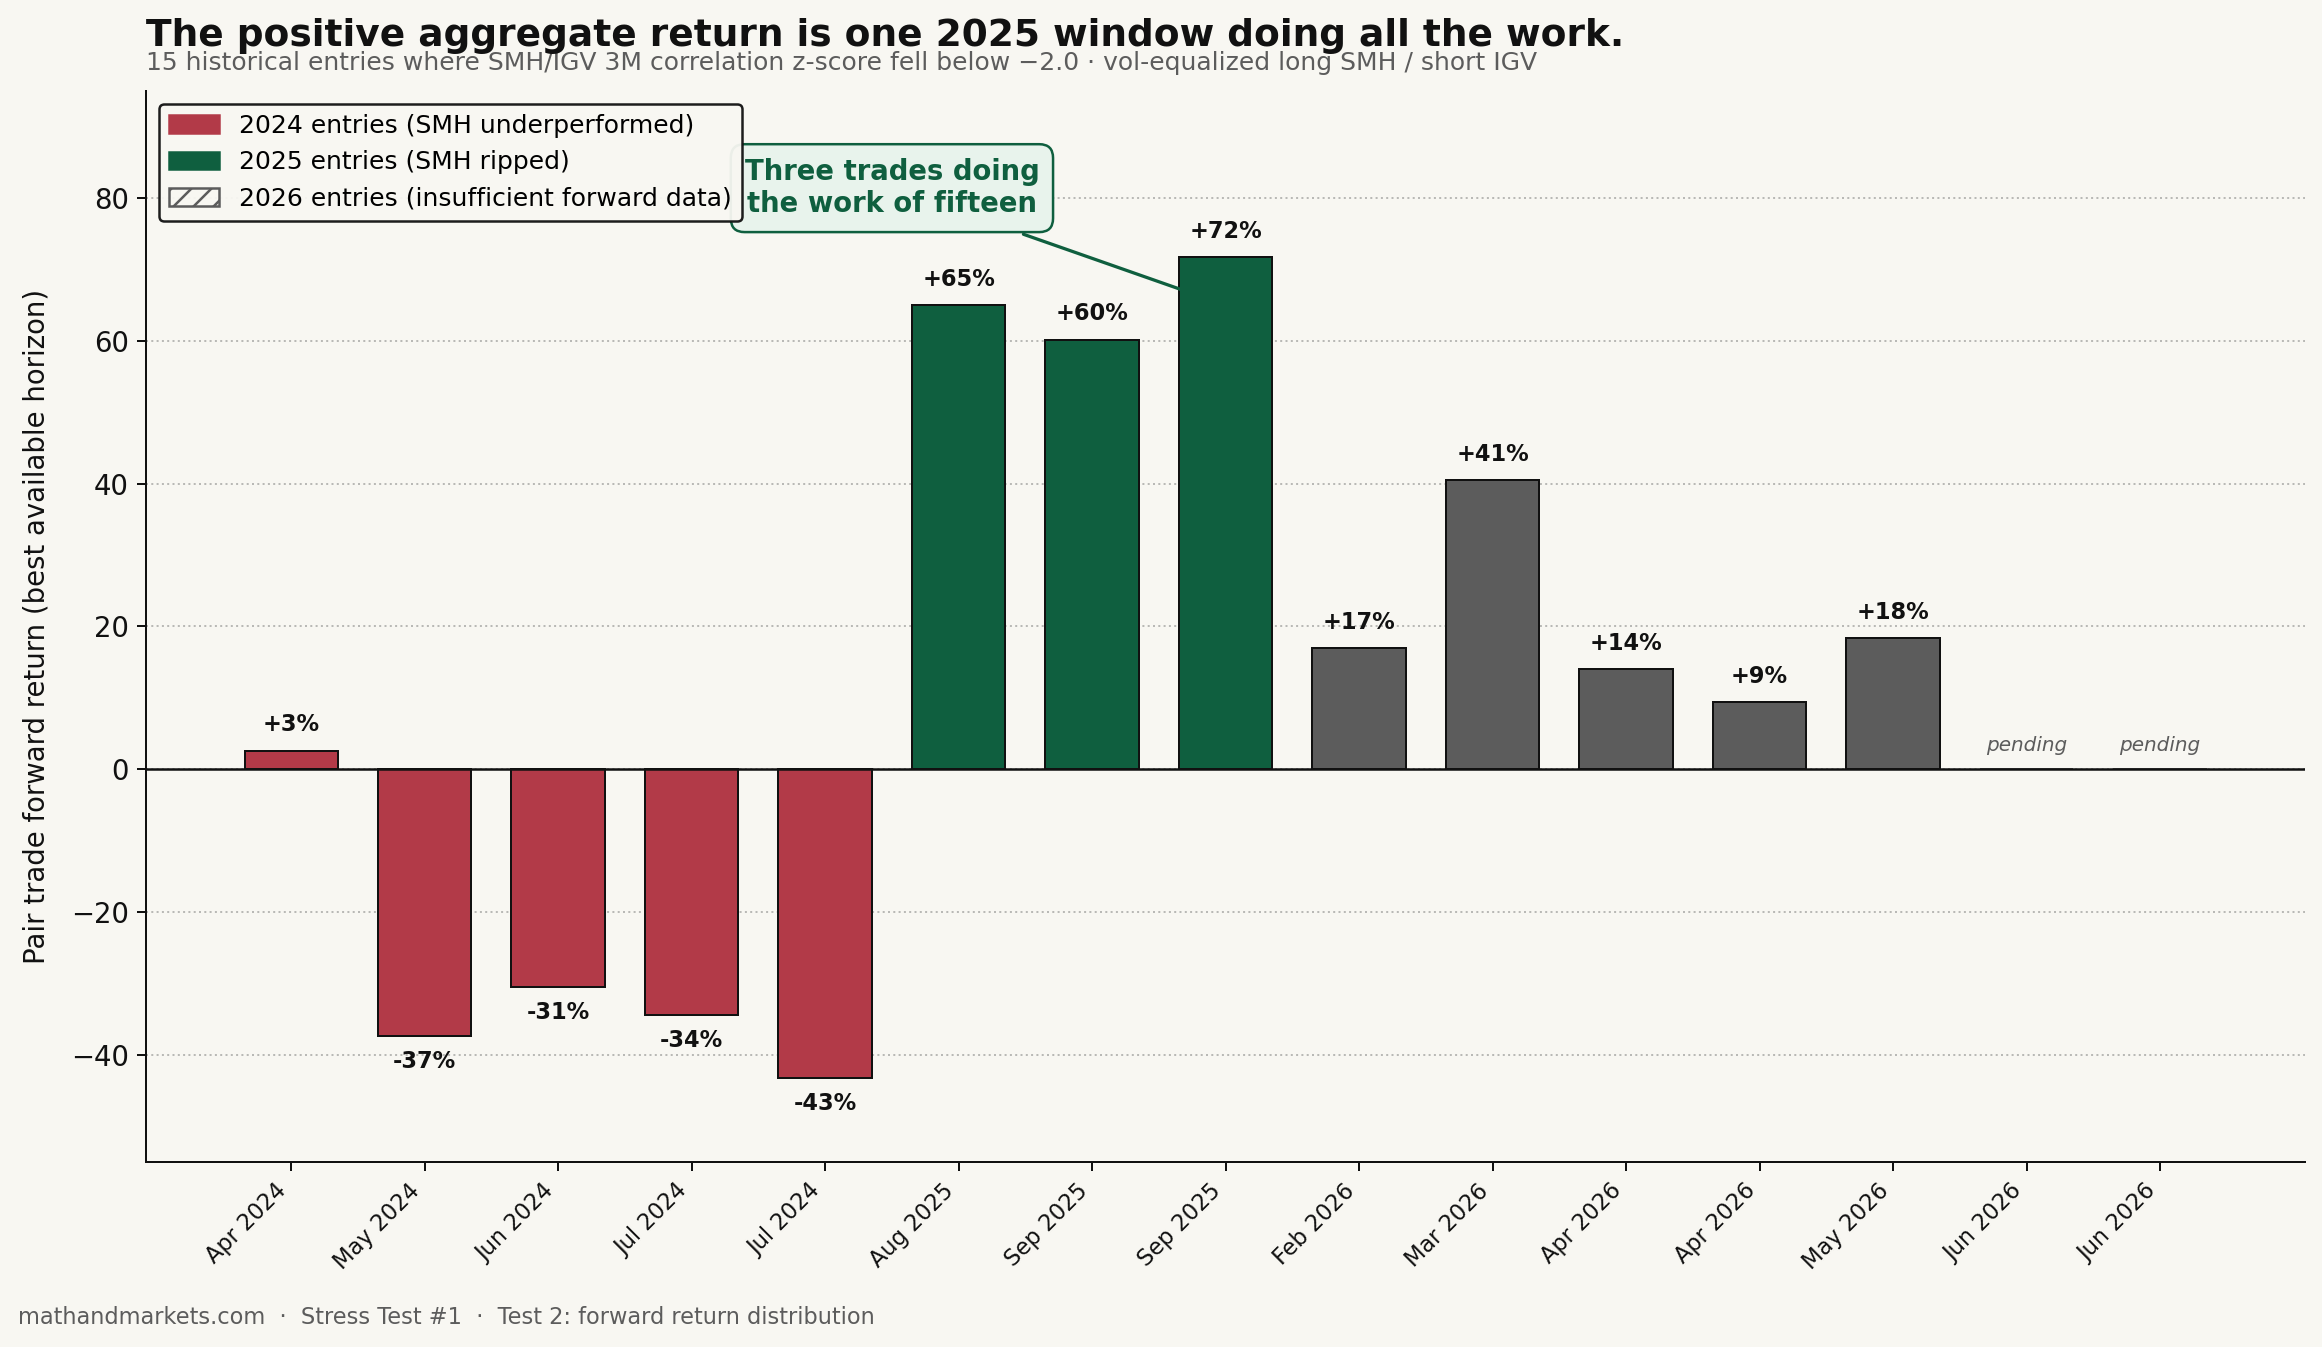
The 2024 cluster — five entries between April and July — was largely negative at 3M and 6M. The worst was a July 2024 entry that returned −43% at the 6M horizon during the summer NVDA correction.
The 2025 cluster is three entries: August 12, September 2, September 23. Those three trades produced +65%, +60%, and +72% at 6M. They captured the entire SMH rip that dominated Q3-Q4 2025.
Those three trades are the strategy. Take them out, and the aggregate 6M mean goes from +6.7% to something like −15%. The 2026 entries mostly don’t have 6M forward data yet.
This is not a signal. This is basically one regime doing all the work of an average. If you deaverage it, it goes away.
And the regime it captured — a specific SMH outperformance window driven by AI capex acceleration — is exactly what Post 1 argued we are still inside. So the honest read is: the historical backtest “worked” because it caught the trade we’re already trying to make, not because low correlation predicts anything about forward returns in general.
Verdict on Test 2: the systematic signal does not support the trade. It supports a regime, and the regime is the actualthesis.
Test 3: vol-equalized sizing isn’t stable
The last question was operational, not statistical. The sizing framework I was going to use in Post 3 was standard vol-equalization: scale each leg by its inverse 21-day realized vol so the two positions carry the same risk. SMH is currently 1.73× as volatile as IGV, so the IGV notional gets sized up correspondingly.
That works exactly one day.
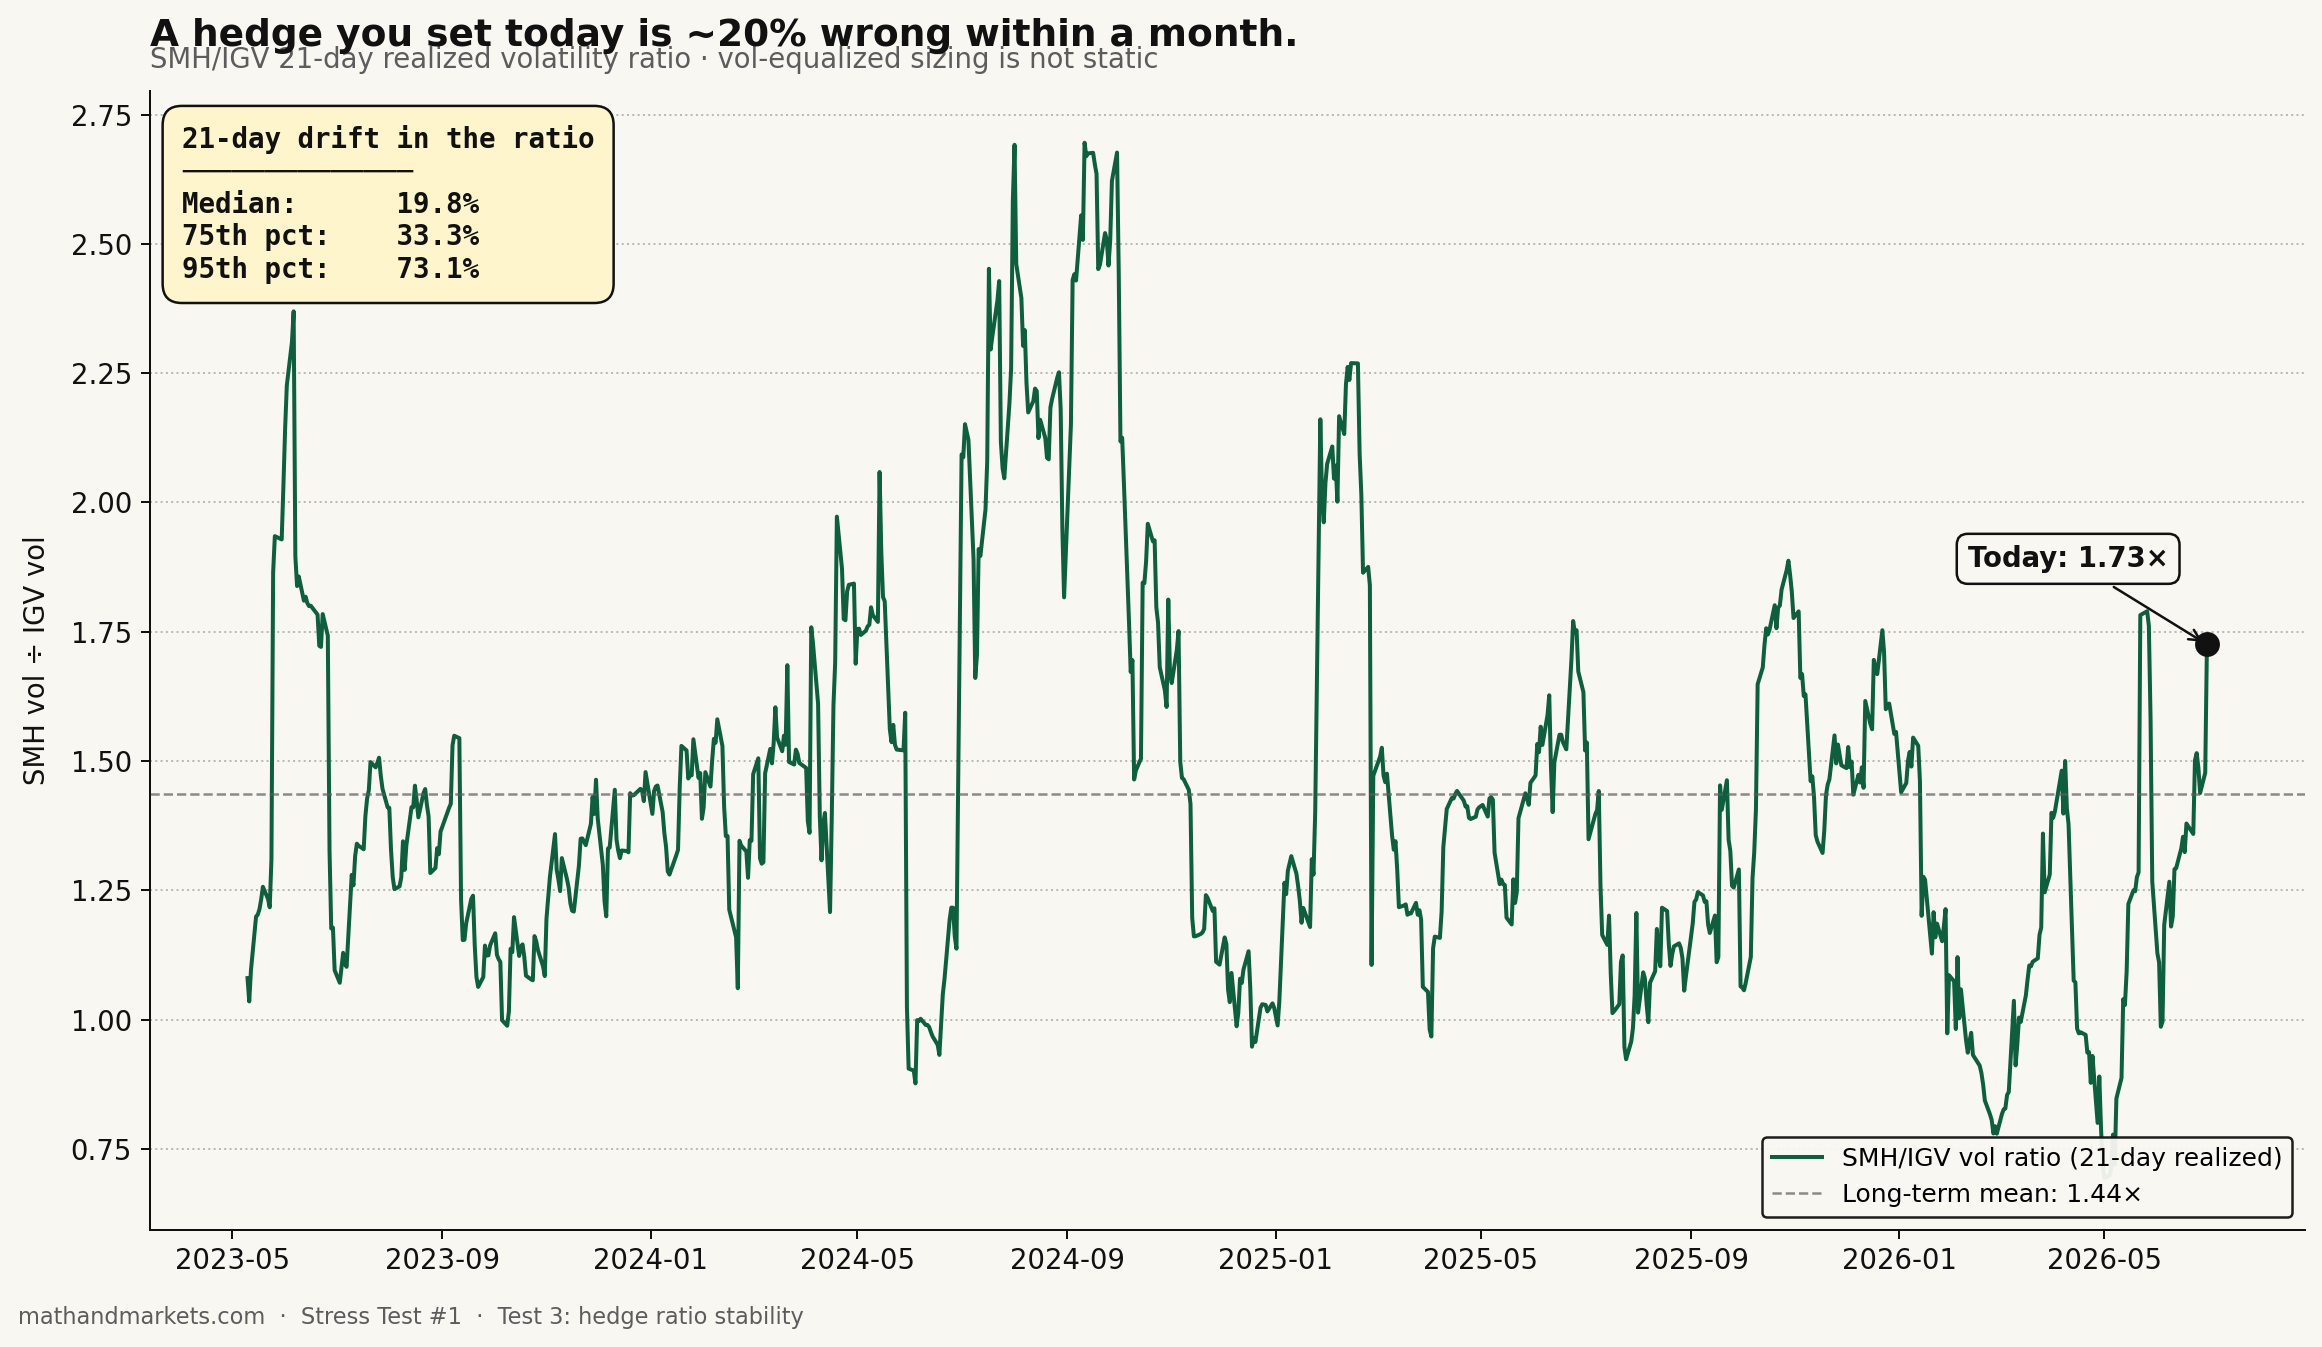
Over 21 trading days, the SMH/IGV vol ratio has moved by a median of 19.8% and a 75th-percentile move of 33.3%. In the 95th percentile — which is what happens during events like the July 2024 NVDA correction — the ratio moves 73% inside a month.
At a 20% median monthly drift in the vol ratio, “vol-equalized” is a starting condition, not a stable state. A hedge you set today is around a fifth off within a month, before any price move touches the position. Monthly rebalancing is a floor requirement. Weekly rebalancing is probably closer to correct. And rebalancing costs — commissions, spread, gamma bleed on any options overlay — weren’t anywhere in Post 3’s draft.
Verdict on Test 3: the sizing math needs active maintenance. That’s not fatal to the trade, but it’s material, and it wasn’t in the original writeup.
TL;DR
The three tests kill the ETF pair trade as a systematic strategy. But I don’t think it kills the underlying thesis.
The $58B/quarter hyperscaler capex delta is a real, measurable, contractually locked flow.
That capex is a P&L transfer from software operating margins to silicon operating margins. It has to be. Depreciation is an expense; software companies are the ones running it.
The market is repricing this slowly, name by name, quarter by quarter.
However, if you are looking to trade this, a few points worth considering.
The SMH/IGV correlation reading is not a rare event and cannot carry the argument by itself.
Framing the schism as “unprecedented” is unsupported by the correlation history. It’s a recurring feature.
The ETF-pair version of the trade is not a systematic edge. It’s a fundamental bet dressed in quant clothing.
The trade that survives the audit
If the correlation trade doesn’t work, what does? The version I had actually been sketching before I ran the tests: long NVDA, short MSFT, sized by capex intensity, held on a fundamental horizon.
Here’s the reason this survives when the ETF version doesn’t. The ETF pair trade requires two things to work: the schism has to be rare, and the schism has to mean-revert. Neither holds. The single-name capex trade requires something different: the capex transfer has to actually land on the P&Ls. That’s not a mean-reversion trade; it’s a fundamental one.
It doesn’t depend on whether SMH/IGV correlation is unusual — it depends on whether MSFT’s incremental $15-20B annual capex actually shows up as 150-200 bps of margin compression, and whether the corresponding $8-10B of MSFT-sourced NVDA revenue actually shows up as accelerated NVDA earnings.
The individual-name trade also fixes two of the three problems from the ETF version:
Execution. NVDA and MSFT both have sub-5-cent option spreads on liquid strikes. SMH and IGV have 20-30 cent spreads on ATM options. The illiquidity tax on the ETF pair eats the alpha before you can harvest it.
Directness. The single-name trade isolates exactly the P&L flow you’re trying to bet on. The ETF pair contaminates the signal with everything else in the basket — semis unrelated to hyperscaler capex, software unrelated to margin transfer, index-flow effects that have nothing to do with the mechanism.
The vol-drift problem doesn’t go away. Any pair trade requires active hedge management. But the fundamental horizon of the single-name trade — earnings cycles, not monthly correlation windows — is a better match to how the mechanism actually plays out.
Post 2 next Saturday, July 11, delivers the piece I originally promised in Post 1: Software Is Dead. Long Live Silicon. A closer look at the margin transfer itself — when the depreciation actually hits, which software names get crushed first, and why the coal-to-natural-gas analogy is more literal than you think. Fundamental mechanics, not trade construction.
Post 3 the Saturday after — July 18 — is the trade writeup. Long NVDA, short MSFT, sized by capex intensity rather than realized vol, with the exact position math, the four ways the trade breaks, and the specific stop and exit conditions. It’s a fundamental thesis expressed as a pair, not a correlation edge with a fundamental story tacked on.
Thanks to Doc McGraw for pushing on the ETF-pair trade and forcing this audit. If you want the raw data — z-score history, trade log, vol ratio series — reply to this note and I'll send it.
As always, the material presented in Math & Markets is for informational purposes only. It does not constitute investment or financial advice.
Alpha is never guaranteed and the backtest is a liar until proven otherwise.