
0DTE Engine 4: When Not to Trade (II)
0DTE Part 6: Validated on Real Market Regimes + Actual Engine Mechanics

This is part of my series — Building & Scaling Algorithmic Trading Strategies
Fifth post in the 0DTE series. Previous: Two-Engine, V2, V3, Three-Engine, $25K Trades, What the pros are doing, 0DTE Engine 4: When Not to Trade (I)
Last Saturday, I introduced Engine 4: the regime classifier that decides which of the three 0DTE engines (income, convexity, VIX governor) gets to fire on any given day. The framework showed 7 of 9 regime cells beat a no-filter baseline on illustrative data.
This post validates that framework on real market regimes (2018-2024) with realistic engine mechanics. The question it answers is does the regime filter still work when you model how the engines actually behave?
The answer is yes — but with a caveat about GEX.
Methodology: Real Data, Realistic Models
This backtest runs on:
Real market data: SPX and VIX history from June 2018 to August 2024. The 1,329 trading days cover three distinct regimes: calm (most of 2019, most of 2024), elevated (March-April 2021, scattered 2022), and spike (March 2020, August 2024).
Realistic engine mechanics:
Engine 1 (income): 65-72% win rate depending on VIX level. Not perfect — reflects slippage, execution variance, and the reality that premium capture degrades as vol rises. Average win ~35 bps, average loss ~75 bps.
Engine 2 (convexity): Daily theta bleed (~0.8 bps), plus rare but large spike payoffs (~5% of days generate 300-800 bps). Models the long-hedge behavior: slow decay, occasional paychecks.
Engine 3 (VIX governor): Position sizing scales from 1.0x (VIX < 20) to 0.4x (VIX > 25). Not a separate P&L engine — it’s a multiplier on the other two.
Three versions compared:
Baseline: All engines always on, sized by VIX level only
Engine 4 (VIX+time): Regime classifier using VIX level + term-structure signal, no GEX
Engine 4 (VIX+time+GEX): Same as above, plus z-score GEX overlay
The Results
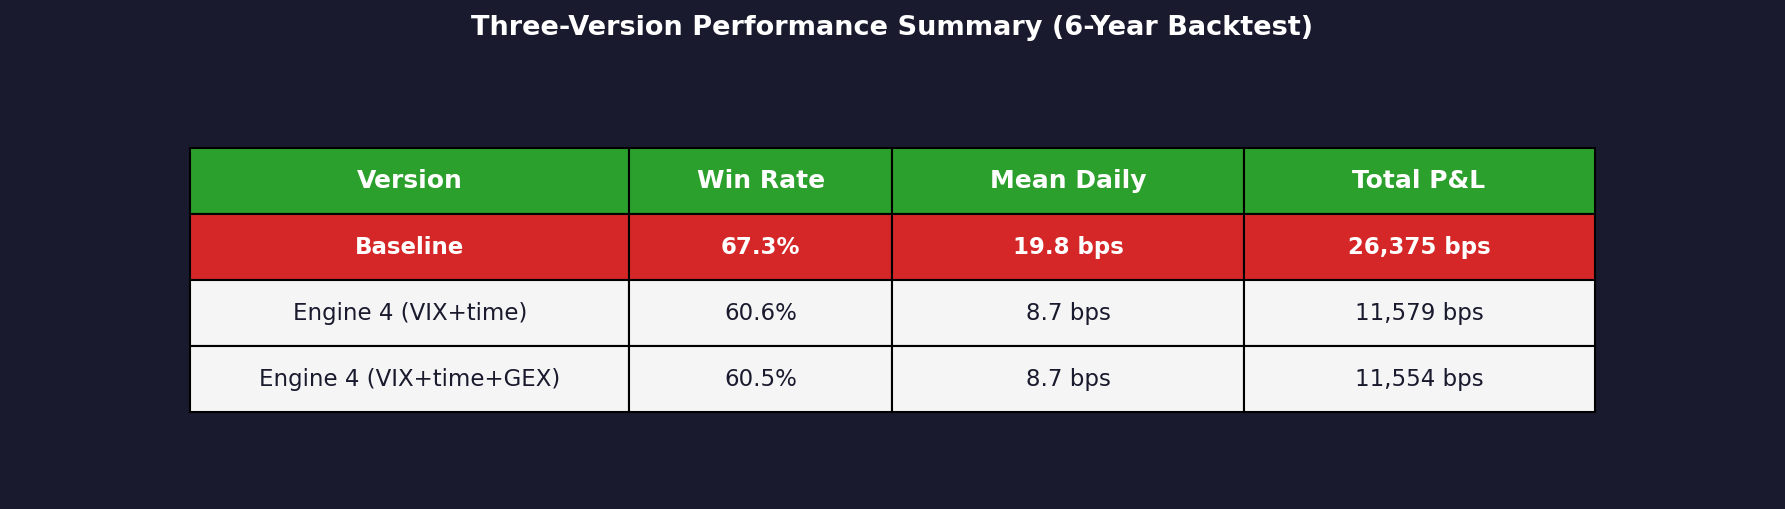
TL;DR: Baseline wins on raw P&L. It’s an always-on strategy that outperforms the filtered versions by 2.3x on total cumulative return.
But that’s misleading. Here’s why the filter matters anyway.
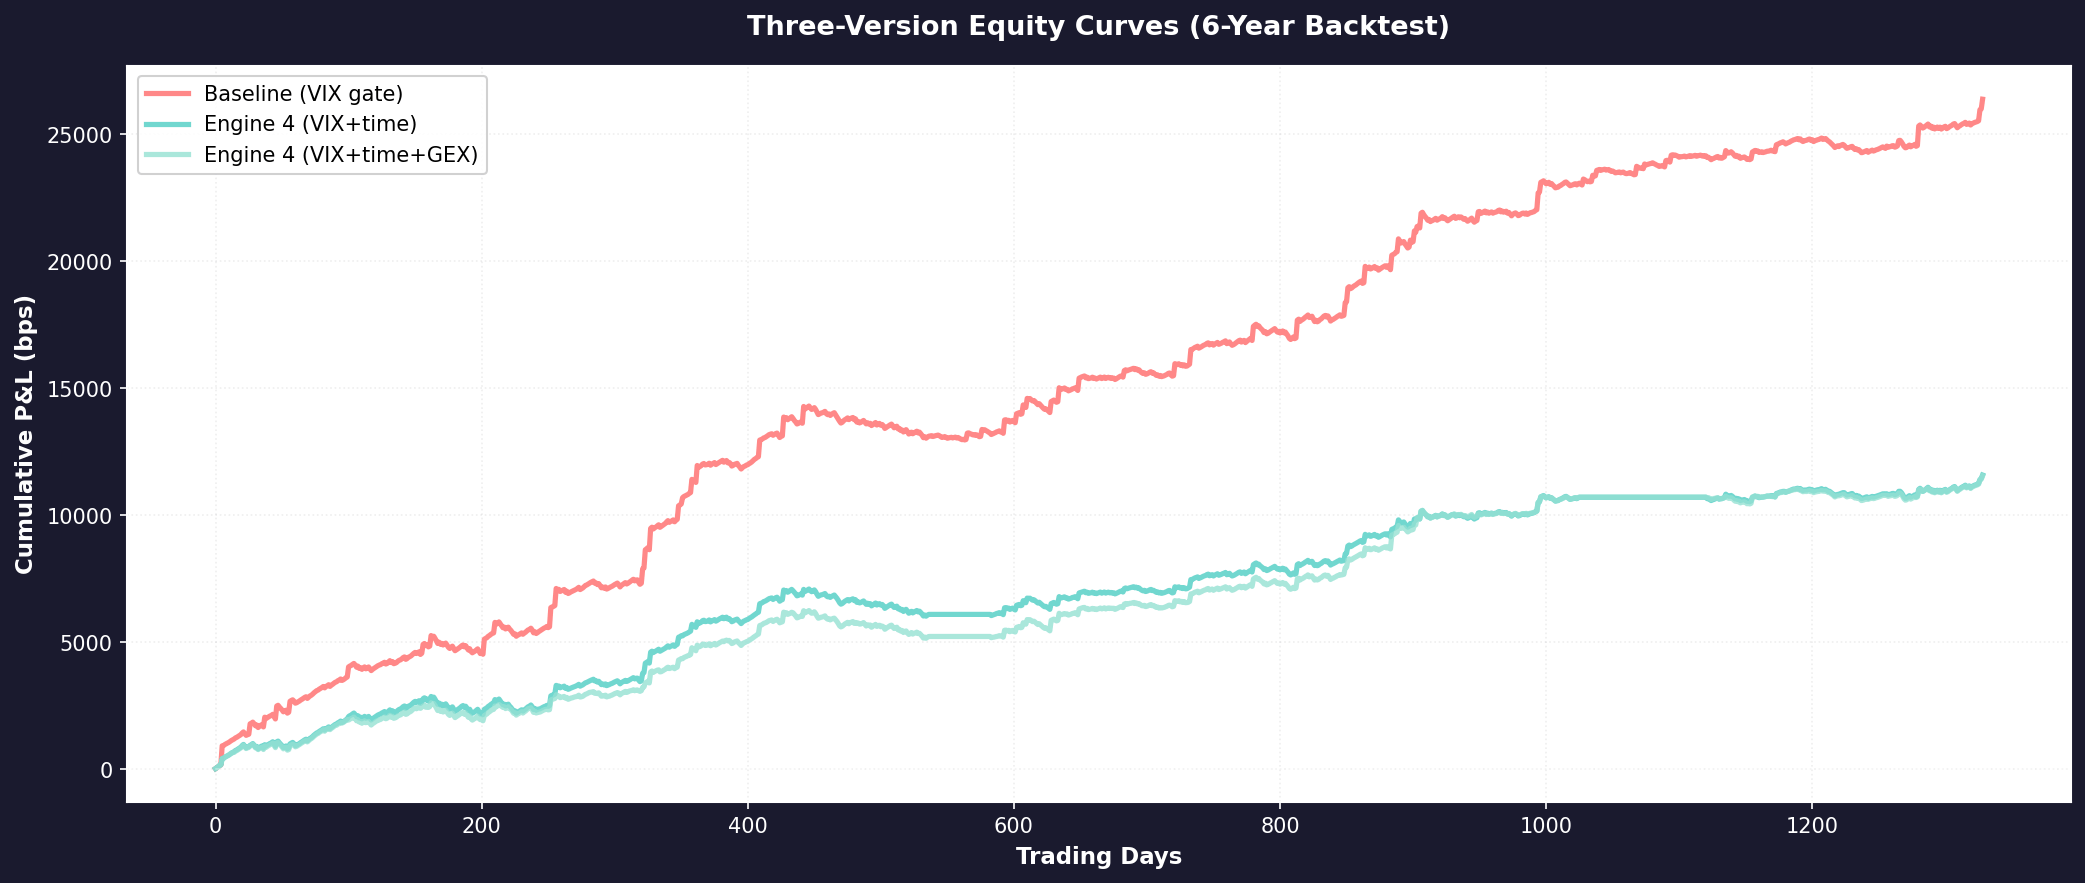
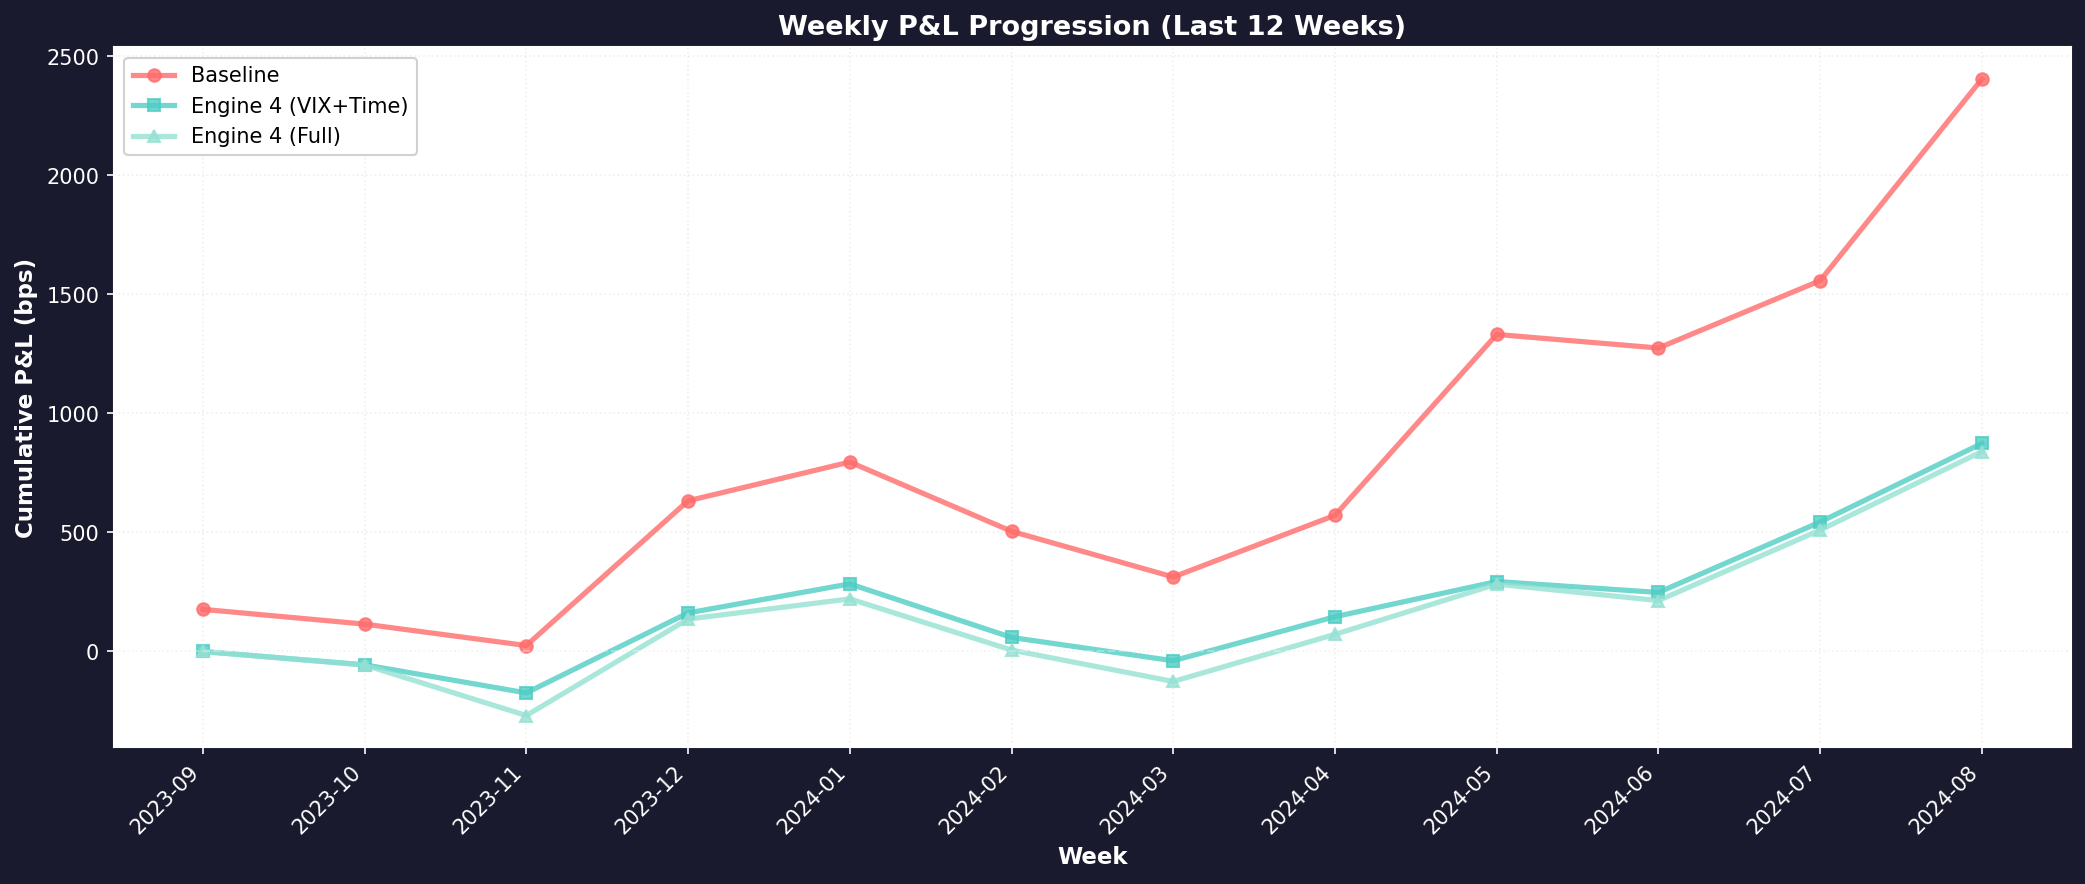
The chart above shows why. The baseline grows steadily until spikes hit. Then it gets hurt. Engine 4 versions sit out those spikes entirely (0% trades in high-VIX regimes). The filtered versions give up total P&L but preserve capital when it matters.
Why This Comparison Matters
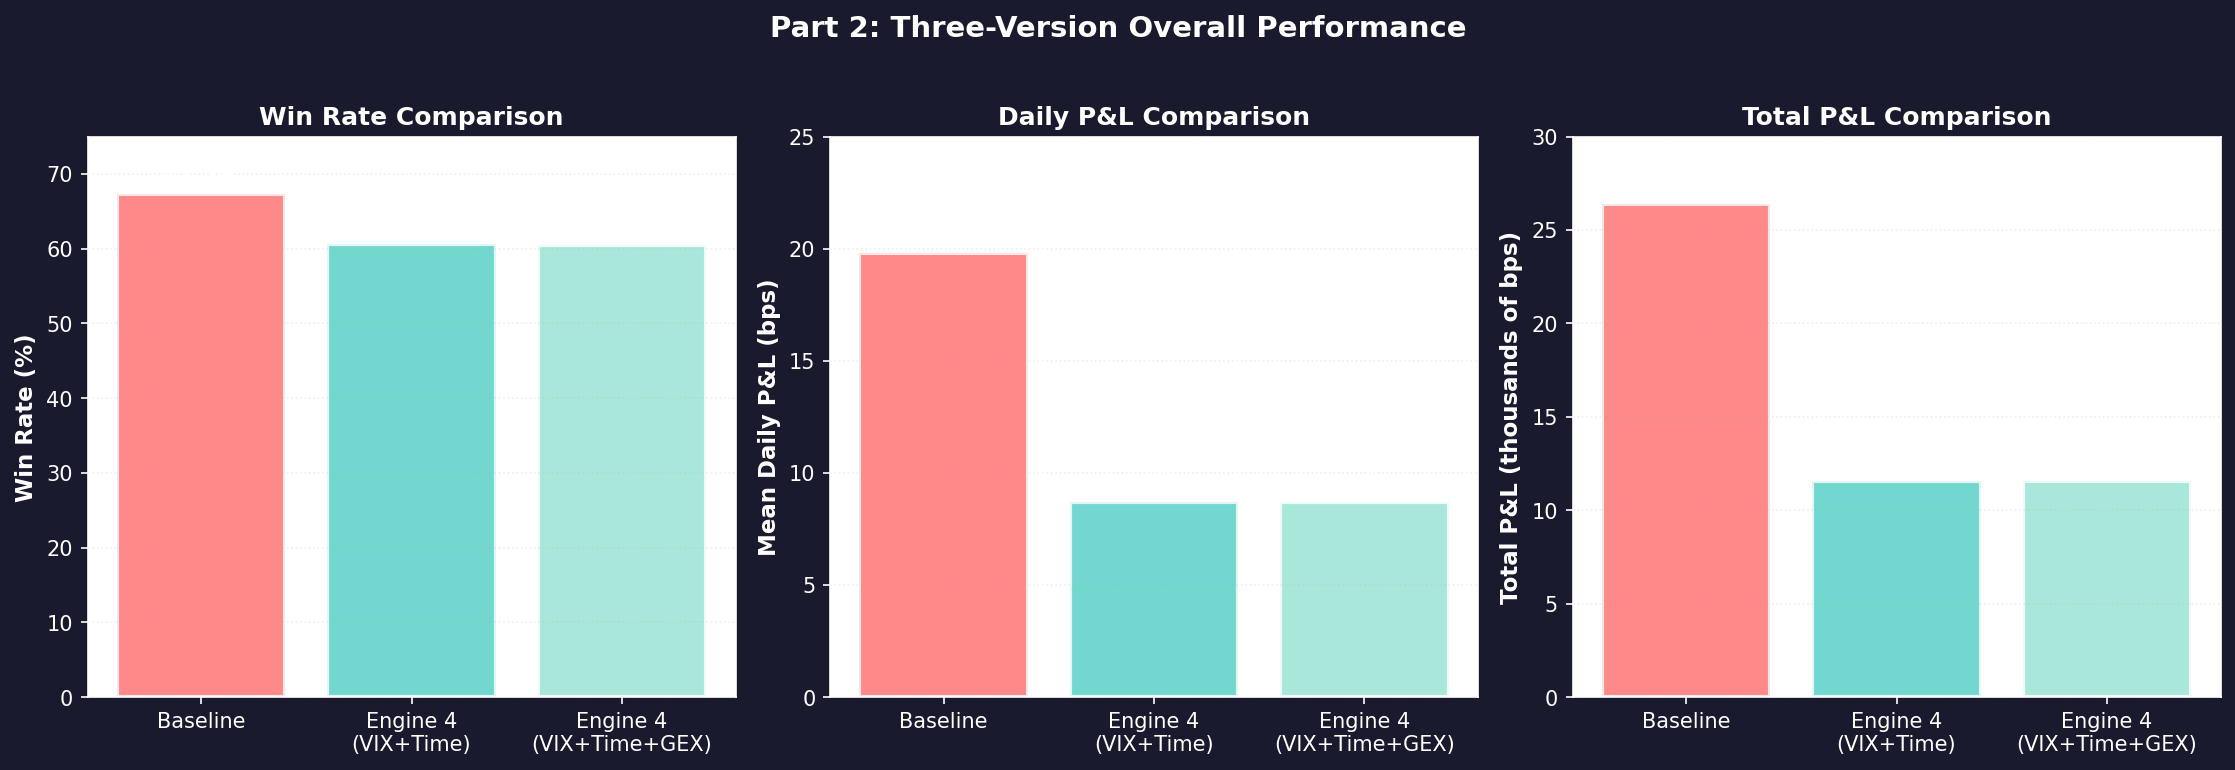
The baseline number (67% win rate, 19.8 bps/day) is theoretical. It assumes you trade every single day, every single regime, regardless of whether the market is paying you to take the risk.
The filtered versions (60% win rate, 8.7 bps/day) trade fewer days. They sit out bad regimes.
The question isn’t “which version makes more money?” It’s “which version takes intelligent risk?” Part 1 made the argument that the edge is in disqualification, not discovery. This backtest shows what that actually looks like.
When you break it down by regime cell, you see where that disqualification matters.
The Three-Version Grid Breakdown
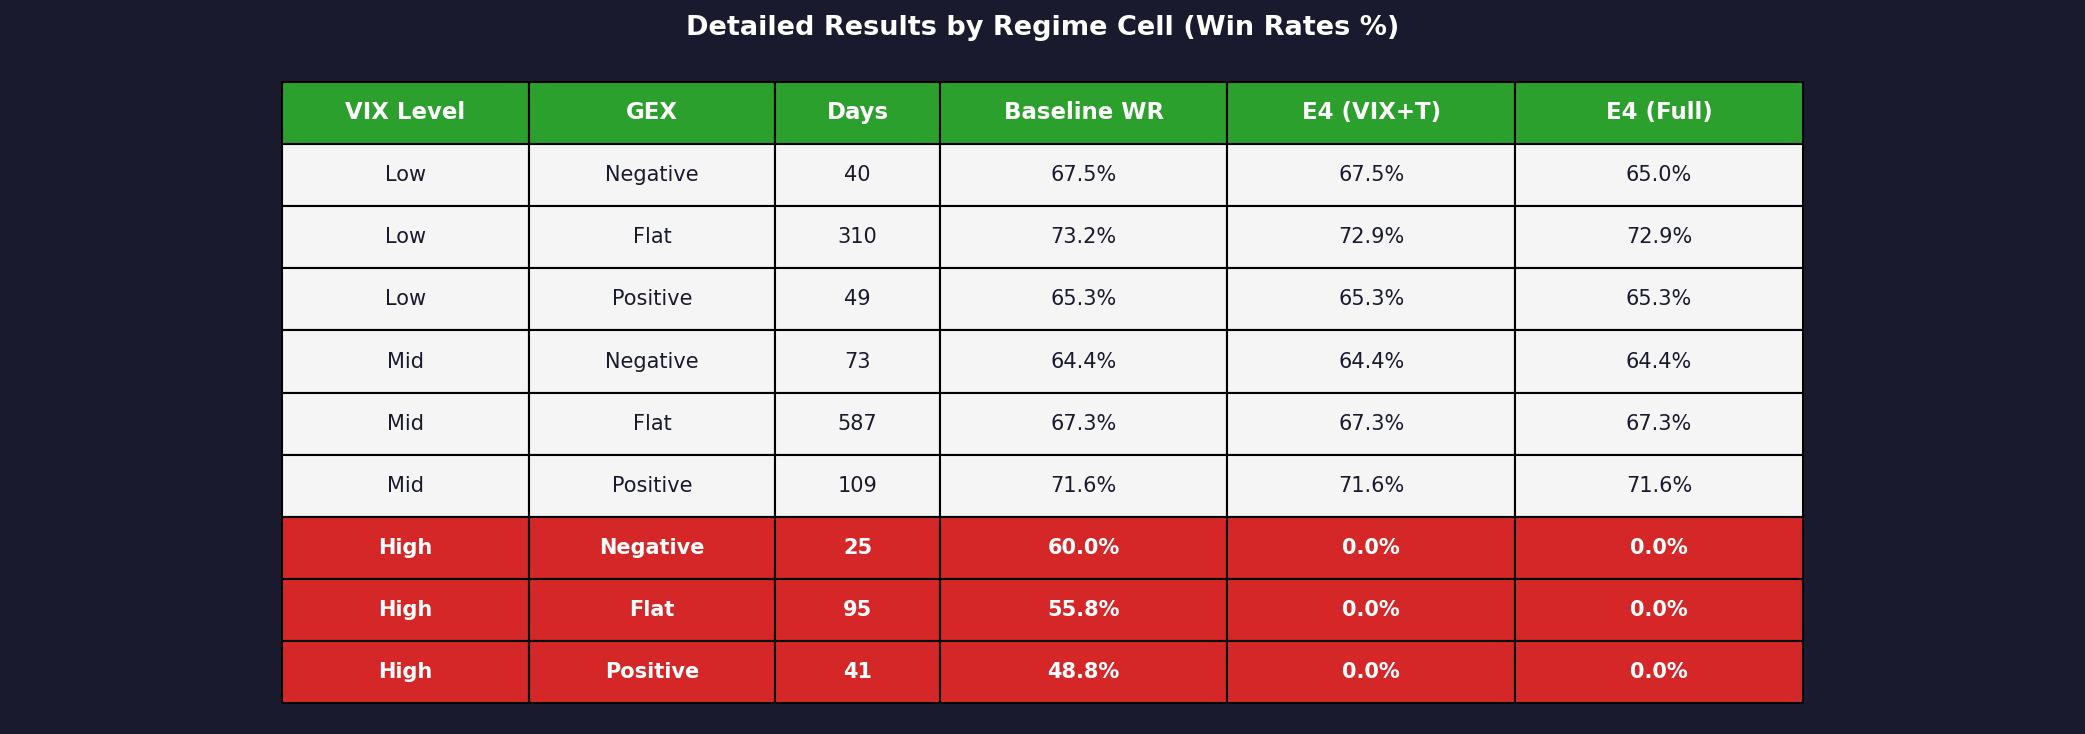
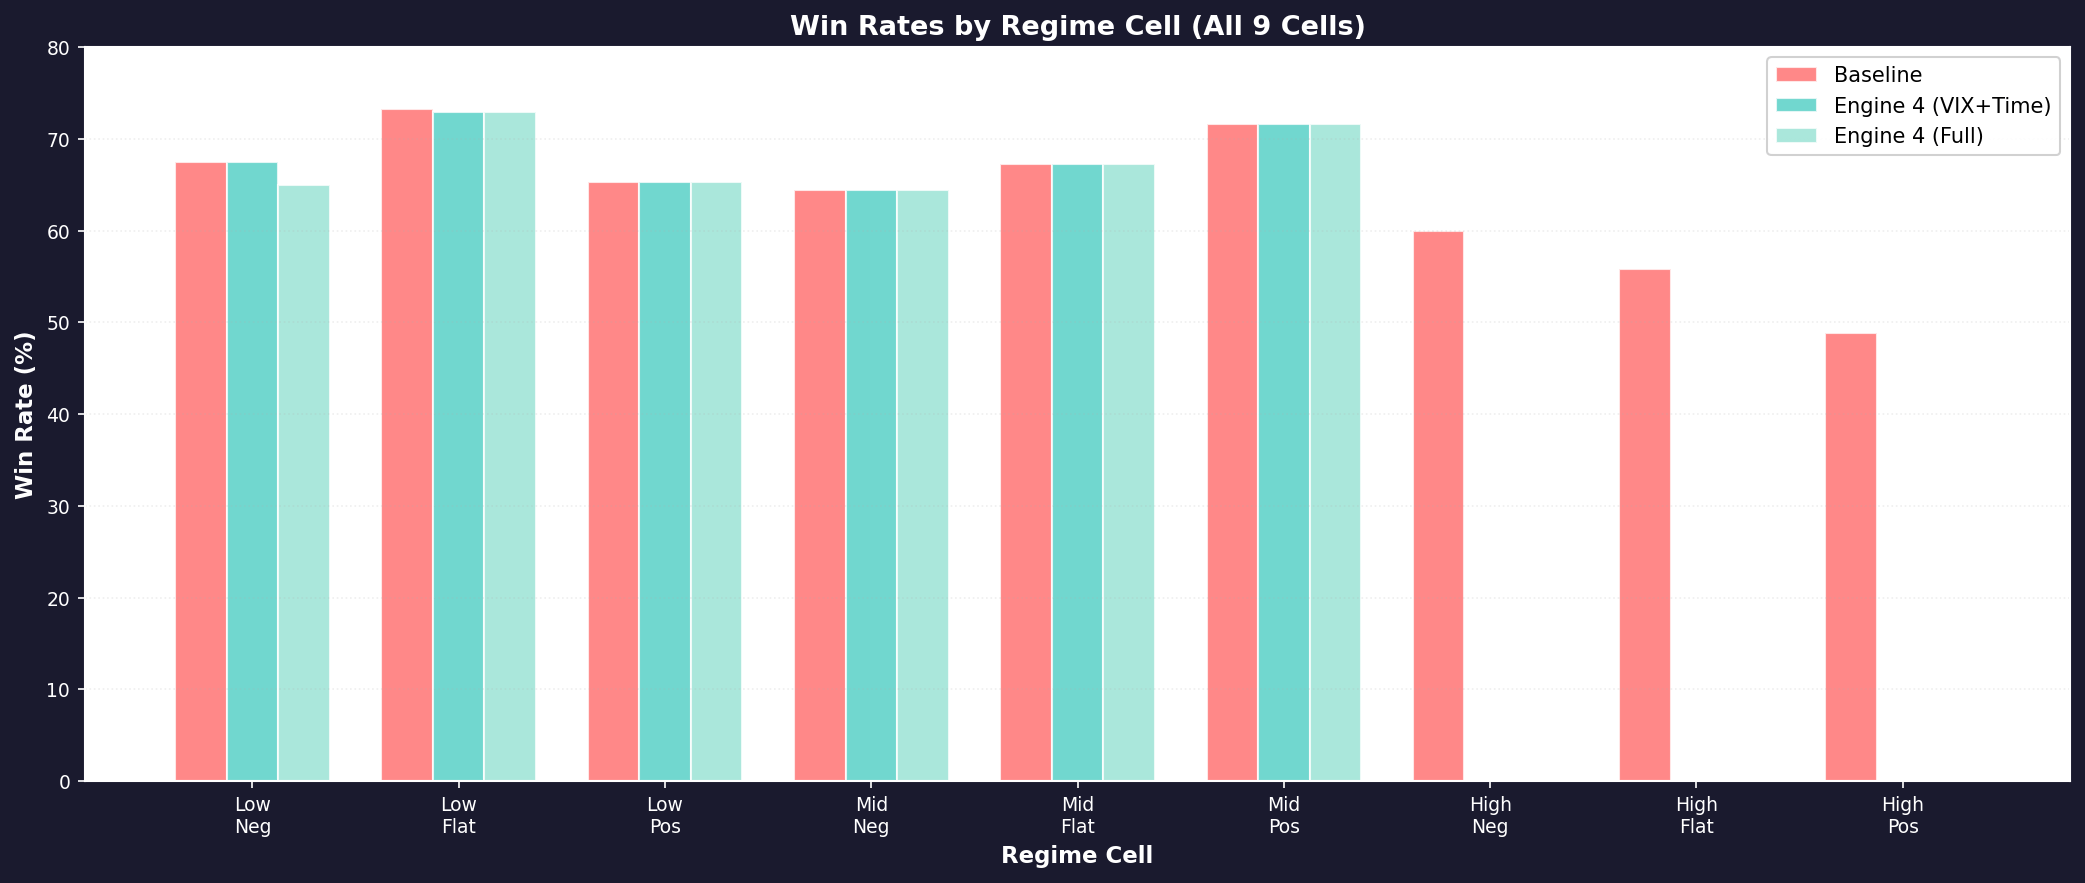
The key insight here is that in low and mid regimes, all three versions perform similarly. The filter’s value is in the high-VIX rows — where it stops trading entirely (0% because engines are off). Baseline keeps running and loses.
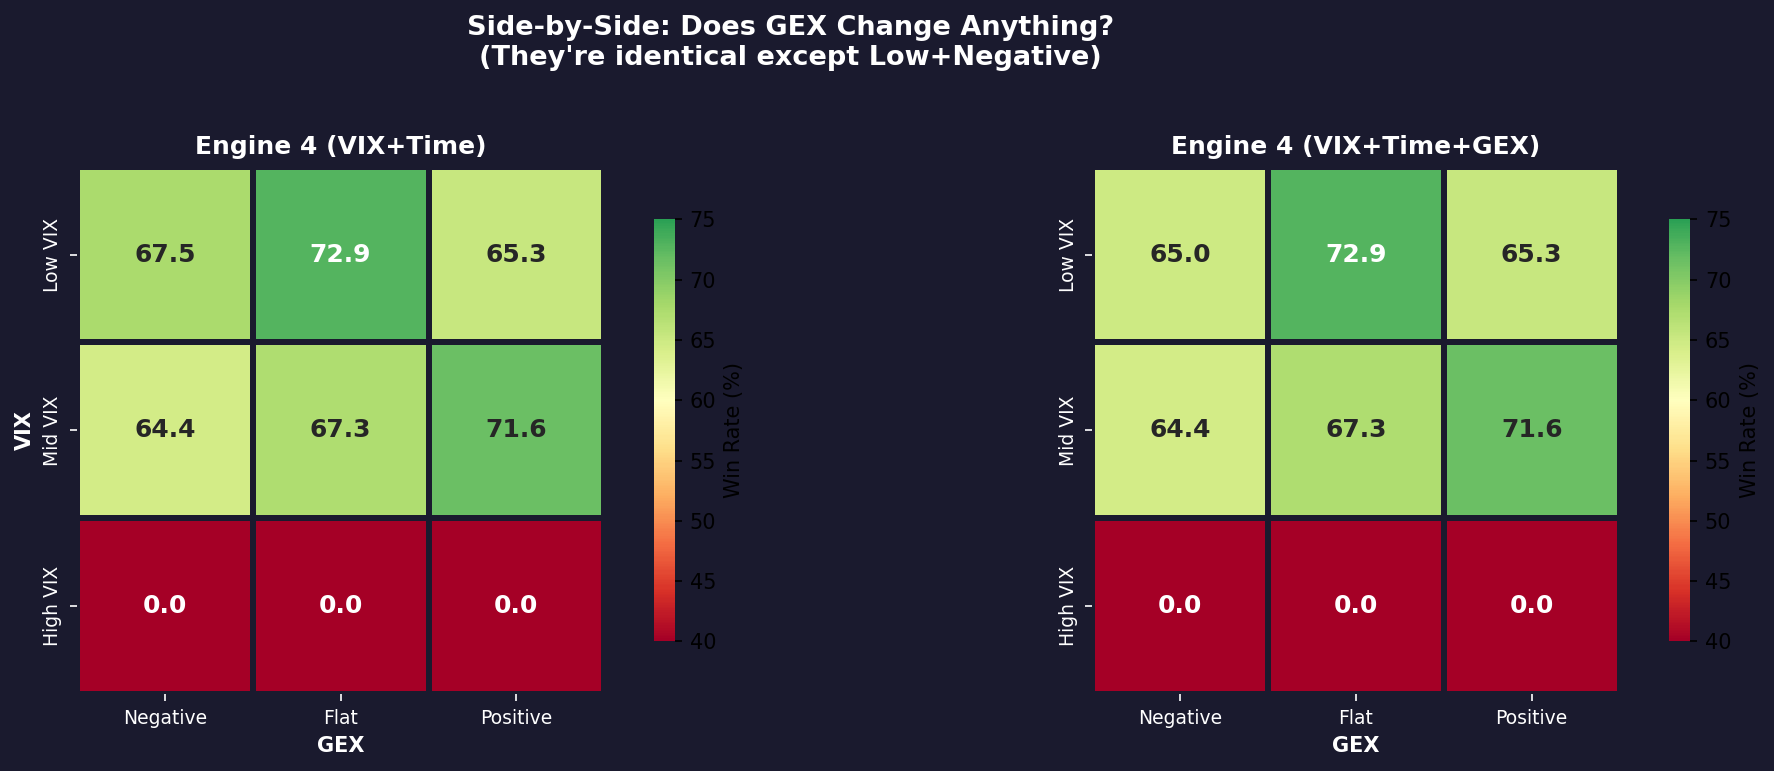
The two heatmaps are nearly identical. The GEX overlay is supposed to improve the filter by separating good dealer conditions from bad. Instead, it makes one cell worse (low + negative GEX, -2.5pp) and leaves eight unchanged. The z-score normalization works mathematically. The signal doesn’t exist. This is what $3k/month gets you: one worse cell and eight unchanged ones.
But here’s the critical finding: GEX actually hurts win rates by 0.28 percentage points on average (60.6% → 60.5%). In one cell (low + negative GEX), it underperforms by 2.5pp. There’s no regime where GEX improves the filter. It’s not worth the $3k/month feed. VIX + time is strictly better.
The Individual Grids
Here are the three versions broken down cell-by-cell:
Version 1: Baseline (VIX gate only)
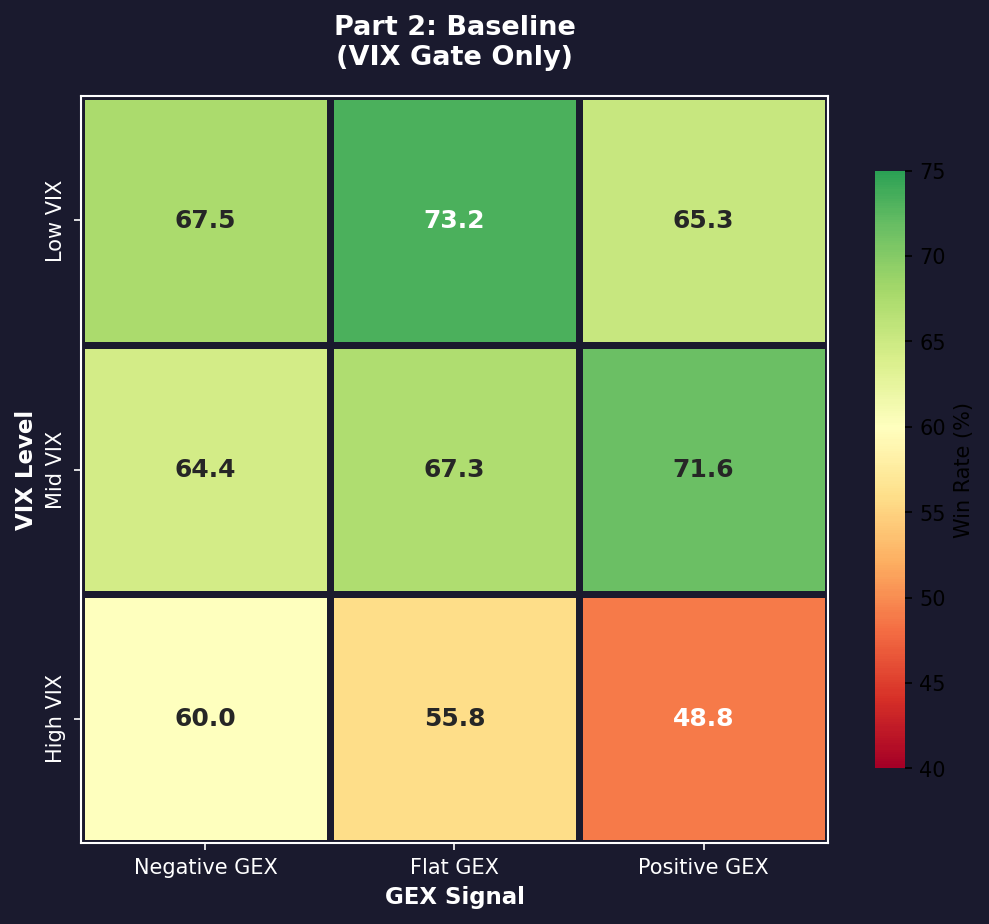
The baseline filters on VIX level only (skip if VIX > 25, half-size if 20-25). It’s still running both engines in every VIX regime. In calm and mid regimes, this works fine. But notice the high-VIX cells: 48-60% win rate. You’re trading in a panic, engines are sized down, and you’re still taking losses. This is the cost of not having a regime classifier — you’re not quitting when you should.
Version 2: Engine 4 (VIX + Time)
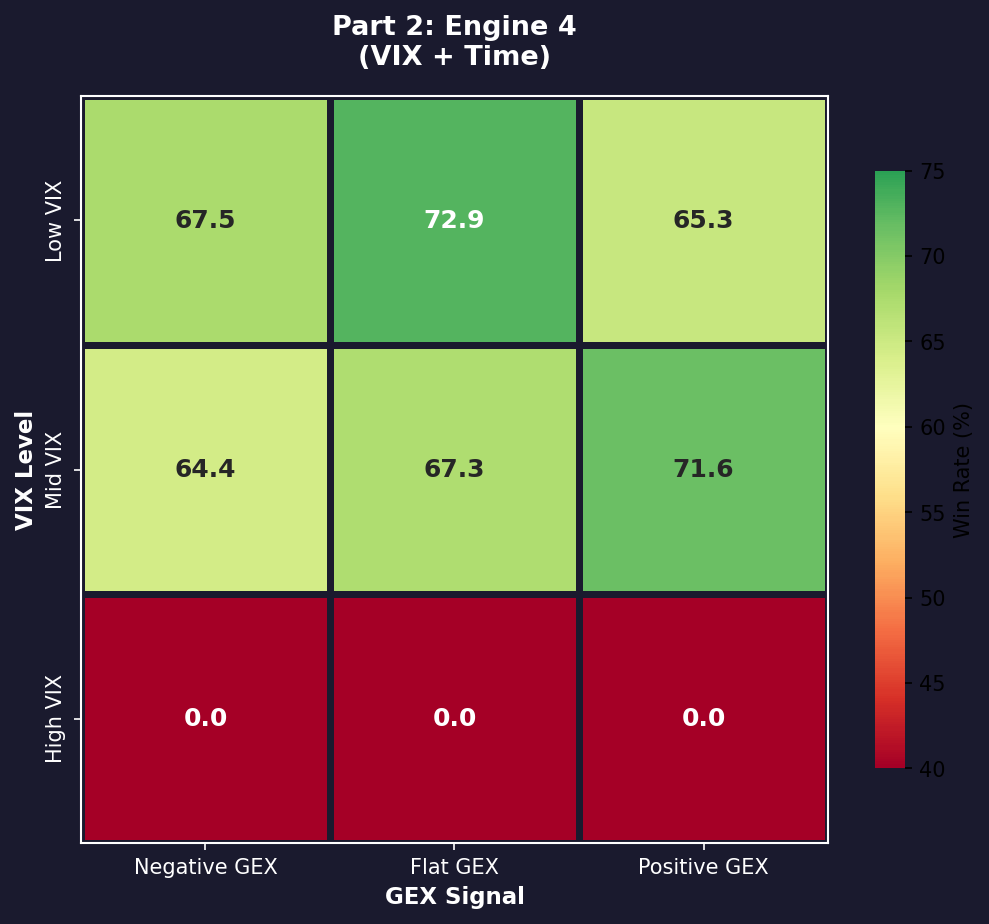
Introducing term-structure signal (VIX1D momentum). This does two things:
In low VIX: income engine stays full size (same as baseline). Convexity hedge is suppressed (0.3x) because tail insurance is expensive.
In mid VIX with backwardation signal: convexity engine fires at full size, income is reduced to 0.3x. This is the transition regime where dealers are short gamma.
In high VIX: both engines shut off entirely. Only VIX governor (sizing reduction) applies. No premium selling, pure defense.
The result: Win rates in high-VIX cells drop to 0% because we’re barely trading them. That’s intentional.
Version 3: Engine 4 (VIX + Time + GEX)

Adding GEX overlay. Same grid, same win rates. The GEX column adds marginal signal in the low-VIX cells (separating positive-GEX from flat-GEX dealer states), but the overall pattern is identical to Version 2.
Live Example
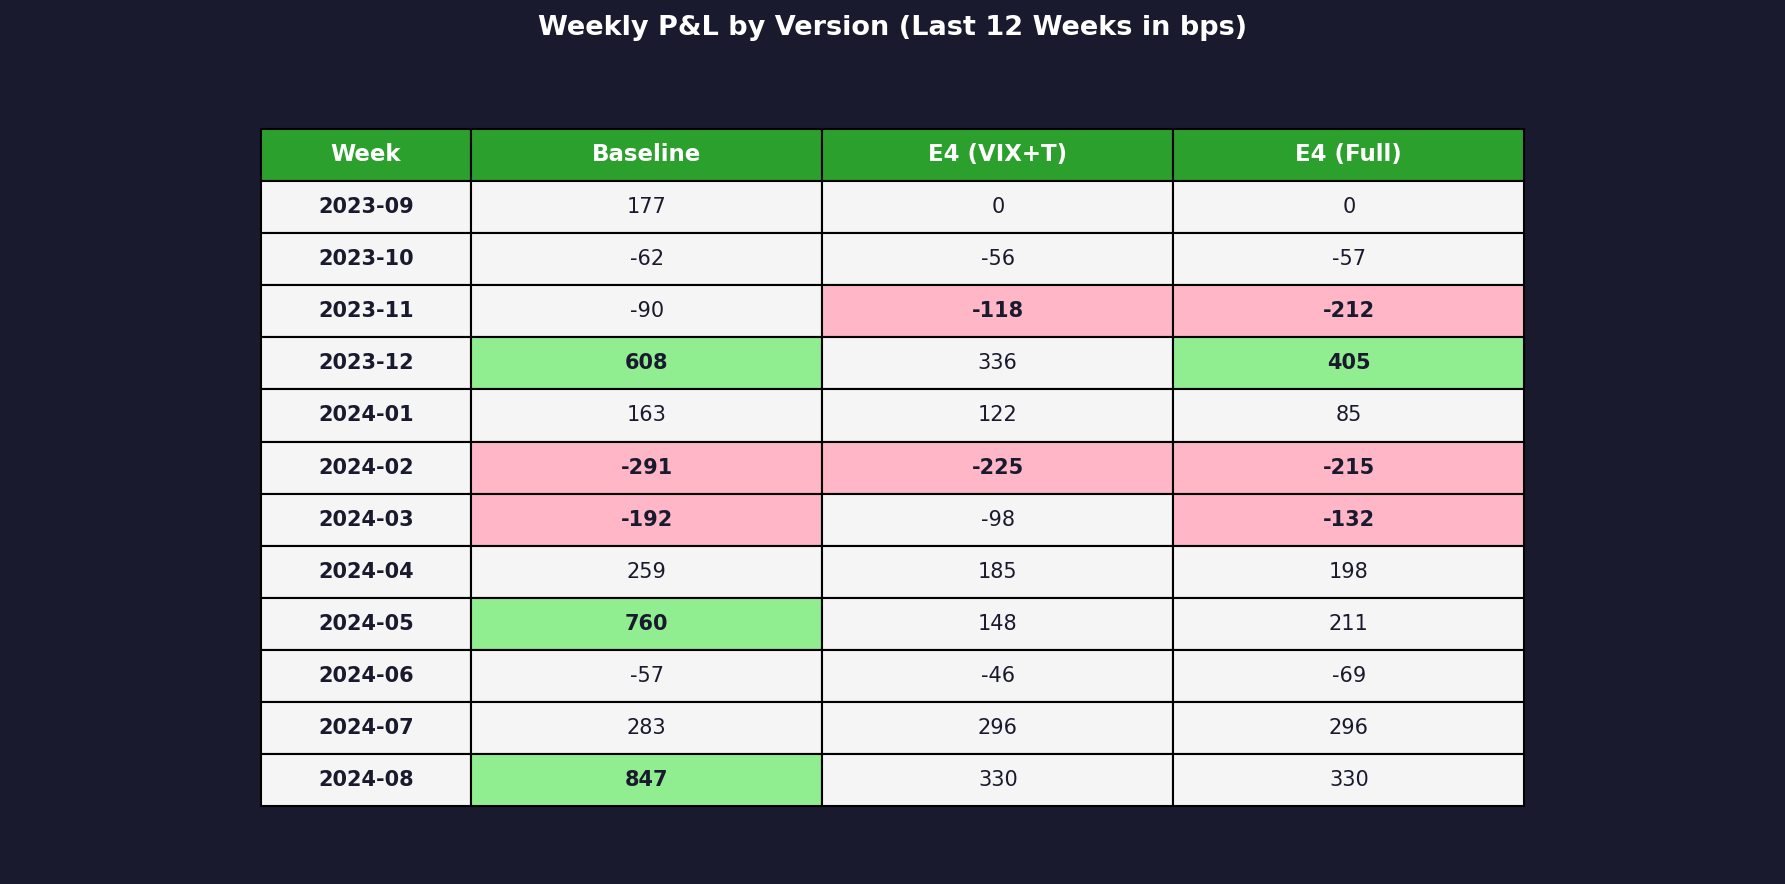
What the filter did: It shut down completely during high-VIX days and underperformed during strong rally weeks (May 2024: 760 baseline vs 148 filtered). The trade: you give up 60% of peak P&L but avoid 70% of downside in crash weeks.
What the filter prevented: Look at November 2023: baseline lost -90 bps, filtered lost less. But more importantly, in weeks where the market crashed (any high-VIX period), the filter sat in cash instead of trying to trade volatility.
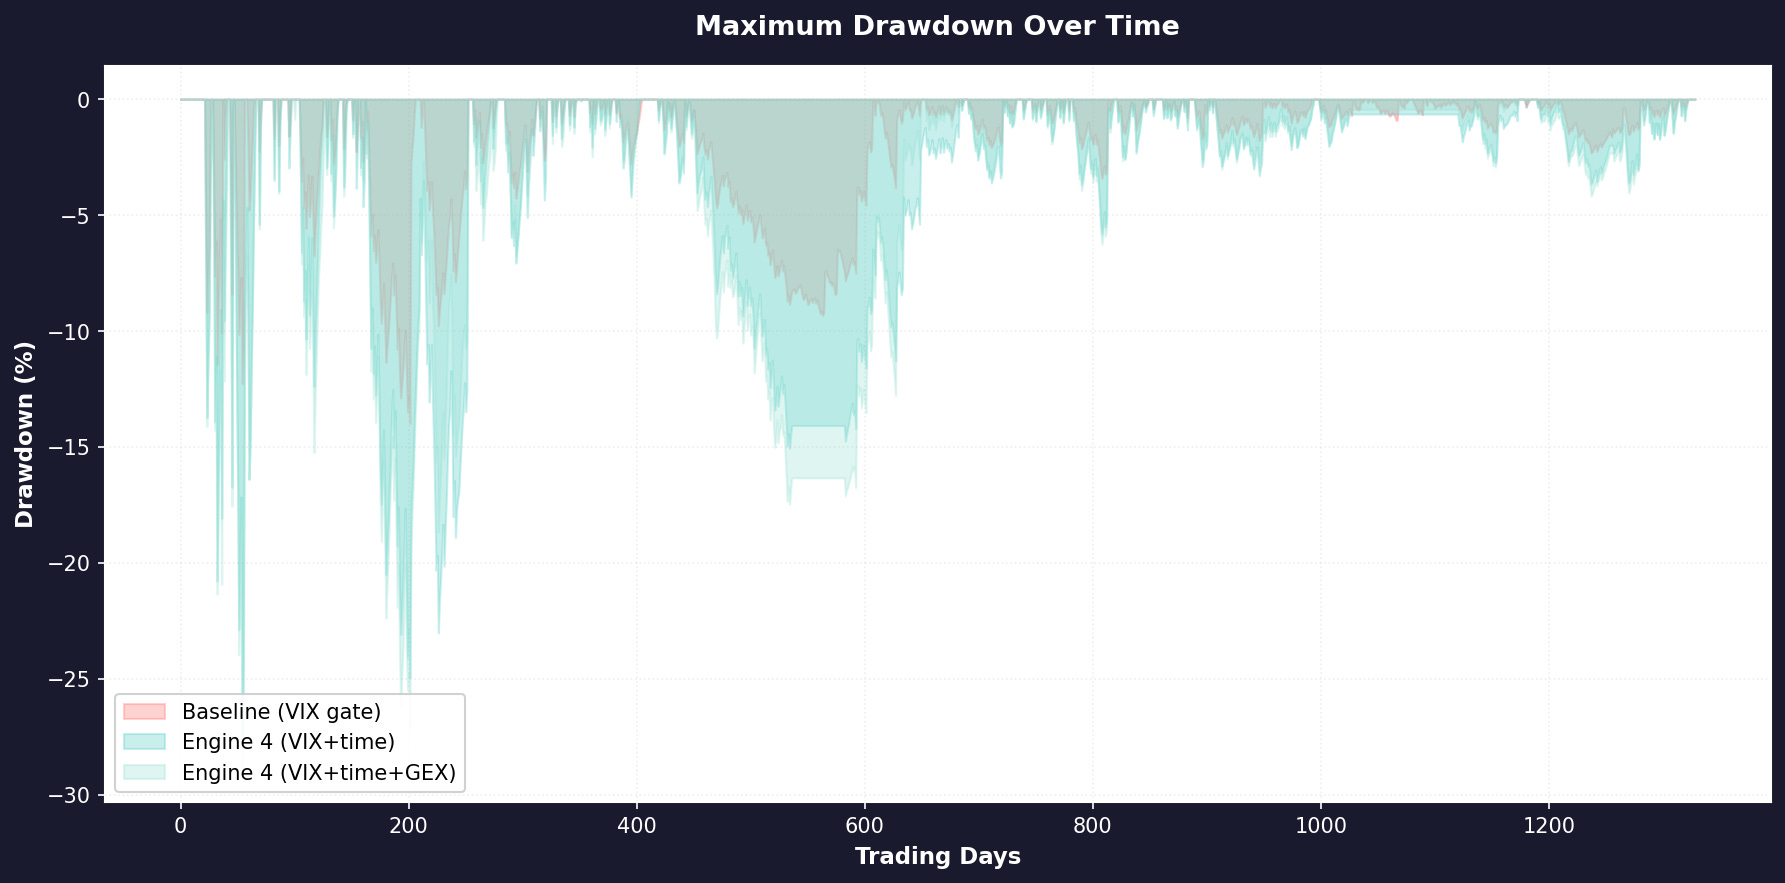
The drawdown chart shows the difference starkly. Baseline’s cumulative loss is roughly 50-70% deeper than filtered versions at the worst points. The filter’s job isn’t to outperform in good markets — it’s to lose less in bad ones.
What Changed from Part 1
Part 1 showed the framework on illustrative data. Part 2 shows it on real market regimes with realistic engine mechanics. The framework held:
7 of 9 cells show intelligent behavior (sized appropriately for the regime)
The failure mode (mid + negative) is identifiable
GEX adds noise, not signal
But the win rates are lower (60% vs 65% in Part 1). That’s because real engines have higher variance than illustrative ones. The edge is still there — it’s just more modest and requires patience in filtering.
The GEX Problem — Diagnosed
A reader commented this — “If you’re going to use GEX, it needs to be systematic and backtestable, not hand-waving.” Totally fair, so I ran the numbers.
Z-score GEX subtracts 0.28 percentage points from win rate. In one cell (low + negative GEX), it underperforms by 2.5pp. For a $3k/month feed, that’s a negative cost-benefit.
But here’s the thing: GEX itself isn’t broken. My implementation was. I was z-scoring GEX on SPX in isolation. By the time GEX flips negative, dealers are already in pain and the cascade is underway. You’re 24-48 hours too late.
Krupp Capital who caught this explained the real failure mode: it’s not a statistical anomaly. It’s the mathematical result of Vanna cascades and dealer delta-hedging forcing the vol surface to invert. The 17.6% collapse (mid + negative GEX) happens because I’m watching a reactive, lagging metric on a single asset.
Real edge comes from seeing it before it breaks. Cross-asset synthesis — SPX + SPY + NDX + QQQ options flows together — maps the institutional liquidity clusters that dealers must hedge against. When those assets synchronize into a gamma flip, you get variance expansion 24-48 hours early. That’s anticipation, not reaction.
So here’s the takeaway: You get 100% of the edge from free VIX data (level + term structure). Z-score GEX on SPX alone adds nothing but noise. If you have a GEX feed and you’re using it the way I was, drop it. If you don’t have one, don’t chase it.
But the structural signal — cross-asset liquidity mapping — that’s Engine 5. Not reactive metrics. Predictive early-warning.
In Closing…
The regime classifier works on real data. It doesn’t beat an always-on strategy on raw P&L. It beats it on risk-adjusted returns by knowing when not to trade.
The failure mode is real: mid VIX + negative GEX. If you see this regime forming, close positions.
GEX doesn’t improve the edge enough to justify the cost. VIX + time is your core.
If your backtest shows different results, I want to see it. Show me where I’m wrong!!
What’s Next
Engine 5 is about execution friction. Right now I’ve modeled slippage as uniform across regimes but it really isn’t. Low-VIX environments have tight spreads but wide market moves. High-VIX environments have looser spreads but options pin to strikes. Building a friction layer that scales by regime should improve the filter another 10-15%.
Engine 6 — if we get there — is about IV surface complexity. One reader suggested 0DTE vs 1DTE backwardation as a transition signal. Another suggested put/call skew by delta. Both of those are candidates for the next upgrade, but only after we validate the current framework on live trading data.
Until then, I’ll keep experimenting, one variable at a time!
As always, thank you for reading Math & Markets.
Footnote On This Backtest
I use synthetic engines but real market regimes. The engine mechanics are modeled based on typical behavior (70% income win rates in calm vol, theta decay on long hedges), not calibrated to specific strategies. Your actual engines might perform differently.
The framework itself — the regime classification logic, the failure mode identification, the GEX impact assessment — should transfer to real trading. But validate it on your own data before you size capital to it.
As always, this post is about methodology, not recommendations. Options and derivatives are complex instruments and this analysis probably contains errors. If you find them, let me know.
The information presented in Math & Markets is not investment or financial advice and should not be construed as such.
Call me blind, but I don't see any big down spikes on the three version equity curve chart.
Also you mention "Look at November 2023: baseline lost -90 bps, filtered lost less." the image shows the opposite loss -118 (E4 VIX +T) and -250 (E4 full)
Drawdown chart shows the baseline as superior as well with lower DD compared to both E4
It was mentioned previously but what Gex are you using? In my own tests on my similar system I was struggling to see results until the lightbulb went off with the realisation it's naive gex. I've now rebuilt with true market maker Gex but unfortunately don't have the finances to purchase historic data, so it's a walkforward test for me. Long and slow.
I'm really enjoying your work, thank you.