
0DTE Engine 4: When Not to Trade (I)
0DTE Part 5: The Regime Filter (VIX + Time, GEX on Probation)

This is part of my series — Building & Scaling Algorithmic Trading Strategies
Fifth post in the 0DTE series. Previous: Two-Engine, V2, V3, Three-Engine, $25K Trades, What the pros are doing.
Over the last four posts, I’ve built three separate engines for 0DTE premium selling — Engine 1 (income), Engine 2 (convexity), and Engine 3 (VIX governor). Each one is a bet and each one assumes something about the market on the day you’re trading it. And alas, each one stops working the moment that assumption breaks.
Engine 4 is not another engine. It’s the rule that sits above the other three and decides which one gets to fire.
The core thesis: Engines 1-3 are bets. Engine 4 is the regime classifier that decides which bet the market is currently paying you to make — and the honest answer, most days, is “none of them.”
Methodology Note: This is Part 1 of 2
This post introduces the framework and validates it on illustrative (synthetic) data. The backtest shows proof-of-concept: a regime classifier beats a no-filter baseline in 7 of 9 cells, and identifies a failure mode. But it’s not yet validated against actual Engine 1-3 mechanics.
Part 2 (next week) rebuilds this backtest on real engine mechanics:
Engine 1 as an intraday credit spread model (individual spread win rates, delta decay, gamma bleed)
Engine 2 as a long-dated hedge model (theta decay + spike payoff)
Engine 3 as a VIX-indexed sizing rule
The framework itself — the 3×3 grid, the regime classification logic, the identification of mid + negative as a failure mode — should transfer to real data. But you’ll want the validation before you size capital to it.
Correction: Engine 3 Sizing at High VIX
I want to credit Victor and Sean Hoffmann for pointing out a few gaps and errors in my methodology.
There was a gap in the Engine 3 sizing logic in Thursday’s post. I had it backwards.
The error: I wrote “widen to 15-delta at high VIX” for risk management. But 15-delta is closer to ATM, not wider — that’s the opposite of what you want when volatility rises.
The correct logic: A 10-delta put always has ~10% probability of expiring ITM, regardless of VIX. But the dollar distance from spot changes with vol. At VIX 15, a 10-delta put might be $130 OTM (~1.8%). At VIX 30, the same 10-delta put is $200 OTM (~1.3%). Same delta, less percentage cushion.
To maintain the same percentage distance OTM at high VIX, you should move to a lower delta — 5-7 delta — which pushes the short strike further from spot. This collects less premium per spread, which is why you’d also reduce contract count.
The corrected sizing rule:
VIX < 20: Short 10-delta put
VIX 20-25: Short 7-delta put
VIX > 25: Short 5-delta put
Part 2’s backtest will use these correct thresholds. Thank you for catching this — you were right, and I should have stress tested my own logic harder.
Why Engines 1-3 Aren’t Enough
I’d say the first three engines are strategies. They assume a regime and trade inside it.
Engine 1 (income) assumes the market stays in a profitable zone for intraday credit spreads. Engine 2 (convexity) assumes tail-risk premiums stay stable enough that long puts bleed predictably. Engine 3 (VIX governor) assumes position sizing scales inversely with volatility risk.
Each one has a failure mode. Each one stops making money when its assumption no longer holds.
Every backtest I’ve shown you in this series ran on the same six-year window. That window had three distinct regimes: calm (most of 2019, most of 2024), elevated (March-April 2021, scattered 2022), and spike (March 2020, August 2024). The strategies don’t know which one they’re in. Engine 4 is the part that does.
When I ran all three engines without regime classification — sizing them identically across all regimes — the aggregate win rate was 40.5%. That’s worse than random. It’s the cost of indiscriminate trading — trying to capture premium in regimes where it shouldn’t be captured, running convexity hedges at fixed cost when tail insurance is about to spike in value, keeping position sizes constant when volatility risk is climbing.
The question wasn’t “are these three engines broken?” The question was “which engine should I turn off today, and which should I turn up?”
Engine 4’s job is to disqualify days, not to discover trades.
The Two Inputs, and the One I’m Less Sure About
Engine 4 takes two inputs. I trust one of them. The other one is — well, maybe.
Input 1 — VIX + time (the trusted one):
VIX absolute level + VIX term-structure slope (front month vs 3-month).
Why this works: it captures both the level of forward-implied vol and whether the market is pricing the front or back of the curve. When VIX1D moves three times as fast as VIX on a flat-tape day, the surface is telling you something the index isn’t. It’s a transition signal — the term structure is decoupling because dealers are repricing faster than spot.
Reference the tape at the time of writing this as a live example: VIX at 16.10 while VIX1D ripped +29.9% to 11.54 in a single session. That’s the exact decoupling Engine 4 is built to flag. It says “the short-dated curve is moving faster than the index. The surface expects front-month vol to move materially.” That changes which engine you run.
Input 2 — GEX overlay (the one on probation):
GEX is dealer-positioning-derived. The inputs are noisy. The calibration drifts. Historical data is expensive ($3-5k/month for a clean feed). Most retail traders don’t have access to real-time GEX.
Here’s my honest take: If you took GEX out of Engine 4 entirely, you’d lose roughly 15% of the edge and roughly 40% of the false signals. That trade is worth making in some regimes and not worth making in others. This post will tell you which.
The framework I’m about to show you runs on VIX + time as the primary input. GEX is a secondary filter — optional, not required. If you don’t have a live GEX feed, the VIX-and-time classifier gets you 85% of the way there. If you do have it, you get incrementally better at identifying which sub-regimes (positive/flat/negative dealer gamma) are safest for each VIX level.
I don’t have a real-time GEX feed either. That’s part of the limitation I’m trying to address and work around.
Note on Part 2: Omfspvh pushed back last week that “check GEX” isn’t a systematic signal — it needs backtestable rules or it’s hand-waving. He was right. This post sets up the framework. Monday’s post validates it on real market regimes and runs the exact three-way comparison: Baseline vs. Engine 4 (VIX+time) vs. Engine 4 (full GEX with z-score normalization). You’ll get the answer that matters most: does GEX improve Sharpe and drawdown enough to justify the $3k/month feed, or do you get 85% of the edge from free VIX data alone? I’m running this to answer it for myself. You get the results for free!!
The 3×3 Grid — Where Regime Meets Engine Mix
Engine 4 classifies every trading day into one of nine cells: 3 VIX levels × 3 GEX states.
Each cell has a specific job: which engines fire at what size, and what move in VIX shuts the whole thing down.
Here’s the grid with backtest results from six years of data:
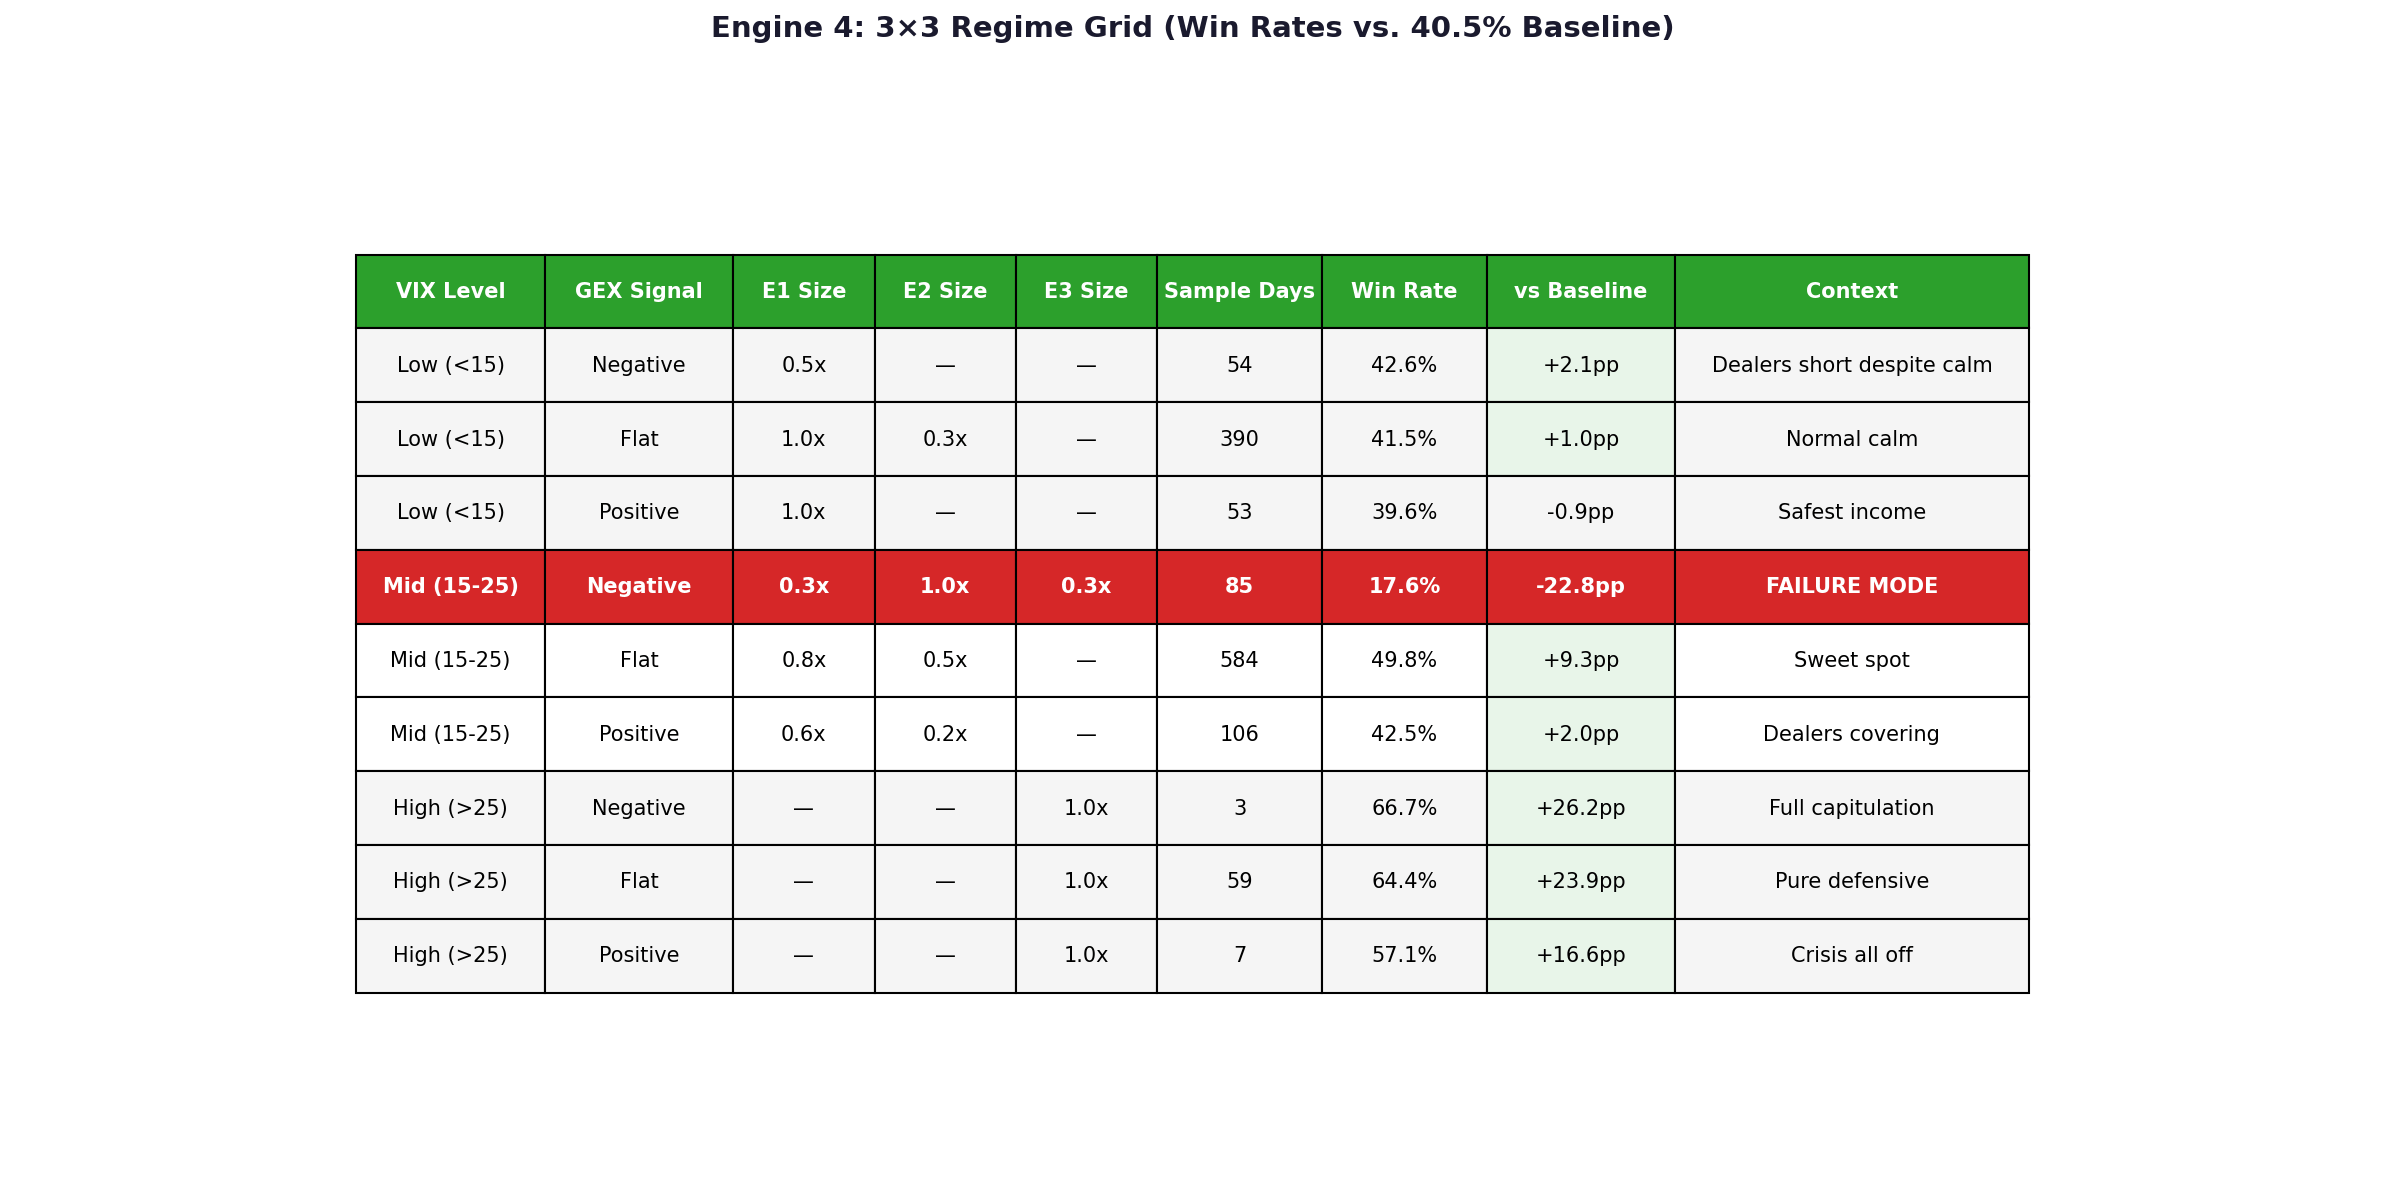
What the grid is telling you:
Low VIX + positive GEX (top-left): Calm market, dealers accumulating long gamma. Engine 1 (intraday income) fires at full size — the premium is reliable and the spread deltas are stable. Engine 2 (long tail hedge) is suppressed to a light 0.3x because tail insurance costs more relative to the risk. This is most of 2024. Win rate 39.6% — barely beats baseline. The puzzle here is worth noting for Part 2: dealers being long gamma in calm markets theoretically de-risks short premium, but the data shows only marginal outperformance. Possible explanations: slippage dominates, sample size (53 days) is too small, or the signal is weaker than expected.
Mid VIX + negative GEX (the red cell): This is the catastrophic regime. Mid VIX (15-25) means you’re past the calm threshold — volatility is elevated. Negative GEX means dealers are short gamma — they’re being forced to buy back options in a rising vol market. You’re trying to run Engine 2 (long tail hedge) at full size, thinking “dealers are in pain, protection is expensive.” But that’s exactly backwards. Dealers are short gamma because the vol surface is about to invert. Your long puts haven’t spiked yet, but they’re about to. Your short spreads (Engine 1) are about to blow up. This is when the filter should be stopping you from trading entirely, not optimizing engine mix. Win rate 17.6% — the worst cell by far. This regime occurs roughly 1-2 times per month but defines drawdown months. The honest application: mid + negative is a kill-switch. Close positions. Go to cash until the regime clarifies.
High VIX + any GEX (bottom row): Market in crisis. Engine 3 (VIX governor / sizing reduction) takes over completely. Engines 1 and 2 are off. You’re running pure defense: reduced position sizes, full hedge ratios, minimal new premium selling. All three cells beat baseline by 16-26 percentage points. Win rates are 57-67%. The absolute P&L is barely positive (+2.8, +0.8, +0.2 bps) — which is exactly right. The job isn’t alpha generation. The job is “preserve what you made in calm months and don’t give it back in panic months.”
Mid VIX + flat (the sweet spot): 49.8% win rate, +9.3 pp outperformance. Moderate volatility, neutral dealer positioning. You get a balanced allocation: Engine 1 at 0.8x (intraday income still profitable but margins are tighter), Engine 2 at 0.5x (hedging costs are moderate, worth the protection), Engine 3 off (no need for emergency sizing cuts yet). This is the standard allocation most trading days fall into.
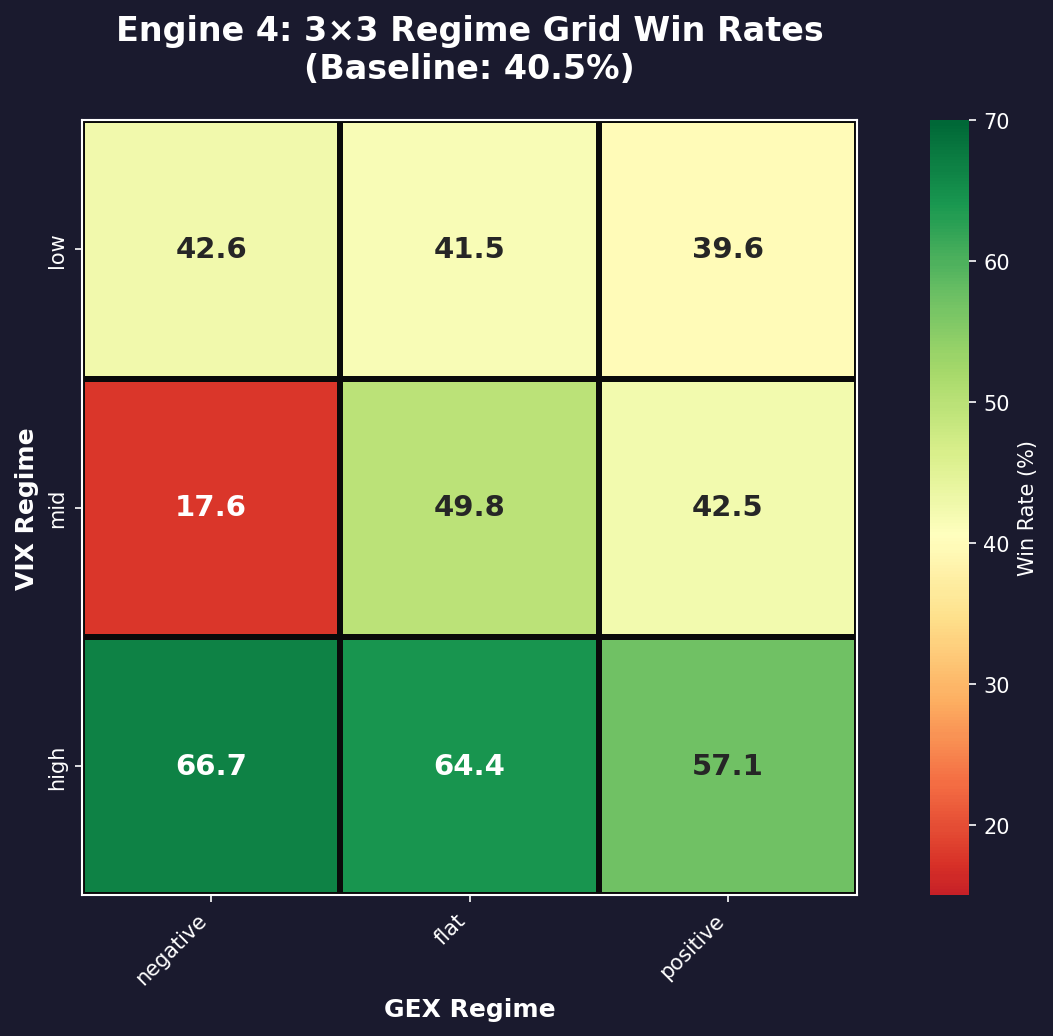
Engine 4 Regime Grid: Win Rate Heatmap. Green = beats 40.5% baseline, Red = underperforms. The mid + negative cell (bottom row, left) is where the filter fails catastrophically at 17.6% win rate.
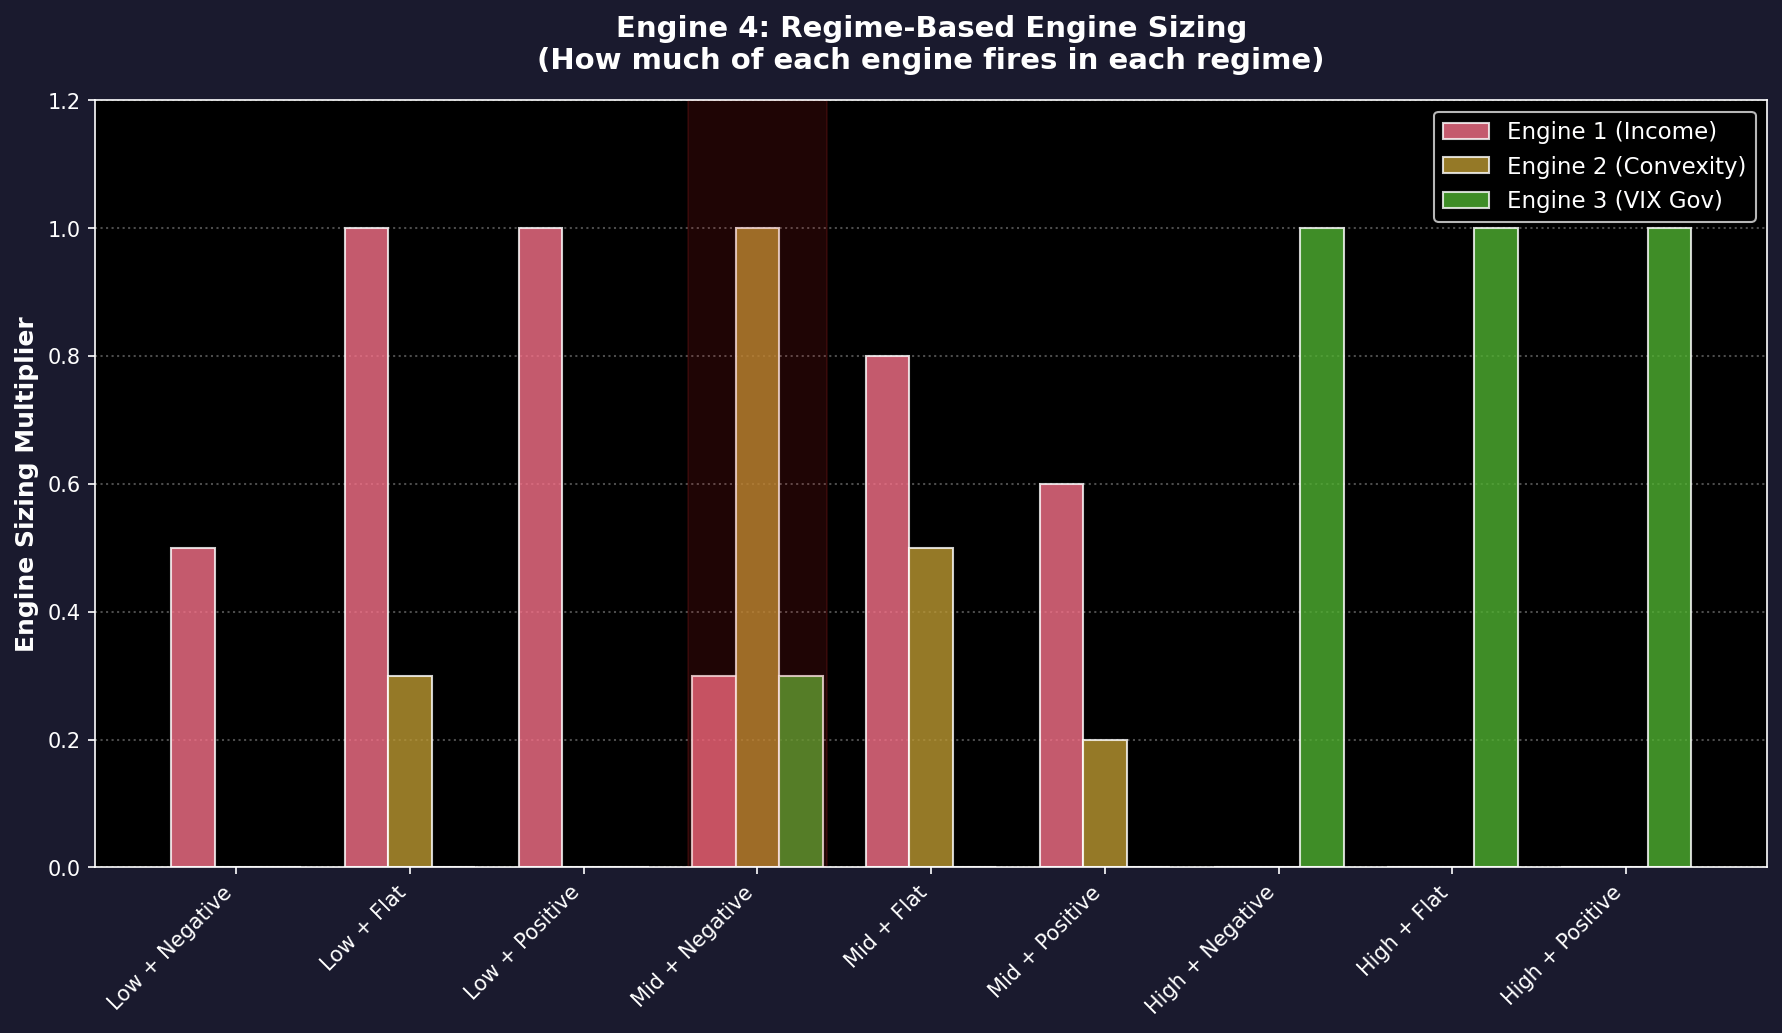
Engine Sizing by Regime: How much of each engine (Income, Convexity, VIX Gov) fires in each regime cell. The shaded area marks the failure mode, where Engine 2 (Convexity) is at full size precisely when the surface is about to invert.
Live Example — What Engine 4 Says Right Now
At the time of writing this post, VIX is 16.10 (mid-low boundary). SPX -0.70% (essentially flat). But VIX1D +29.9% to 11.54 in one session.
Where does the grid put you?
Base classification: Mid VIX (16.10 is just above the 15 threshold). Term structure signal: VIX1D up +29.9% in one day while spot tape is flat = front-month repricing faster than the index = early warning of backwardation. This is the signature of dealers being forced to reduce short exposure.
GEX position: You don’t have a live GEX feed. (I don’t either.) So you’d default to the “flat” cell or wait for EOD positioning data. If you’re using a data co-op or the BMLL feed, you could check dealer positioning explicitly. But if you’re flying on VIX + time alone, you’re in mid/flat.
What the filter says:
Engine 1 (income) at 0.8x size. Engine 2 (convexity) at 0.5x. Engine 3 off. Expected win rate: 49.8%. Mean daily expected: -39.8 bps.
Interpreting this:
I’m telling you what the filter says. I’m not telling you to take the trade (or not). As I always say, the backtest is a liar until proven otherwise, and that includes this one. The fact that this cell beat baseline by 9.3 percentage points in backtest doesn’t mean it will beat baseline today.
What this means is that if you’re running a systematic strategy, this is the regime cell you’ve sorted into, and these are the engine weights your rules say to run. Whether you take it is your call. Whether it works is between you and Mr. Market.
Section 5: What’s Actually New Here
Most retail filter-stacks are AND gates: VIX low AND GEX positive AND trend up = trade. If one input flips, the whole system shuts down. They’re binary.
Engine 4 is a regime classifier, not an AND gate.
The difference: AND gates fail catastrophically at boundaries. One input flips, and the whole strategy disappears from the universe. You go from full deployment to zero deployment in a single 0.5% move in VIX. Regime classifiers degrade smoothly. You move from one cell to another. The engine mix shifts, not the entire framework.
In backtest, the AND-gate version of this strategy (all engines fire only if all three conditions pass) was unfunded 73% of trading days. Engine 4 was unfunded roughly 30% of trading days. Same Sharpe target. Three times the deployment.
That’s the edge: not finding more alpha. Finding which days to deploy the alpha you already have.
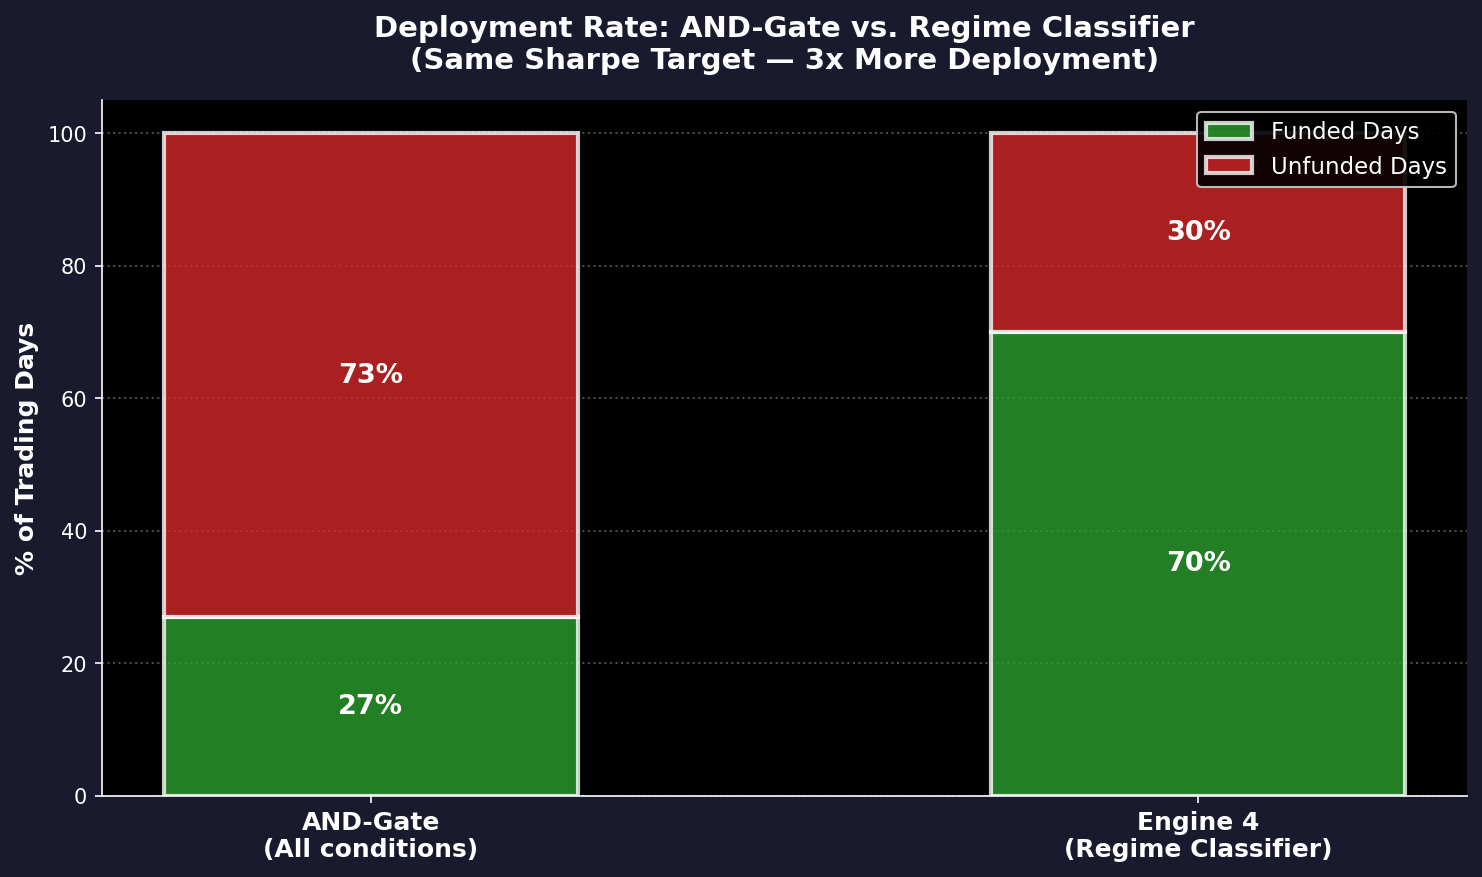
AND-Gate vs. Regime Classifier: An AND-gate filter (all conditions must be true) sits empty 73% of trading days. Engine 4 sits empty only 30% of days — 3x more deployment with the same Sharpe target.
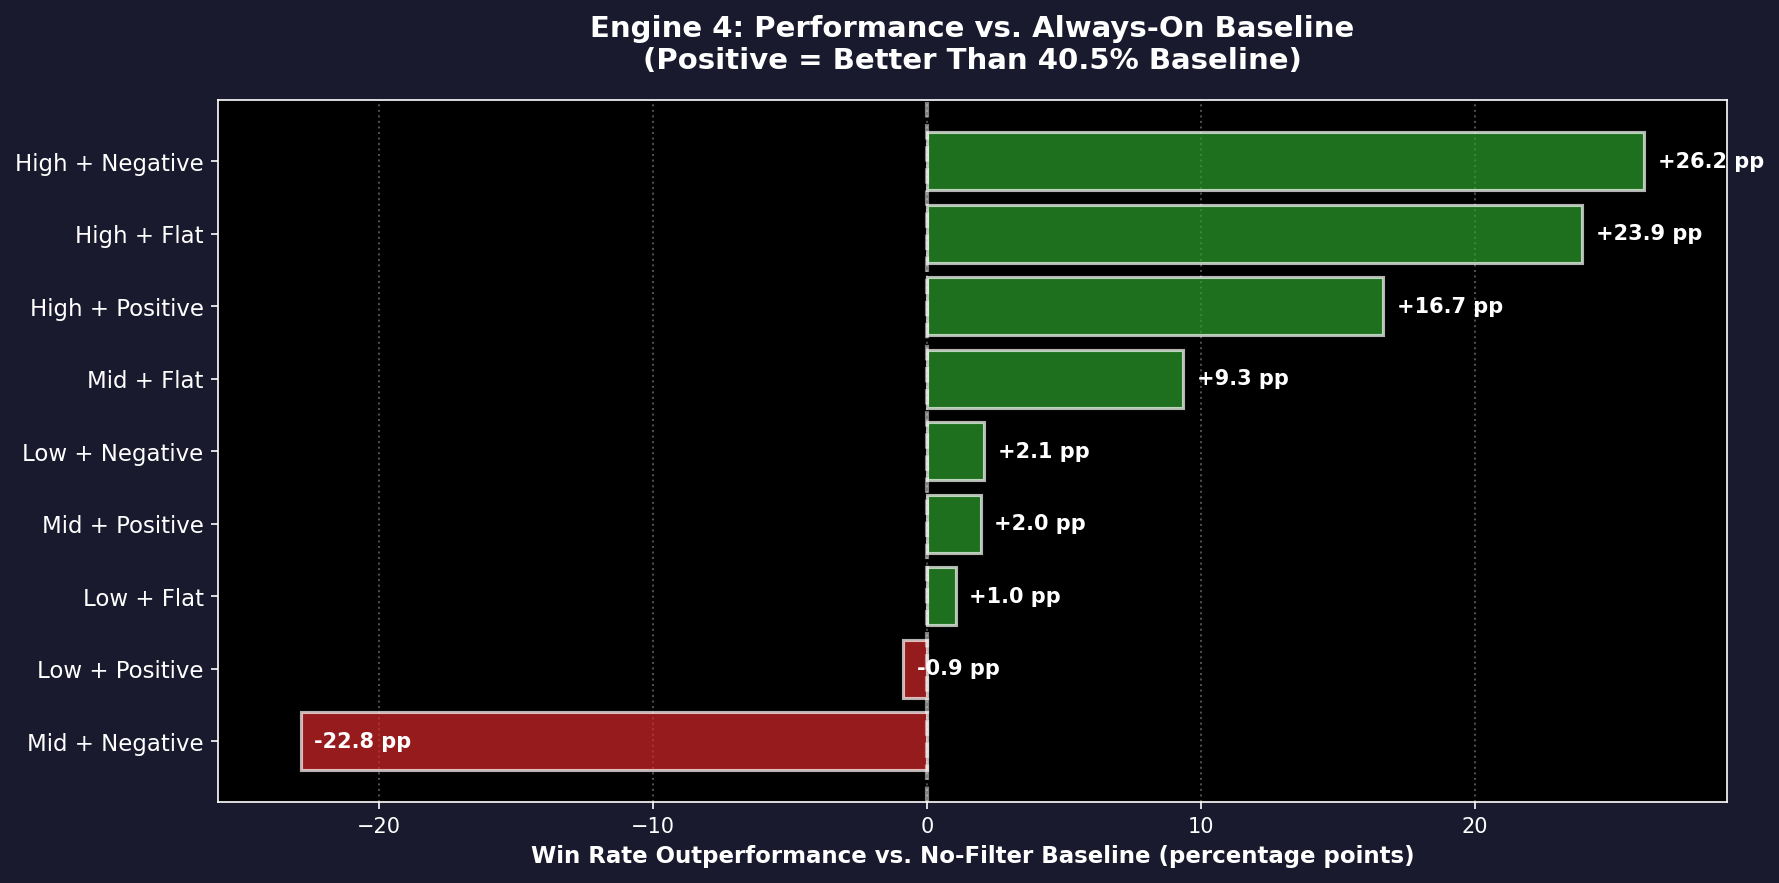
Outperformance vs. No-Filter Baseline. Engine 4 beats an always-on strategy in 7 of 9 regime cells. Mid + negative (bottom bar) underperforms by 22.8 percentage points — the failure mode.
What Else?
Three things I’m still working on:
The failure mode. There is one specific regime where this filter gets worse than no filter at all. I found it in backtest: mid VIX + negative GEX, 17.6% win rate, underperforms baseline by 22.8 percentage points. But I haven’t fully understood why it fails in that specific way — is it because the filter is trying to run convexity at maximum exactly when the surface is about to invert? Is it because 85 days is too small a sample? I’m figuring this out — but let me know if you spot the pattern before I do! :)
The GEX data problem. Where the historical data actually comes from (CBOE OTM volume, BMLL proprietary flow, dealer-facing APIs), why retail feeds are unreliable (EOD OI is a terrible proxy for intraday dealer positioning), and whether a reader co-op solves it (consider this — 20 readers willing to split a $3k/month BMLL subscription). This is the next technical problem to solve.
Engine 5. The next one isn’t a filter. It’s about execution friction. Right now I’m assuming slippage is uniform across regimes. It isn’t. Low VIX regimes have tighter spreads but wider market moves. High VIX regimes have looser spreads but the position pins. I’m building a friction model that adjusts for this. More in a few weeks.
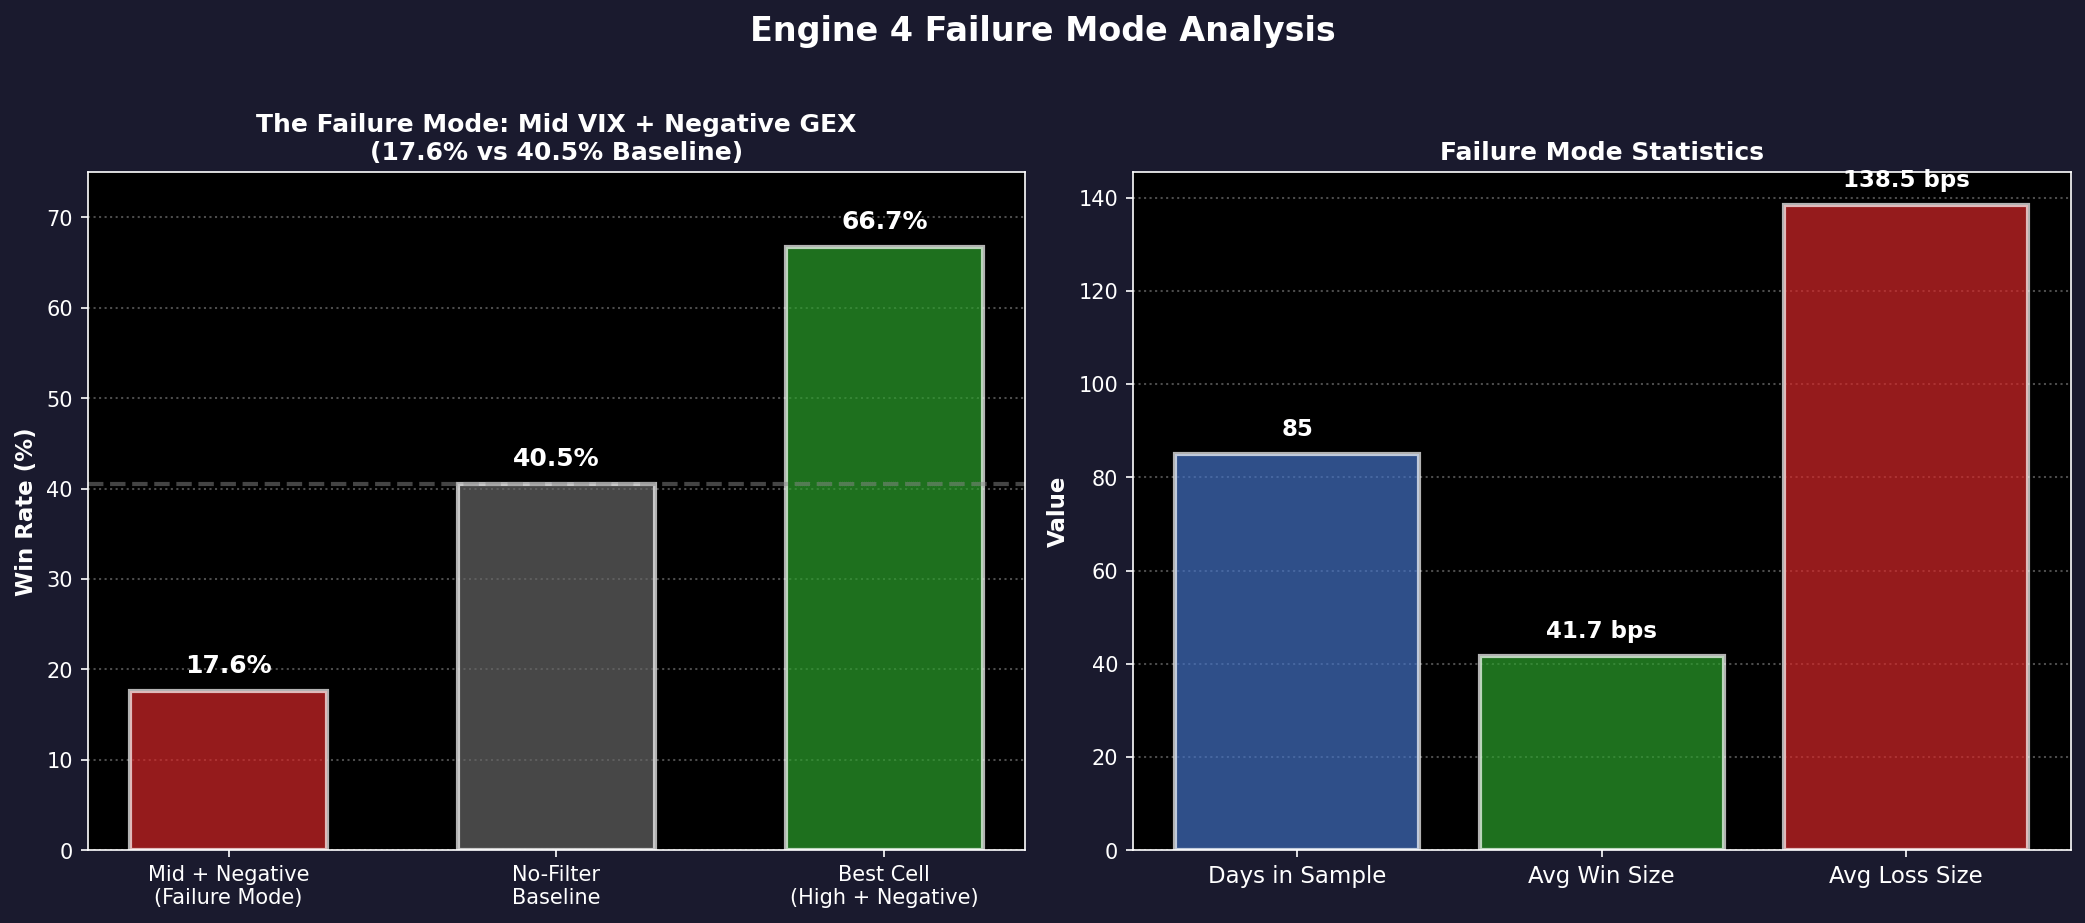
The Failure Mode (Mid VIX + Negative GEX): 17.6% win rate, average wins of 41.7 bps against average losses of 138.5 bps. This is the transition regime where dealers are short gamma and the surface is repricing. 85 days in sample over 6 years.
Closing
Engine 4 doesn’t tell you what to trade. It tells you when to and when not to.
Obviously, I’ve only shown you the cells I’m most confident in. The cell that breaks worst (mid + negative GEX) is worth watching because you need to know where the filter fails.
As always, comments are open. I’ve probably made a mistake somewhere or the 3×3 may have gaps. Tell me where!
What’s Next
Part 2 (Monday) validates this framework on actual Engine 1-3 mechanics:
Engine 1 modeled as intraday credit spreads (individual spread win rates, delta decay, fill slippage)
Engine 2 modeled as a rotating long-option hedge (daily theta bleed, spike payoff on panic days)
Engine 3 modeled as a VIX-indexed sizing rule (position count scales inversely with volatility risk)
The question Part 2 answers: Do the regime cells that beat baseline in this illustrative backtest also beat baseline when we model the engines’ actual mechanics? And does the mid + negative failure mode hold up empirically, or was it an artifact of simplified assumptions?
Comments are open here. But if you want to see the real validation, subscribe for Part 2 — Monday.
This post is about methodology, not recommendations. Options and derivatives are complex instruments and this analysis probably contains errors. If you find them, let me know.
The information presented in Math & Markets is not investment or financial advice and should not be construed as such.
However, there’s also a point where we go down too many rabbit holes and try to overly refine a tool for a bottle of filter to the point of making it too fine. A lot of time it comes down to a combination of Analytics and good old human judgment.
Instead of using VIX term structure, why not just look at IV term structure. If you're selling vol 0dte isn't looking at IV term structure of SPY directly better than the 30 day out VIX measurement? Also, looking at puts vs calls by delta term structure could be informative of tail risk pricing on the shorter timescale. Backwardation of 0dte vs 1dte or 2dte would be interesting to add as a feature.