
Two-Engine 0DTE Strategy: A Mathematical Risk Model for High-Frequency SPX Premium Selling
Part 36: Short Volatility + Long Convexity 0DTE strategy and the quantitative engine behind it

This is part 36 of my series — Building & Scaling Algorithmic Trading Strategies
Over the past few years, 0DTE SPX options have gone from a niche institutional tool to the most-traded options on the planet. Their explosive growth has pulled a lot of retail traders looking to exploit the consistent intraday premium baked into same-day expiration options (I’m looking at you, WSB).
Recently, a fascinating interview surfaced with a trader who reportedly scaled from a small account to over $1.5M trading 0DTE SPX options full-time using continuous short 0DTE premium selling and long-dated convexity hedges.
This post reconstructs his method and builds a mathematical risk model around it. If you’re someone looking to move beyond “theta farming memes,” this is for you.
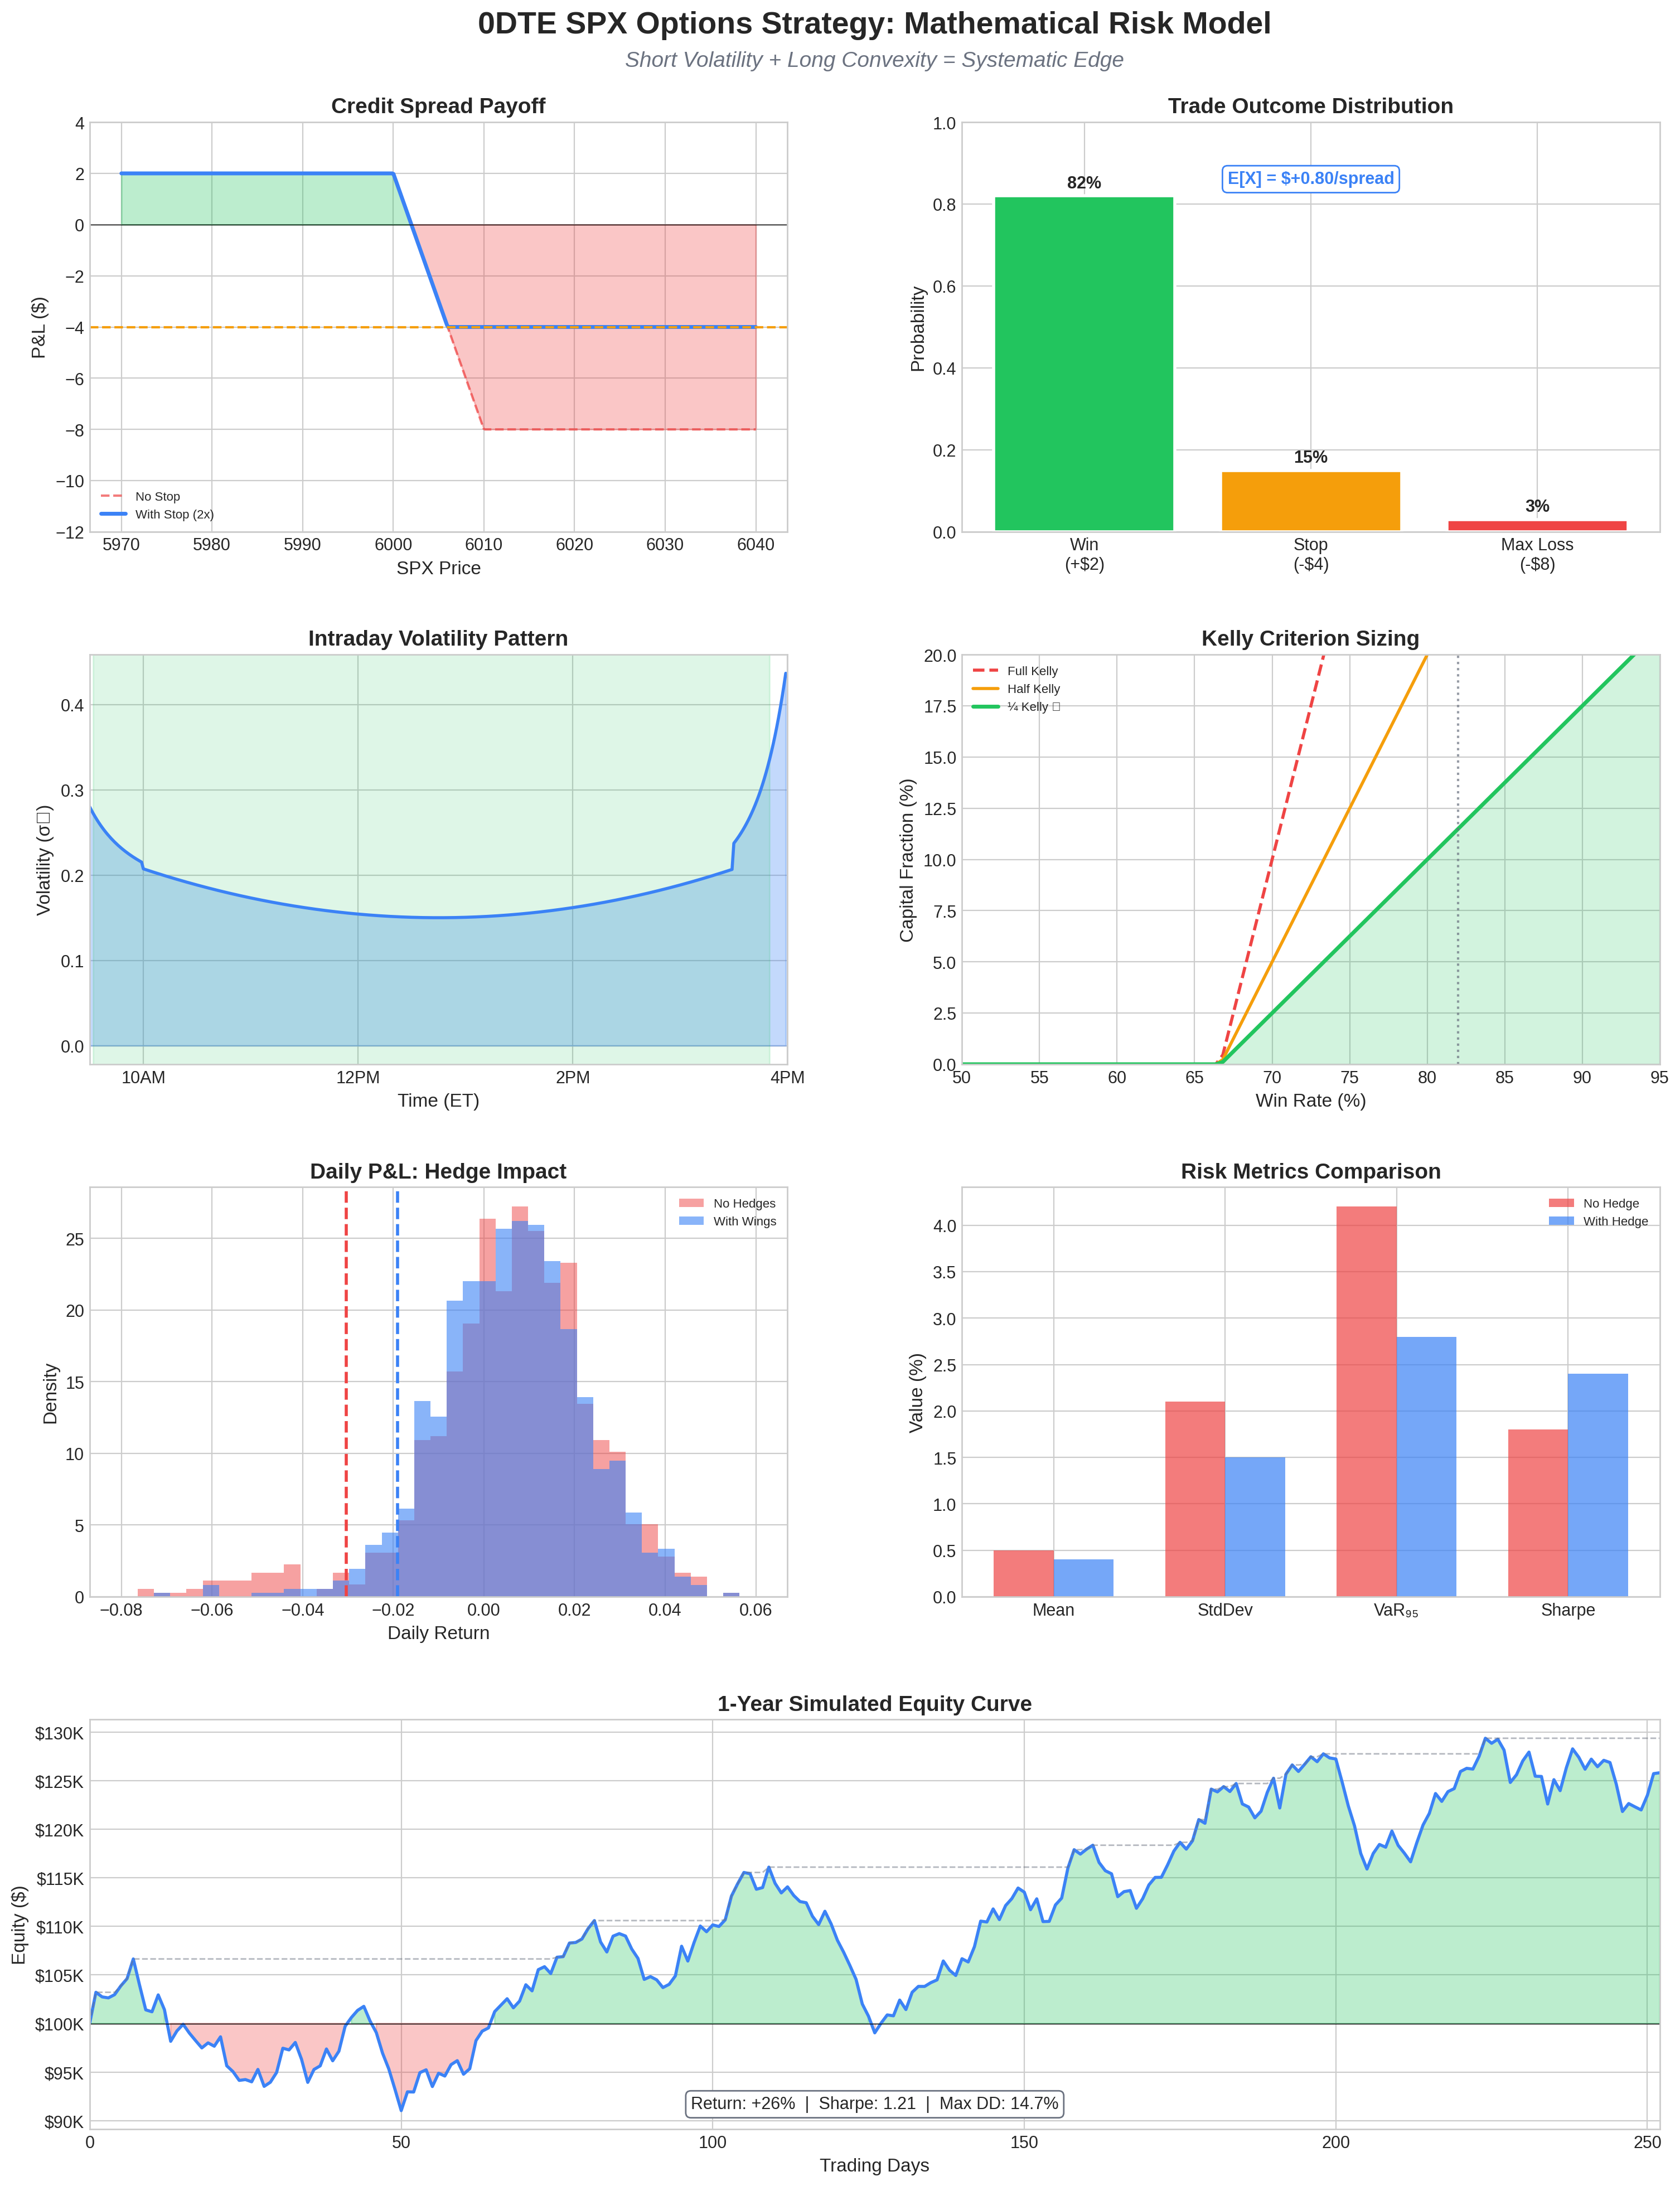
1. Strategy Overview: Short Volatility + Long Convexity
The approach combines two engines:
A. Intraday Engine (Income)
From 9:32am ET to ~3:50pm ET:
Sell 0DTE SPX vertical credit spreads every 2 minutes
Strike selection usually 7–20 Delta
Enter as an iron condor, but only manage the short leg
Use predefined stop losses and close everything 10 minutes before the bell
He completes 150–200 spreads per day.
B. Overnight Engine (Convexity)
At all times, he holds a rotating inventory of:
1DTE to 7DTE long options (both calls and puts)
These are true long convexity positions:
Long Gamma
Long Vega
Long Delta (especially on the call side)
They offset tail risk, improve margin efficiency, and protect against overnight gaps
This structure makes the portfolio:
Locally concave (income-producing intraday)
Globally convex (protected in tails)
How the spreads are actually structured:
These are called “credit spreads,” but…
They are synthetically naked because the wing is so far away (often a nickel).
He buys very cheap wings (sometimes $0.05), sometimes 200 strikes away.
My guess is that the purpose of the wing is a combination of
Margin reduction,
Regulatory compliance,
And minimal true hedging effect.
2. Notation: Building a Quant-Friendly Framework
To analyze the full strategy, we define:
A = Account equity at start of day
Sₜ = SPX level at time t
t₁, t₂, ..., tₙ = Trading timestamps (every 2 minutes), where N ≈ 150–200
For each trade i:
qᵢ = Short spread size
cᵢ = Credit collected
Wᵢ = Spread width
Lᵢᵐᵃˣ = Maximum loss = Wᵢ − cᵢ
Lᵢˢᵗᵒᵖ = Stop-loss level = min(k × cᵢ, Lᵢᵐᵃˣ)
We want to model:
P_day = Σᵢ qᵢXᵢ + P_wings
where Xᵢ is per-spread P&L and P_wings is the daily mark-to-market change in the long DTE wing portfolio.
3. SPX Intraday Price Model
0DTE spreads live or die on intraday movement.
So we model SPX minute-to-minute returns as:
rₜ = ln(Sₜ₊Δₜ / Sₜ) = μΔt + σₜ√Δt × εₜ + Jₜ
Where:
εₜ ~ N(0,1) — standard normal
σₜ = intraday volatility (higher near open and close)
Jₜ = potential jump (news, macro, micro-crash)
A realistic model uses:
A time-of-day volatility curve
A jump intensity λ calibrated from historical intraday data
This model is sufficient to simulate thousands of SPX intraday paths and estimate spread P&L distribution.
4. Modeling the 0DTE Spread Payoffs
A short call spread with short strike K₁ and long strike K₂ pays:
If Sₜ ≤ K₁:           Π = +cᵢ                    (full profit)
If K₁ < Sₜ < K₂:      Π = cᵢ − (Sₜ − K₁)         (partial loss)
If Sₜ ≥ K₂:           Π = cᵢ − (K₂ − K₁)         (max loss)
Because he uses a stop loss, the realized P&L Xᵢ is:
Xᵢ = +cᵢ           if expires OTM (win)
Xᵢ = −Lᵢˢᵗᵒᵖ       if stop triggered
Xᵢ = −Lᵢᵐᵃˣ        if gap or catastrophic loss
We categorize the probabilities as:
p_win = expires OTM
p_loss = stop loss triggered
p_tail = gap/black swan event
With: p_win + p_loss + p_tail = 1
These are determined empirically from simulation or historical backtesting.
Expected value per trade:
E[Xᵢ] = p_win × cᵢ − p_loss × Lᵢˢᵗᵒᵖ − p_tail × Lᵢᵐᵃˣ
Variance per trade:
Var(Xᵢ) = E[Xᵢ²] − E[Xᵢ]²
5. Modeling the Long DTE Wings (1–7 Days)
These long options:
Are held overnight and intraday
Add convexity
Reduce tail risk
Offer margin offset
Mostly theta-bleed but occasionally spike in value
For long options j in the set L:
Yⱼ = qⱼᴸ × (Πⱼ(Sₜⱼ) − pⱼ)
Daily P&L:
P_wings = Y_end − Y_start
Their main mathematical utility:
Reduce daily Value-at-Risk
Reduce Expected Shortfall (CVaR)
Shrink the left tail of the P&L distribution
Allow larger position sizes in short 0DTE engine
6. Daily P&L Distribution
The total daily P&L:
P_day = Σᵢ qᵢXᵢ + P_wings
Monte Carlo simulation over thousands of SPX intraday paths yields:
Mean daily return
Daily variance
Skew
Kurtosis
Daily VaR
Daily Expected Shortfall
Distribution of tail events
Maximum drawdown (using cumulative equity curve)
7. Risk Metrics: VaR, ES, Drawdown
Value at Risk (VaR)
For confidence level α:
VaR_α = the smallest x such that P(P_day ≤ −x) ≤ 1 − α
Example:
VaR₉₅% = −1.8% means there’s a 5% chance of losing more than 1.8% of equity in a day
Expected Shortfall (CVaR)
ES_α = E[−P_day | P_day ≤ −VaR_α]
This measures the average of the worst losses.
Maximum Drawdown
Let Aₜ be the equity curve:
DDₜ = (max Aᵤ for u ≤ t − Aₜ) / (max Aᵤ for u ≤ t)
The largest drawdown is:
MDD = max DDₜ across all t
A realistic target for a high-frequency short-volatility approach is:
MDD < 25–35%
8. Position Sizing: Turning Math Into Execution
Per-Trade Risk Limit
If max per-trade risk is ρ_trade × A, then:
qᵢ ≤ (ρ_trade × A) / Lᵢˢᵗᵒᵖ
Tail-Risk Constraint
Using worst-case loss:
qᵢ ≤ (ρ_tail × A) / Lᵢᵐᵃˣ
Kelly-Style Sizing
Given expected value μ and variance σ² of a single spread:
f = μ / σ²*
Actual position size is often:
f = κ × f, where κ = 0.1 to 0.2*
Daily Risk Budget
Let max daily loss = D_max = δ × A.
We use simulation to find a global multiplier λ such that:
P(Intraday Loss > D_max) < ε
often ε = 1% or 2%.
Solve for λ, and scale all qᵢ by λ.
9. My Test Results
Profitable 0DTE Strategy
 8 Winning Trades - 100% Win Rate

  | Trade | Type | Strikes      | Credit | P&L      | Result |
  |-------|------|--------------|--------|----------|--------|
  | 1     | PUT  | 6660/6670 x5 | $0.24  | +$104.85 | Profit |
  | 1     | CALL | 6870/6880 x5 | $0.27  | +$120.01 | Profit |
  | 2     | PUT  | 6680/6690 x5 | $0.21  | +$90.47  | Profit |
  | 2     | CALL | 6895/6905 x5 | $0.25  | +$112.35 | Profit |
  | 3     | PUT  | 6690/6700 x5 | $0.21  | +$89.84  | Profit |
  | 3     | CALL | 6905/6915 x5 | $0.26  | +$114.84 | Profit |
  | 4     | PUT  | 6685/6695 x5 | $0.23  | +$99.51  | Profit |
  | 4     | CALL | 6900/6910 x5 | $0.23  | +$103.26 | Profit |

  Total Profit: $835.12 (net of commissions)
Enter 4 iron condors throughout the day
Collect $230-250 per position
All expired OTM (worthless) = keep full credit
Win rate: 100% (on this particular day)
Average win: $104 per spread
Total Day P&L: +$835.12 on $100K account = 0.84% daily return
Why this works
So the edge doesn’t come from simply “selling theta.” It comes from 4 things:
1. Long-wing convexity
You’re globally positioned to benefit from outlier moves.
2. Intraday premium
0DTE SPX options reprice rapidly and often inefficiently after news or micro-moves.
3. Not crossing the spread
Letting many trades expire avoids the 2–5% spread crossing cost present when closing trades manually.
4. Hundreds of small bets
The law of large numbers stabilizes variance.
5. Systematic
Time-based entries + time-based exits force a structure and process, making it systematic.
10. Conclusion: Systematic, Repeatable, Quantifiable
Sorry, WSB. This strategy is not gambling or “YOLO theta.” It’s a structured micro-premium harvesting engine supported by a mathematically defensible convexity hedge. This is /r/thetagang material.
The long wings transform the risk profile, allowing:
Higher trade frequency
Larger position size
Smaller tail-event exposure
Better recovery from intraday volatility shocks
The short 0DTE engine generates consistent income. The long DTE engine prevents disaster.
Together, they create a risk-balanced short-volatility machine. So if I can make this strategy programmatic, I’ll add it to the bucket of “interesting” strategies with potential long-term prospects.
This post is about methodology, not recommendations. Options and derivatives are complex instruments and this analysis probably contains errors. If you find them, let me know.
The information presented in Math & Markets is not investment or financial advice and should not be construed as such.
What a great share. Thanks for this.
Thank you for proving such incredible value! Question about the convexity hedges: can you actually describe how to calculate the correct amount of base hedge? I’m interested in implementing the three engine strategy. I am experimenting with option Alpha as my execution platform. I do have access to Gamma levels (Gexbot). I’m guessing that in order to implement the three engine strategy, I would have to actually code this strategy and run it using a platform that allows execution of options trades. Do you have recommendations for coding/running this strategy?