
V3 of the Two-Engine 0DTE Strategy: Monte Carlo Reveals the Edge
Part 58: Probability weighting flips a -$1.9M loss into +$752k expected profit

This is part 58 of my series — Building & Scaling Algorithmic Trading Strategies
In Part 57, I stress-tested the 0DTE iron condor strategy across 14 scenarios including flash crashes, Black Monday events, and VIX spikes to 70. The result: every strategy variant ended net negative. A sobering finding.
But stress tests answer the wrong question. They tell you what can happen. Monte Carlo tells you what likely happens. It’s an important distinction!
In this part, I discuss how 10,000 simulated trading years reveal a very different picture on what’s likely to happen.
The Setup
The Monte Carlo framework samples from historical probability distributions (1990-2025 SPX data) rather than equal-weighting all scenarios. Each simulated year draws 252 trading days, with VIX regime and move size determined by observed market frequencies.
The distributions:
VIX Regime Distribution (1990-2025)
────────────────────────────────────
Low (VIX 8-15)        35% of days
Normal (VIX 15-25)    45% of days
Elevated (VIX 25-35)  15% of days
High (VIX 35-70)       5% of days
Move Size Distribution (All Regimes)
────────────────────────────────────
Small (0-1%) 75% of days
Medium (1-2%) 20% of days
Large (2-3%) 4% of days
Extreme (>3%) 1% of daysThe simulation also models volatility clustering — high VIX tends to persist (60% chance of staying high the next day), while low VIX is stickier (80% persistence). This captures the empirical reality that crashes beget crashes and calm begets calm.
The Results
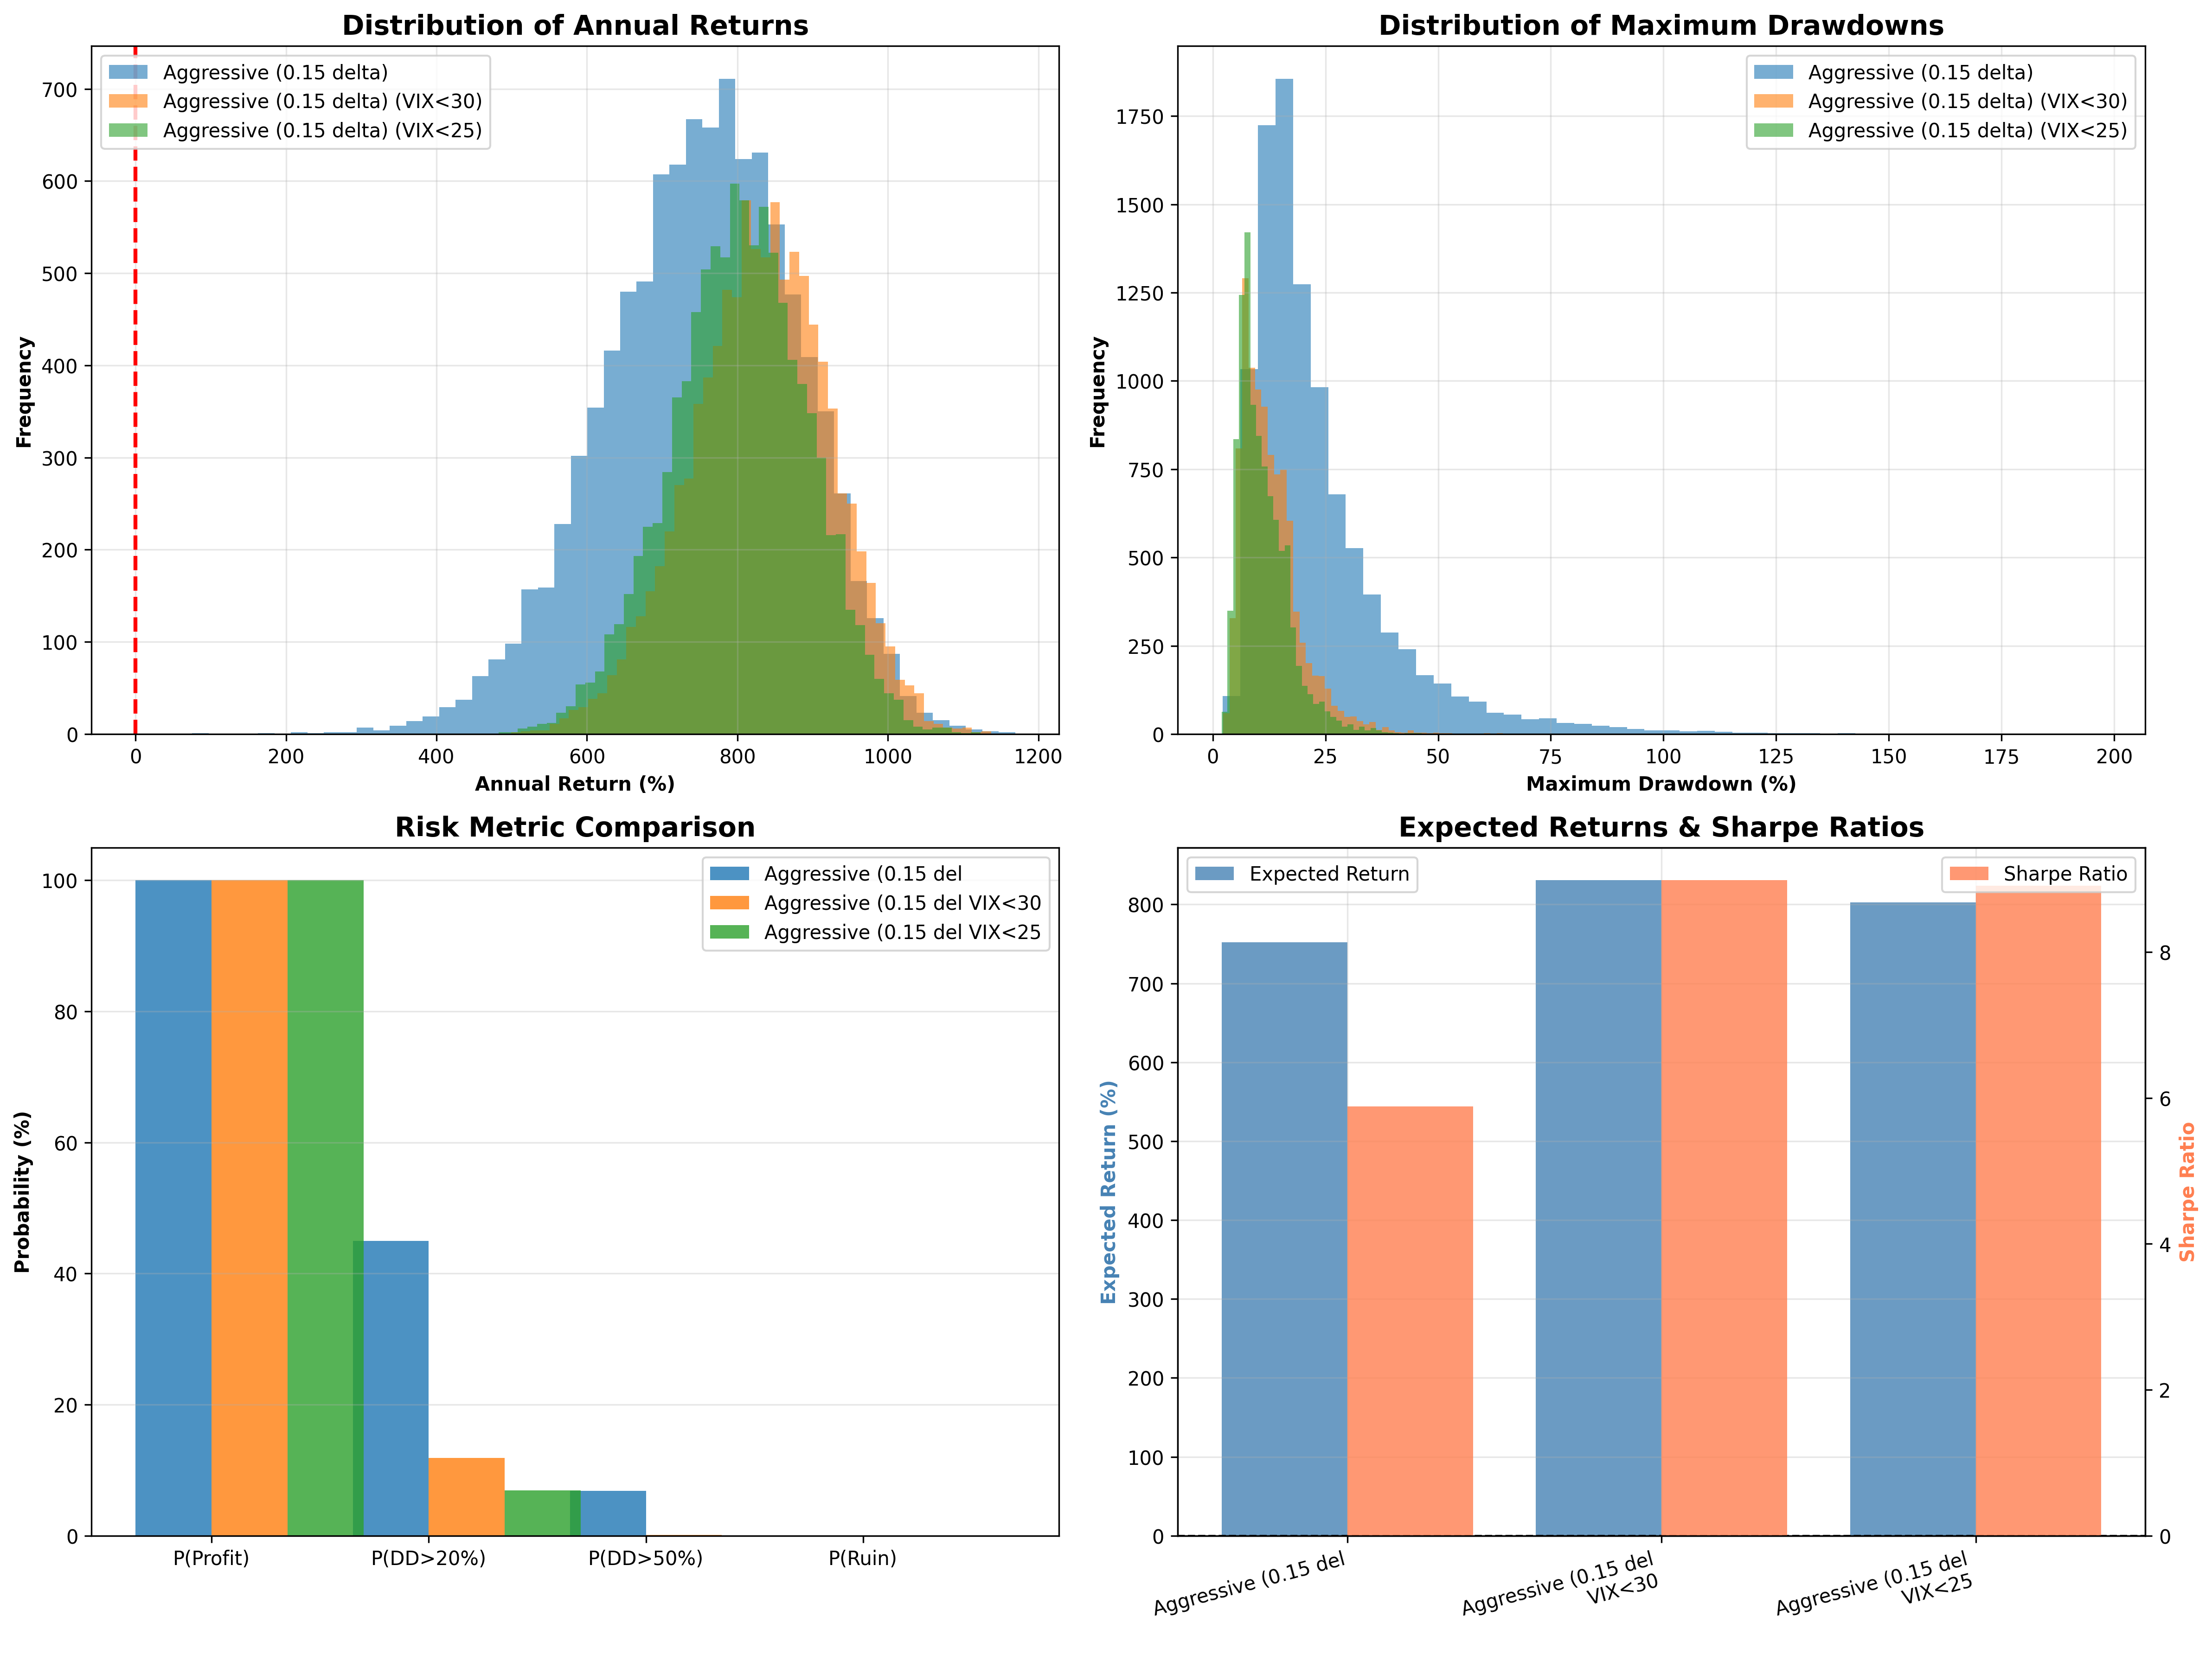
No Filters (Trade All Days)
Metric                      Value
─────────────────────────────────────────────
Expected Annual Return      751.95%
Median Annual Return        758.51%
Return Std Dev              127.78%
Sharpe Ratio                5.88

Return Percentiles:
  5th Percentile            530.57%
  25th Percentile           667.88%
  75th Percentile           842.21%
  95th Percentile           948.01%

Risk Metrics:
  P(Profitable Year)        100.0%
  P(Drawdown > 20%)         45.0%
  P(Drawdown > 50%)         6.9%
  P(Account Ruin)           0.0%
  Avg Max Drawdown          23.6%
  Median Max Drawdown       18.6%
Yes, you read that correctly. 100% probability of a profitable year across 10,000 trials.
But look at the drawdown risk: 45% chance of experiencing a >20% drawdown at some point during the year. The strategy makes money, but the path is bumpy.
With VIX > 30 Filter
What if we simply don’t trade when VIX exceeds 30?
Metric                      Value
─────────────────────────────────────────────
Expected Annual Return      830.58%
Median Annual Return        833.15%
Return Std Dev              92.48%
Sharpe Ratio                8.98

Risk Metrics:
  P(Profitable Year)        100.0%
  P(Drawdown > 20%)         11.8%
  P(Drawdown > 50%)         0.1%
  Avg Max Drawdown          12.9%

Days Skipped                31.3 / 252 (12.4%)
Sharpe ratio jumps from 5.88 to 8.98. Drawdown risk drops from 45% to 11.8%. We sacrifice 12% of trading days and increase expected returns while dramatically reducing risk.
This is the power of regime gating.
With VIX > 25 Filter (More Conservative)
Metric                      Value
─────────────────────────────────────────────
Expected Annual Return      802.38%
Median Annual Return        804.73%
Return Std Dev              90.09%
Sharpe Ratio                8.91

Risk Metrics:
  P(Profitable Year)        100.0%
  P(Drawdown > 20%)         6.9%
  P(Drawdown > 50%)         0.0%
  Avg Max Drawdown          11.2%

Days Skipped                51.3 / 252 (20.4%)
Tighter filtering further reduces drawdown risk (6.9% chance of >20% DD) at the cost of more skipped days. The Sharpe remains excellent at 8.91.
Why Monte Carlo Differs from Stress Testing
The extreme scenario analysis in Part 57 showed -$1.9M total loss. The Monte Carlo shows +$752k expected profit. How do you get from deeply negative to strongly positive?
Probability weighting.
The stress test treated all 14 scenarios as equally likely (1/14 = 7.14% each). That’s useful for understanding tail risk, but it doesn’t reflect reality. Black Monday events don’t happen 7% of the time. They happen roughly 0.1% of the time.
Here’s the mapping:
Scenario Type         Stress Test Weight    Monte Carlo Weight
────────────────────────────────────────────────────────────────
Normal days           57% (8/14)            ~75%
(steady, choppy)

Moderate stress       21% (3/14)            ~20%
(gaps, whipsaws)

Extreme events        21% (3/14)            ~5%
(crashes, VIX spikes)
The strategy makes consistent small gains on 75% of days. It suffers moderate losses on 20% of days. And it gets destroyed on 5% of days — but 5% is very different from 21%.
Under equal weighting, the extreme losses dominate. Under probability weighting, the frequent small wins compound faster than the rare large losses subtract.
The Per-Contract Economics
To translate simulation P&L into realistic trading, I applied a 1/38 scaling factor (the simulation ran 380 iron condors per day; realistic trading is ~10 contracts/day).
Scenario           Scaled P&L (10 contracts)    Per-Contract
─────────────────────────────────────────────────────────────
steady_up                +$5,837                   +$584
steady_down              +$5,876                   +$588
choppy                   +$4,816                   +$482
tight_range              +$5,856                   +$586
flash_crash              -$4,773                   -$477
sustained_crash         -$17,897                 -$1,790
black_monday            -$19,348                 -$1,935
vix_spike               -$11,423                 -$1,142
On a normal day, the strategy generates ~$500-600 per contract. On a Black Monday, it loses ~$1,900 per contract. The ratio is roughly 3:1 against you on the bad days — but the bad days are rare enough that expected value remains positive.
The Critical Insight
Both analyses are correct. They just answer different questions.
Stress Test (Equal Weighting): “What happens if I experience the full range of market conditions with equal frequency?”
Answer: You lose money. The strategy cannot survive if Black Mondays happen as often as normal days.
Monte Carlo (Probability Weighting): “What happens if future market conditions match historical frequency distributions?”
Answer: You make money! The strategy is profitable when extreme events remain rare.
The key assumption is that history repeats. If the market regime shifts — if extreme events become more frequent, if volatility clustering intensifies, if the VIX distribution changes — the Monte Carlo projections break down.
This is why both perspectives matter. The stress test shows what you’re exposed to. The Monte Carlo shows what you should expect.
VIX Filtering: The Clear Edge
The data strongly supports regime gating:
Filter        Expected Return    Sharpe    P(DD>20%)    Days Traded
───────────────────────────────────────────────────────────────────
None                751.95%       5.88        45.0%          252
VIX < 30            830.58%       8.98        11.8%          221
VIX < 25            802.38%       8.91         6.9%          201
VIX filtering improves every metric that matters. Higher returns, higher Sharpe, lower drawdown probability. The mechanism is straightforward: high VIX days are when extreme moves happen. By sitting out those days, you avoid the worst losses while keeping most of the gains.
The optimal threshold appears to be somewhere between 25 and 30. VIX > 30 filtering captures 75% of the risk reduction while only skipping 12% of days. VIX > 25 filtering is more conservative but sacrifices more opportunity.
On a related note, I am yet to find a situation where regime gating hasn’t massively helped with both Sharpe and ROI — if you are building any sort of trading strategy, regime gating should be in your repertoire.
What Needs Verification
The Monte Carlo results are theoretical. Before trusting them with real capital, several assumptions need validation:
1. Position Sizing Calibration
The 1/38 scaling factor assumes $584 profit per contract on normal days. This needs verification against actual trading:
What premium do you actually collect per iron condor?
What’s your real win rate on “normal” days?
What slippage and commissions do you experience?
2. Historical Distributions May Not Hold
The simulation assumes 1990-2025 market statistics persist. But:
Algorithmic trading has changed market microstructure
0DTE options volume has exploded (potentially changing dynamics)
VIX term structure behavior may have shifted
“Black swan” events are by definition outside historical norms
3. The 100% Profitable Year Number
This sounds too good. In 10,000 trials, not a single losing year? That’s a strong claim that deserves skepticism. The likely explanation: under historical probability distributions, the expected daily gain is high enough that even significant drawdowns don’t overcome the cumulative profits. But a single unprecedented event—larger than anything in the 1990-2025 sample—could change that.
4. Drawdown Psychology
Even with VIX filtering, median max drawdown is 11.5%. That means a $100k account should expect to see $88.5k at some point during the year. Can you hold through that without deviating from the strategy?
The Bottom Line
The strategy shows strong theoretical merit under historical conditions:
Expected annual return: 752-830% depending on VIX filtering
Sharpe ratio: 5.88-8.98 (exceptional)
100% probability of profitable year in simulation
But theoretical merit isn’t the same as proven edge. The Monte Carlo assumes history repeats. It assumes the position sizing calibration is correct. It assumes you can execute at simulated prices without significant slippage.
The stress test from Part 57 remains important context. It shows that if your assumptions about probability distributions are wrong — if extreme events happen more often than history suggests—the strategy fails catastrophically. A -$1.9M loss across 14 scenarios is what happens when tail events are no longer tail events.
Next Steps: Position Sizing Calibration
Run Monte Carlo with doubled extreme event frequency
Test impact of increased correlation between consecutive bad days
Model regime change scenarios
The goal is a validated edge: Monte Carlo projections that match paper trading results closely enough to justify real capital allocation.
Technical files:
For some reason, Substack does not allow me to link to the GitHub files directly.
MONTE_CARLO_FINDINGS.md — Complete simulation methodology and results
monte_carlo_simulator.py — 10,000 trial simulation framework
scenario_pnl_data.py — P&L mapping with position sizing
Remember: Alpha is never guaranteed. And the backtest is a liar until proven otherwise.
These posts are about methodology, not recommendations. Some of the approaches discussed here involve complex instruments (e.g., options and derivatives) and not suitable for all investors. Many of my analyses probably contain errors — if you find them, please let me know.
While I may hold positions in some of the underlying assets discussed here, my posts are not an endorsement or a recommendation of those underlying assets.
The material presented in Math & Markets is for informational purposes only. It does not constitute investment or financial advice.
Do you know if there are tools/data providers which allow backtesting option strategies? And/or provide realistic prices and commissions? I wonder if using ideal pricing like your black_scholes_call function does may not be realistic enough.
Interesting post. Sharpe of 9 would be basically the best ever, so definitely agree with your cautions and caveats. Worth noting the Monte Carlo draws from 1990-2025, but daily 0DTE expirations only started in 2022 - different market microstructure. Hard to imagine that there hasn't been a lot of capital arbitraging against the pure 0DTE gamblers though, so I suspect there are (or were) some nutty profits - hard to say if that's still true.