
V2 of the Two-Engine 0DTE Strategy: Stress Test Results & Upgrades
Part 57 explores stress testing across 14 scenarios and building the Monte Carlo framework

This is part 57 of my series — Building & Scaling Algorithmic Trading Strategies
In Part 51, I introduced the Two-Engine 0DTE Strategy — a mathematical risk model for high-frequency SPX premium selling. In this part, we discuss what comprehensive stress testing revealed about where the strategy works, where it breaks, and what V2 needs to look like.
The Stress Testing Framework
Any backtest is only as good as its scenario coverage. My initial tests covered 8 scenarios—steady trends, choppy markets, moderate gap movements. Useful for validating core mechanics, but insufficient for understanding tail risk.
V2 testing expanded to 14 scenarios calibrated against historical market events:
Normal Conditions (5 scenarios): Steady up/down (±$20), choppy, tight range (VIX 10), ultra-low vol (VIX 8)
Extreme Downside (4 scenarios):
Flash Crash: -$100 in 30 minutes, 50% recovery (VIX 45)
Sustained Crash: -$150 throughout day (VIX 55)
Black Monday Style: -$200 (-3.4%) (VIX 65)
Gap Down Open: -$120 at open (VIX 40)
Extreme Upside (2 scenarios): Short squeeze +$150, gap up rally +$140
Extreme Volatility (3 scenarios): Whipsaw reversals, double reversals, VIX spike to 70
I also tightened up the Black-Scholes implementation — switching from trading-time to calendar-time for time-to-expiry, which is the industry standard. This brought delta targeting right on the 0.10 mark and aligned option pricing with market reality.
What the Numbers Show
The strategy bifurcates cleanly across market regimes:
Normal/Low Volatility (7 scenarios):
Strategy              Avg Daily P&L    Trade Win Rate
───────────────────────────────────────────────────────
Aggressive (0.15Δ)       +$201,840            95%
Baseline (0.10Δ)         +$148,290            93%
Conservative (0.05Δ)      +$89,450            91%
In calm markets, the strategy prints. Higher delta = higher returns, with trade-level win rates above 90%.
Extreme Scenarios (7 scenarios):
Strategy                   Avg Daily P&L    Trade Win Rate
──────────────────────────────────────────────────────────────
Aggressive (0.15Δ)            -$407,350            37%
Baseline (0.10Δ)              -$389,740            35%
Ultra Conservative (0.03Δ)    -$362,180            33%
When markets move hard, all variations lose. The losses dwarf the gains from normal conditions.
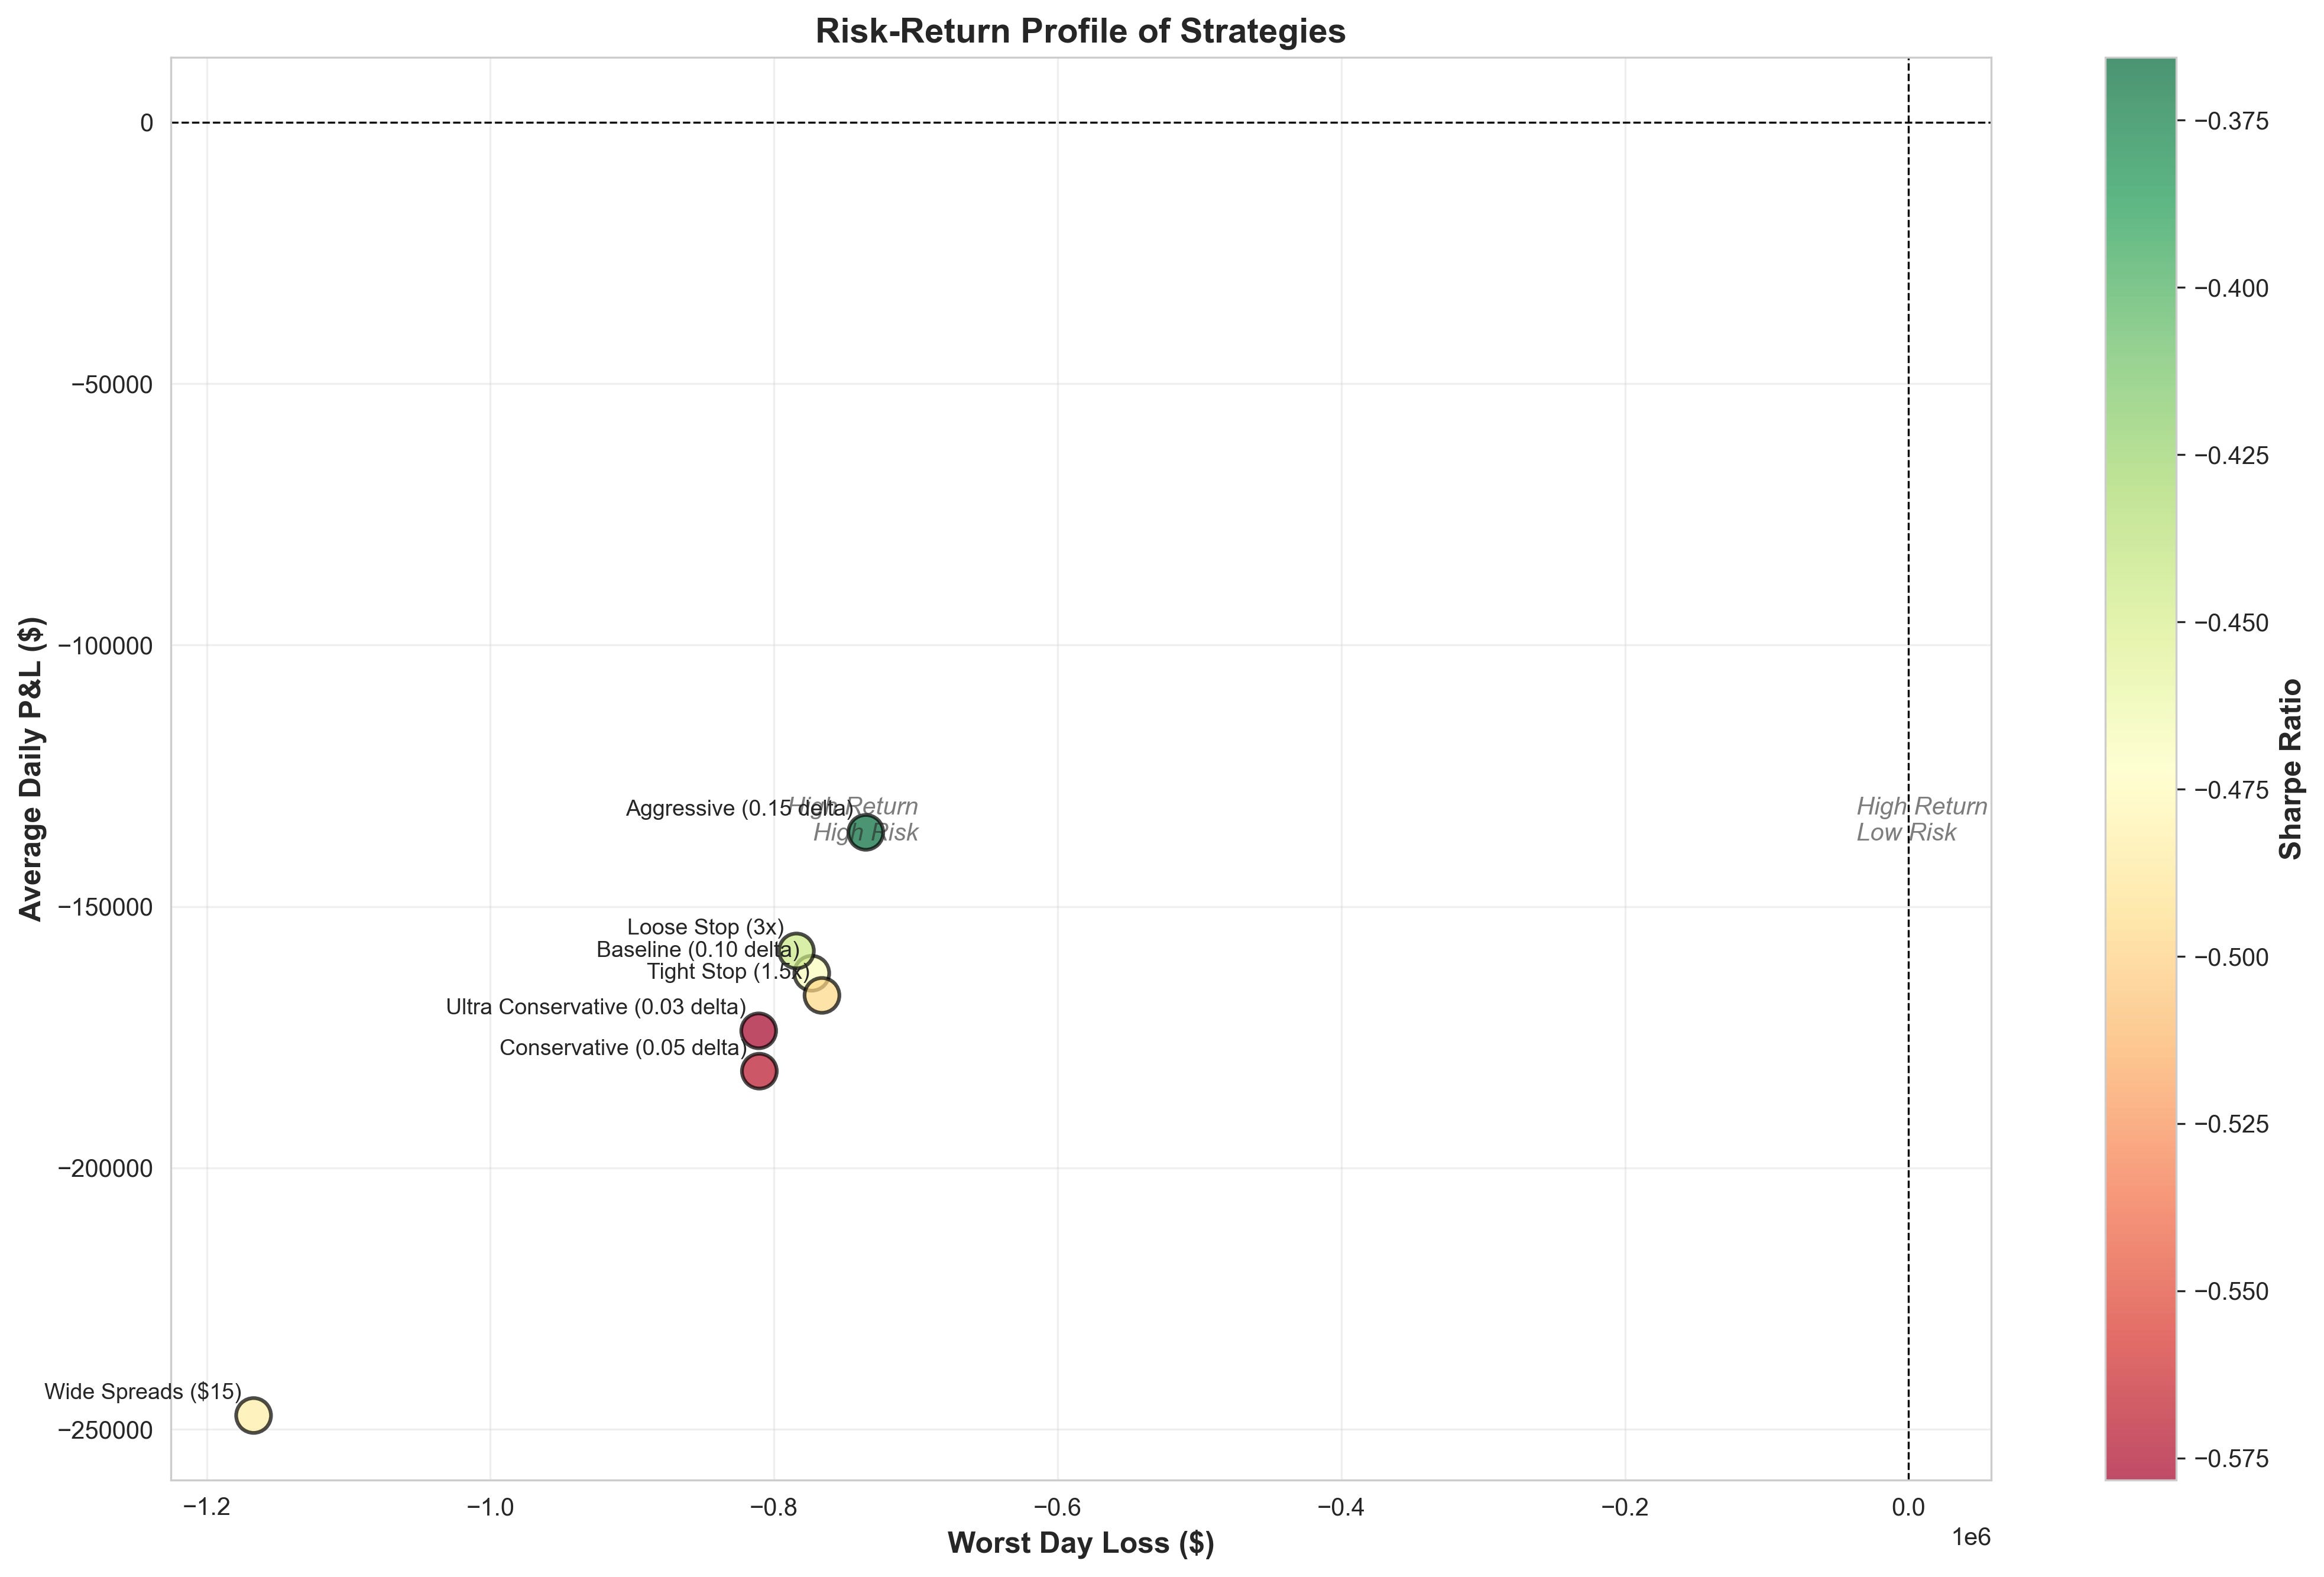
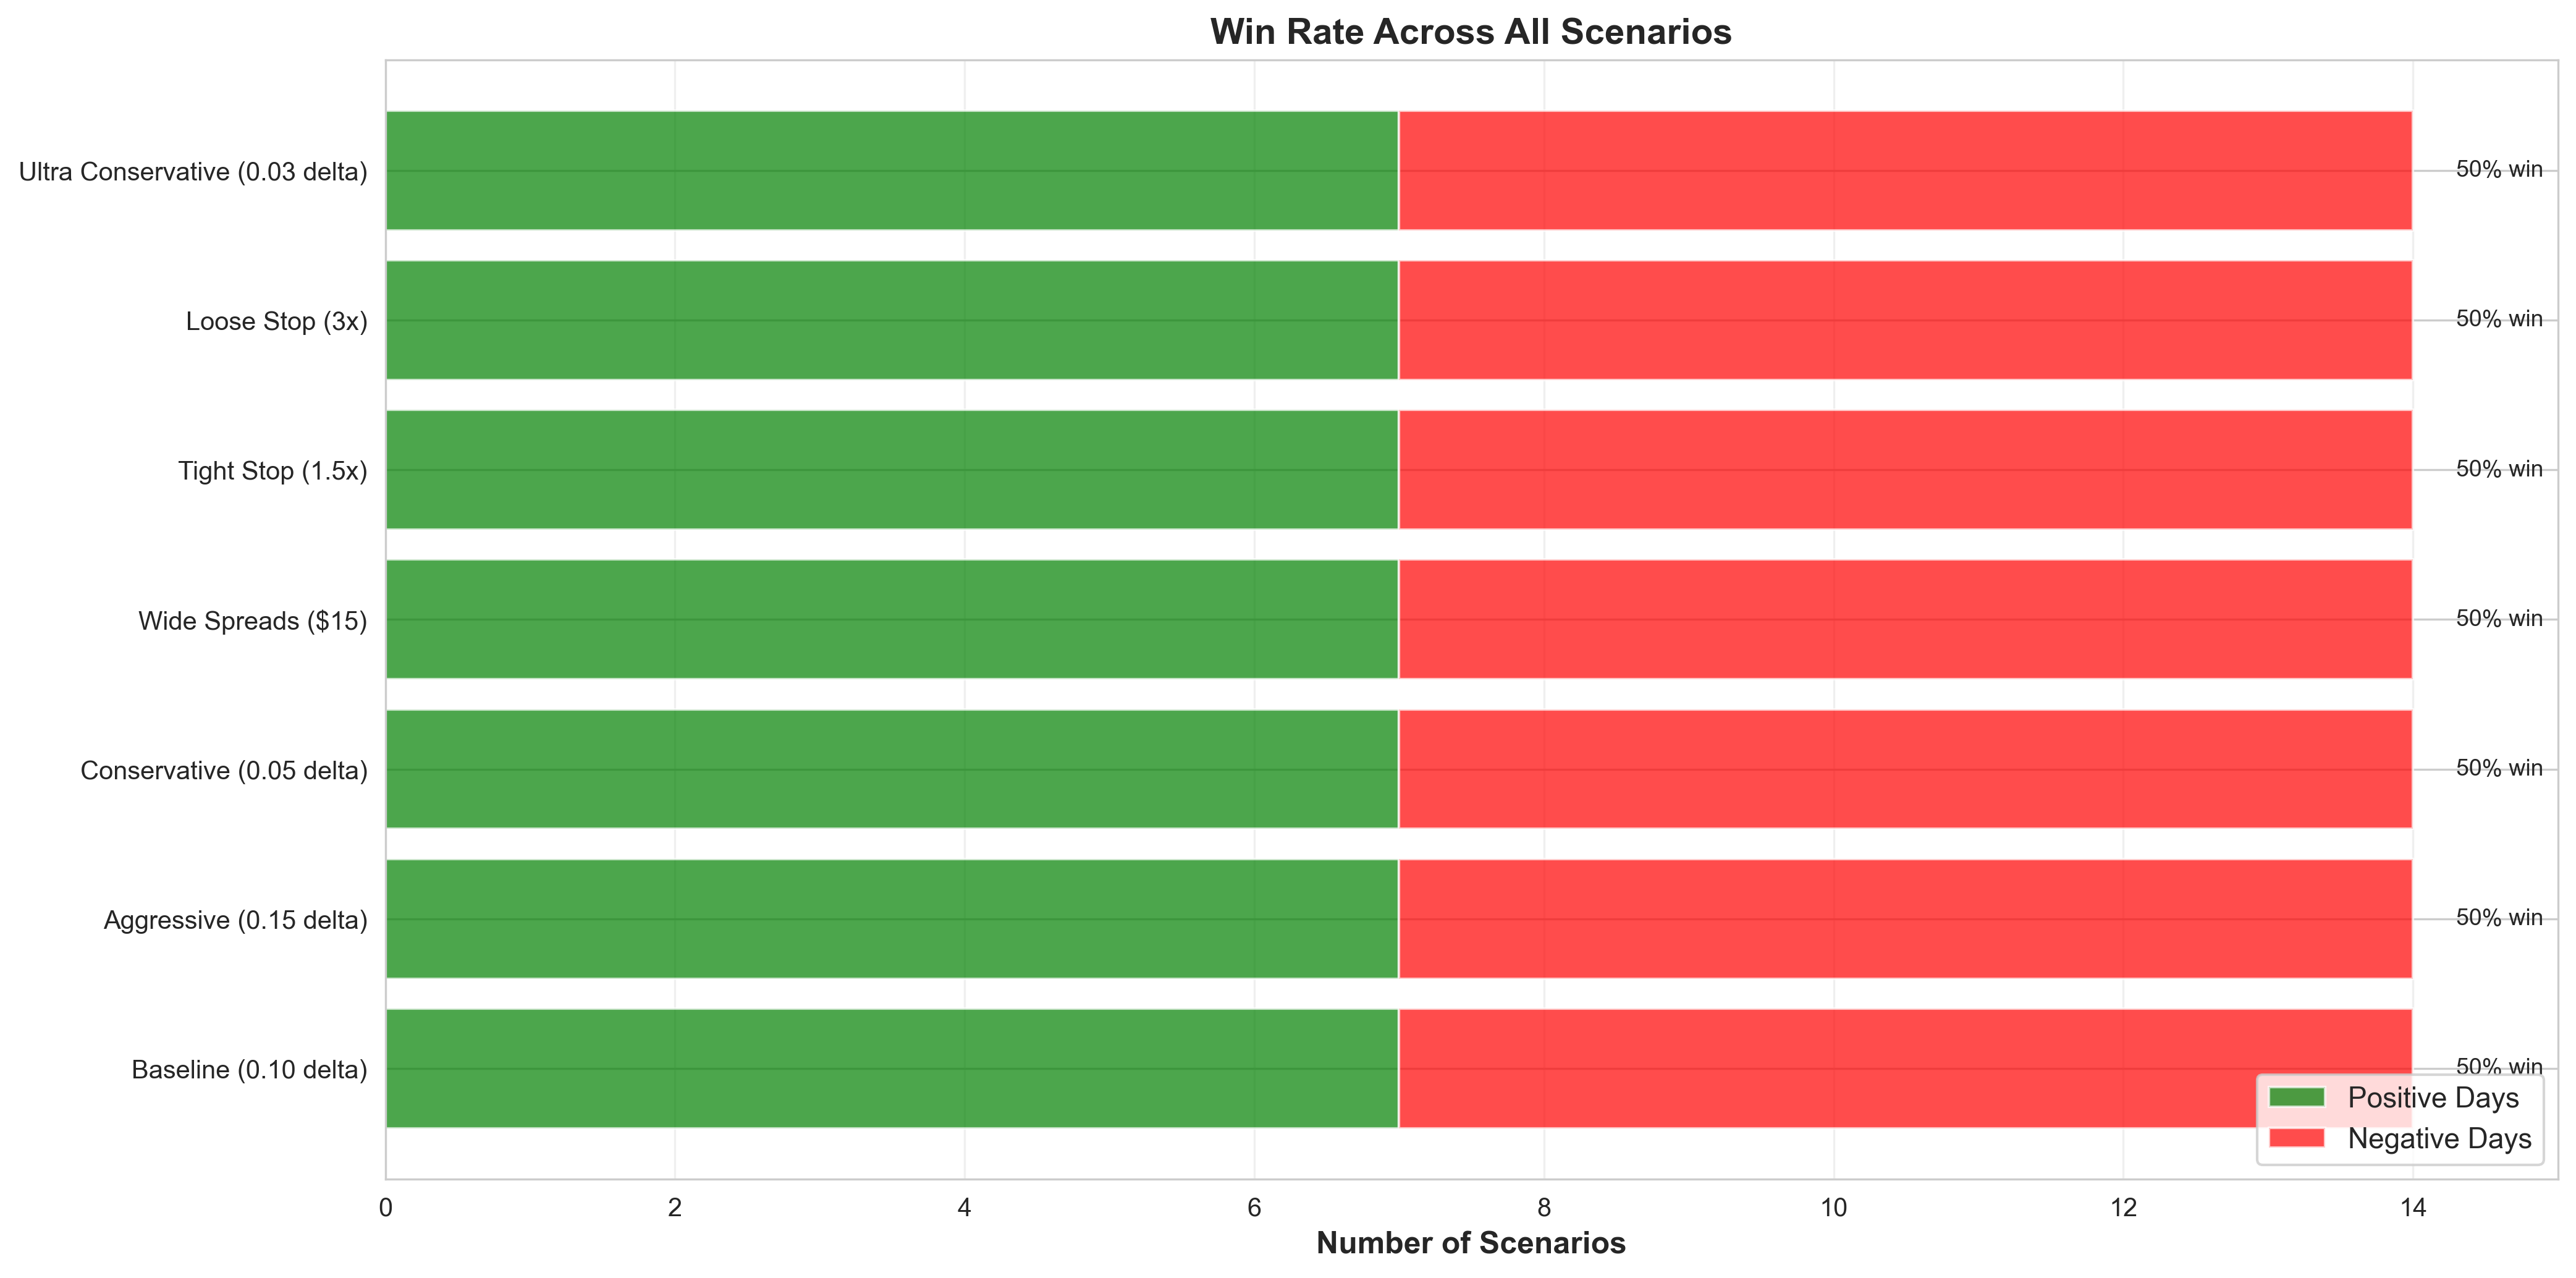
Net Result Across All 14 Scenarios:
Every strategy variant ended net negative. The “best” performer (aggressive) still showed a -0.37 Sharpe. At the scenario level, 7 of 14 scenarios produced losses (50%). At the trade level, win rate dropped from 86% in the initial 8-scenario test to 63% when extreme scenarios were included — and crucially, the losing trades were 4-5x larger than winners.
The Core Problem: Asymmetric Payoffs
This isn’t a bug — it’s the fundamental structure of short premium strategies. You’re accepting capped upside (the credit received) in exchange for magnified downside (spread width minus credit, multiplied by contracts, multiplied by gap risk).
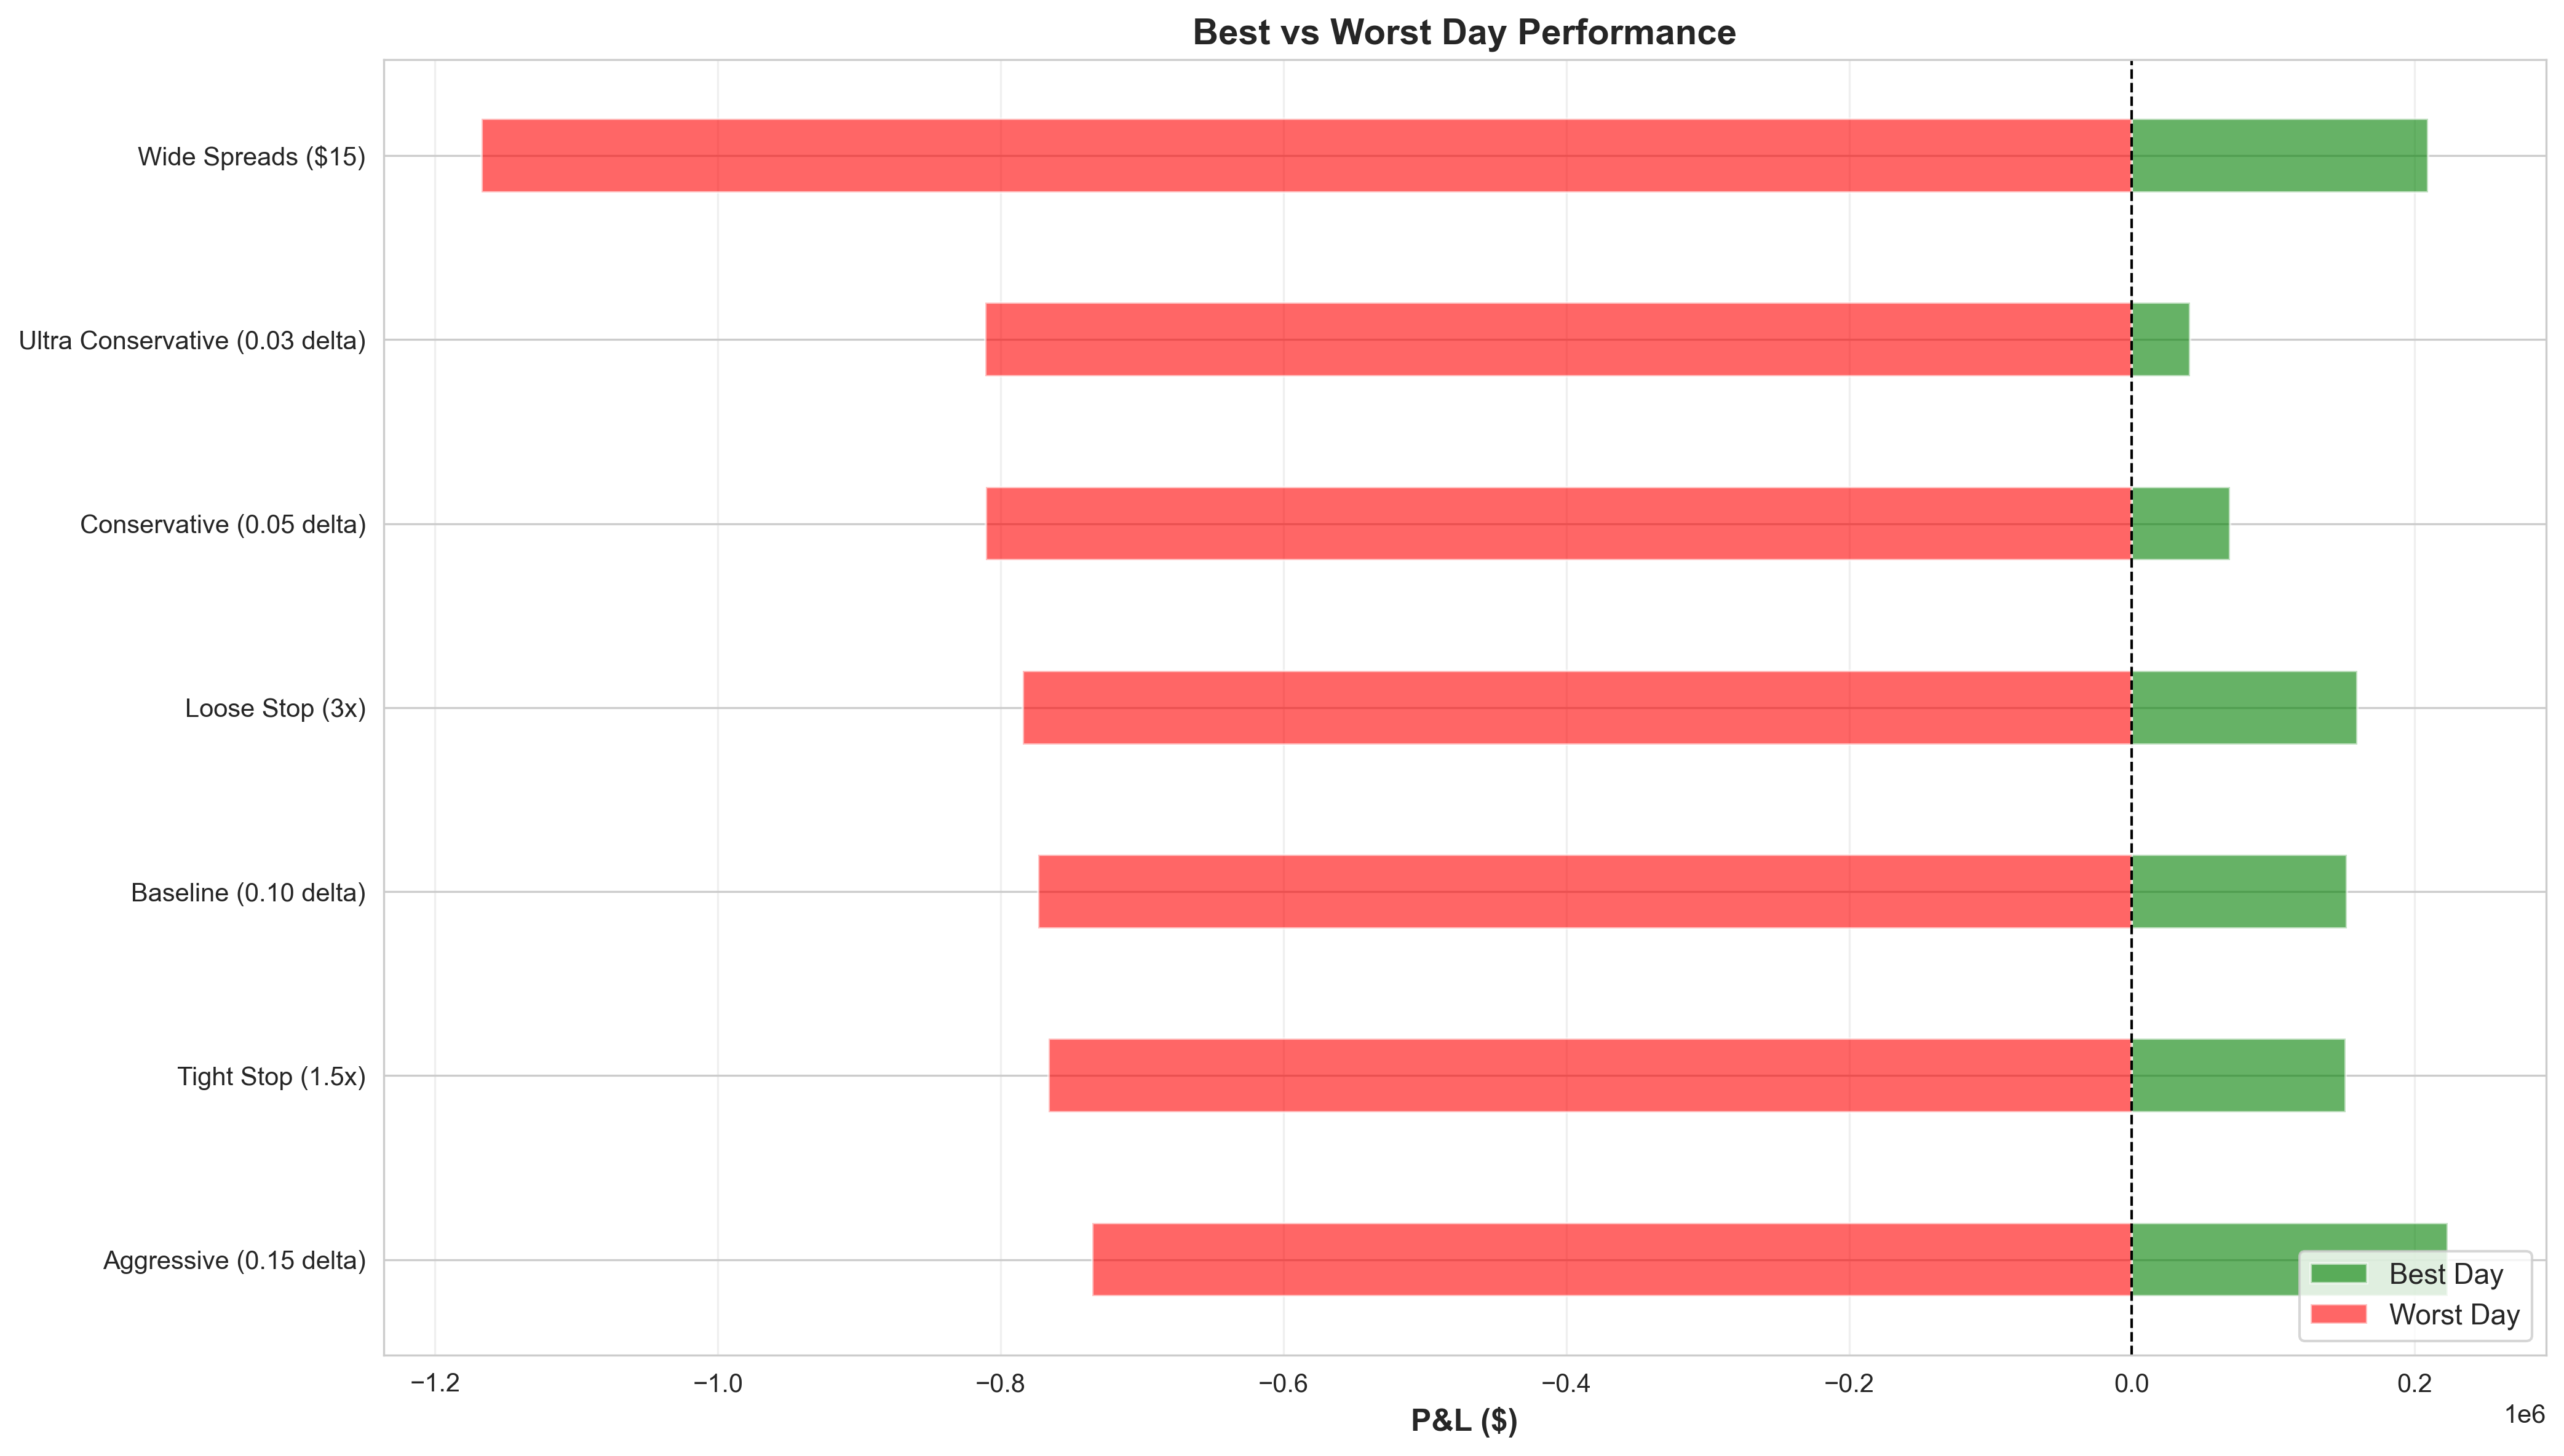
In a -$200 Black Monday scenario:
Credit collected: ~$150-200 per iron condor
Loss realized: ~$700-800 per iron condor
Ratio: 4-5x
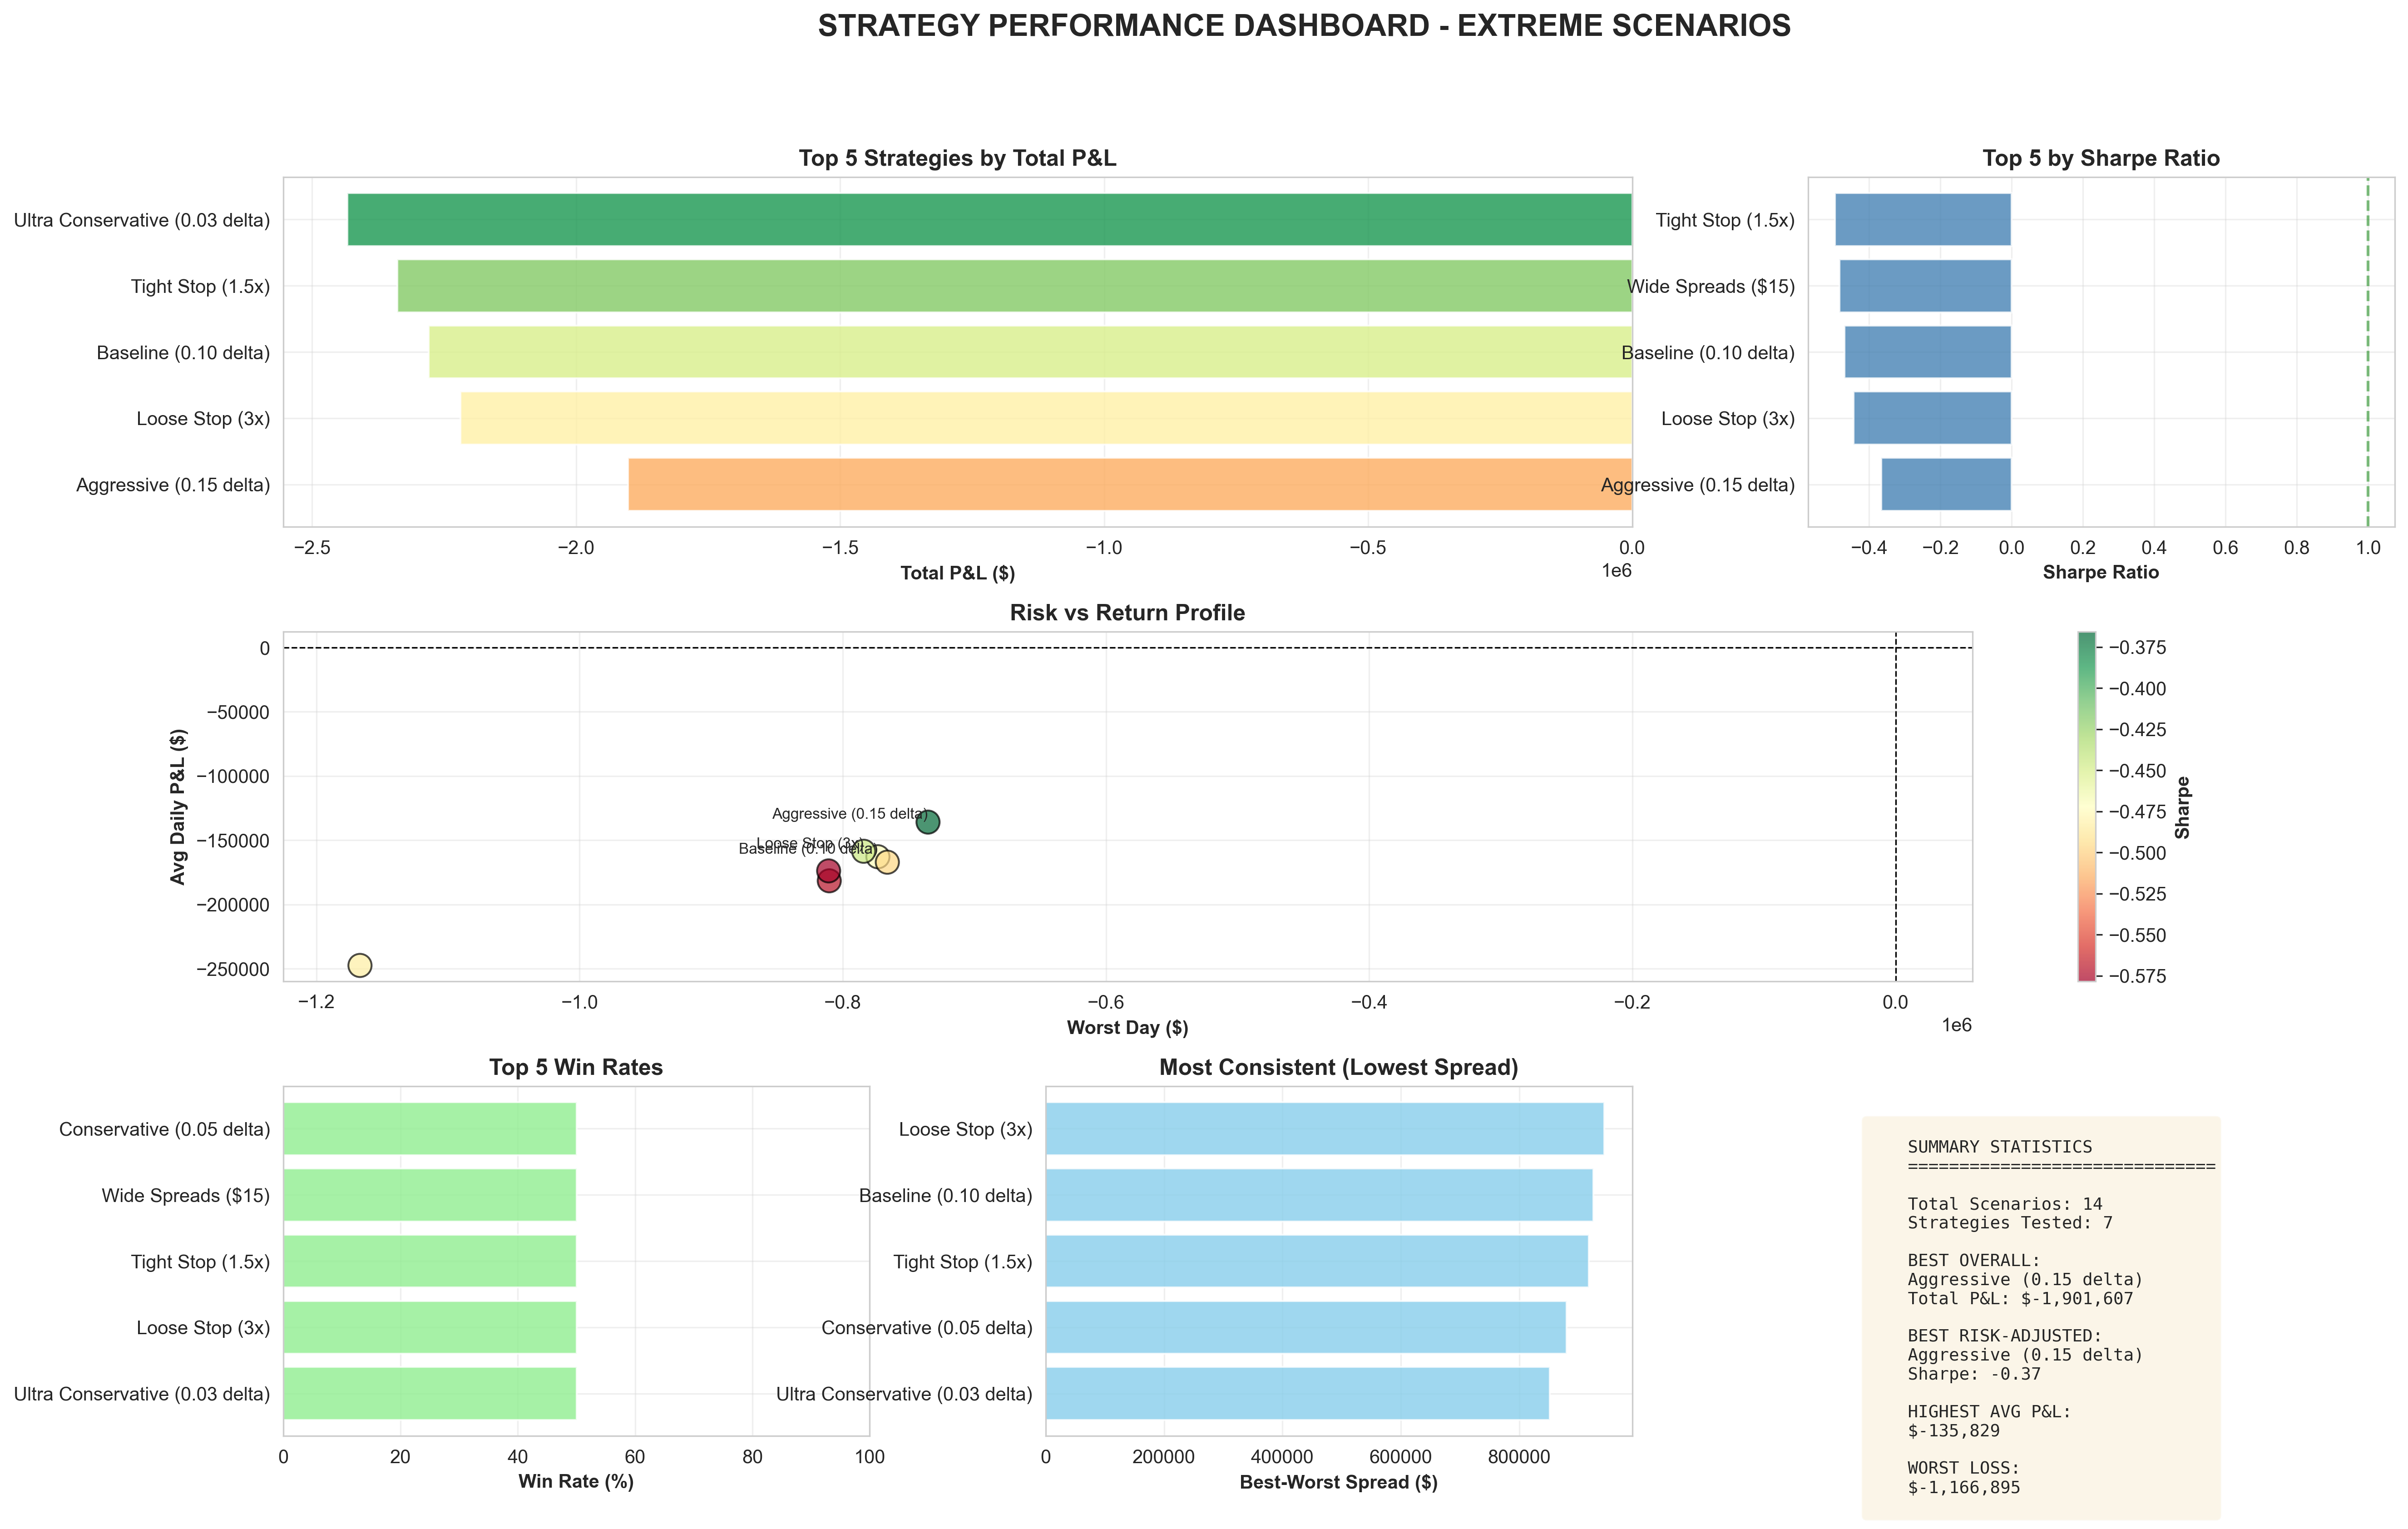
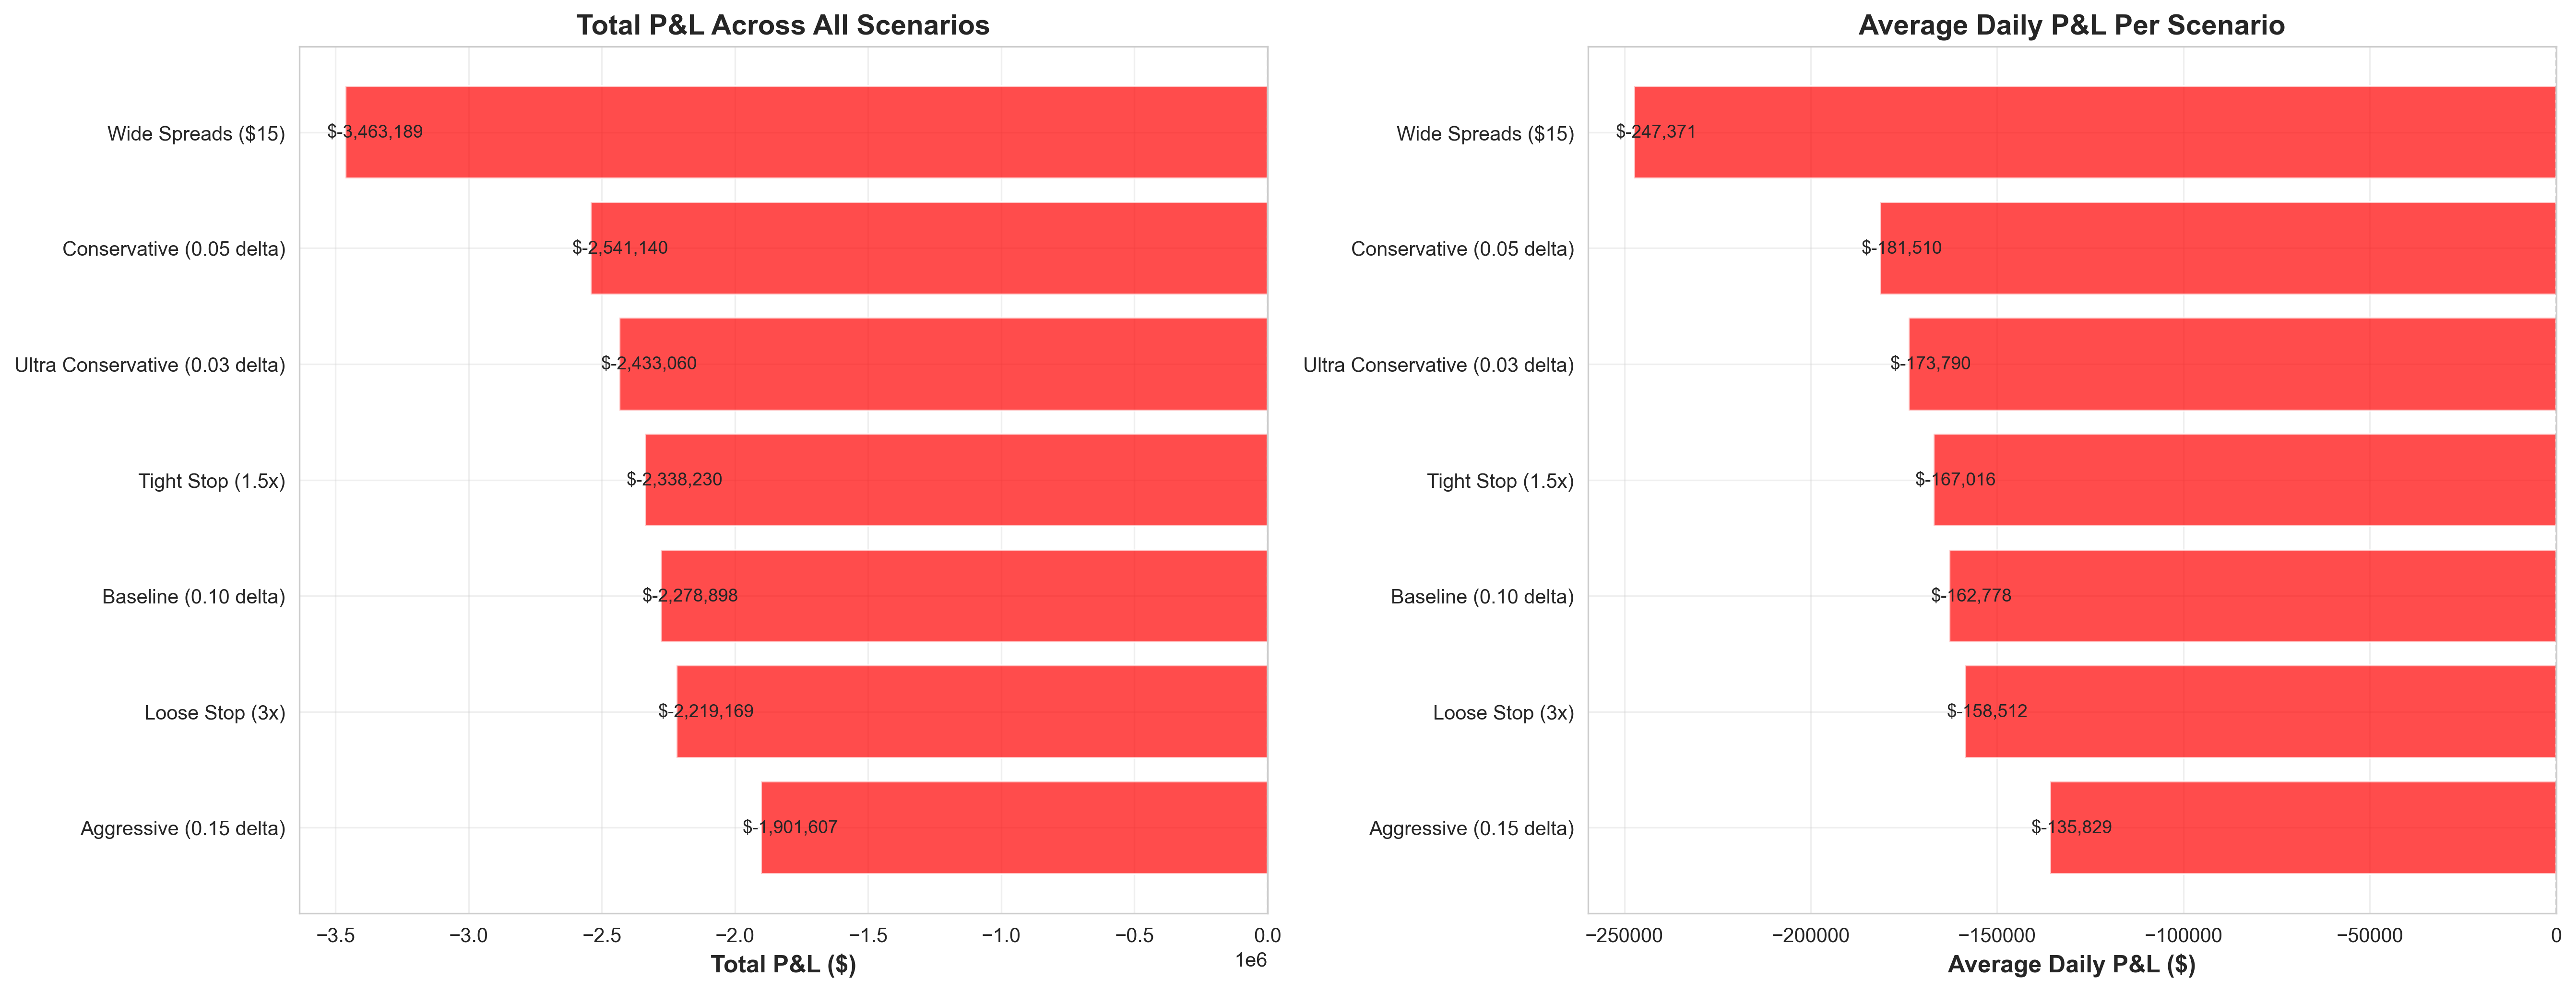
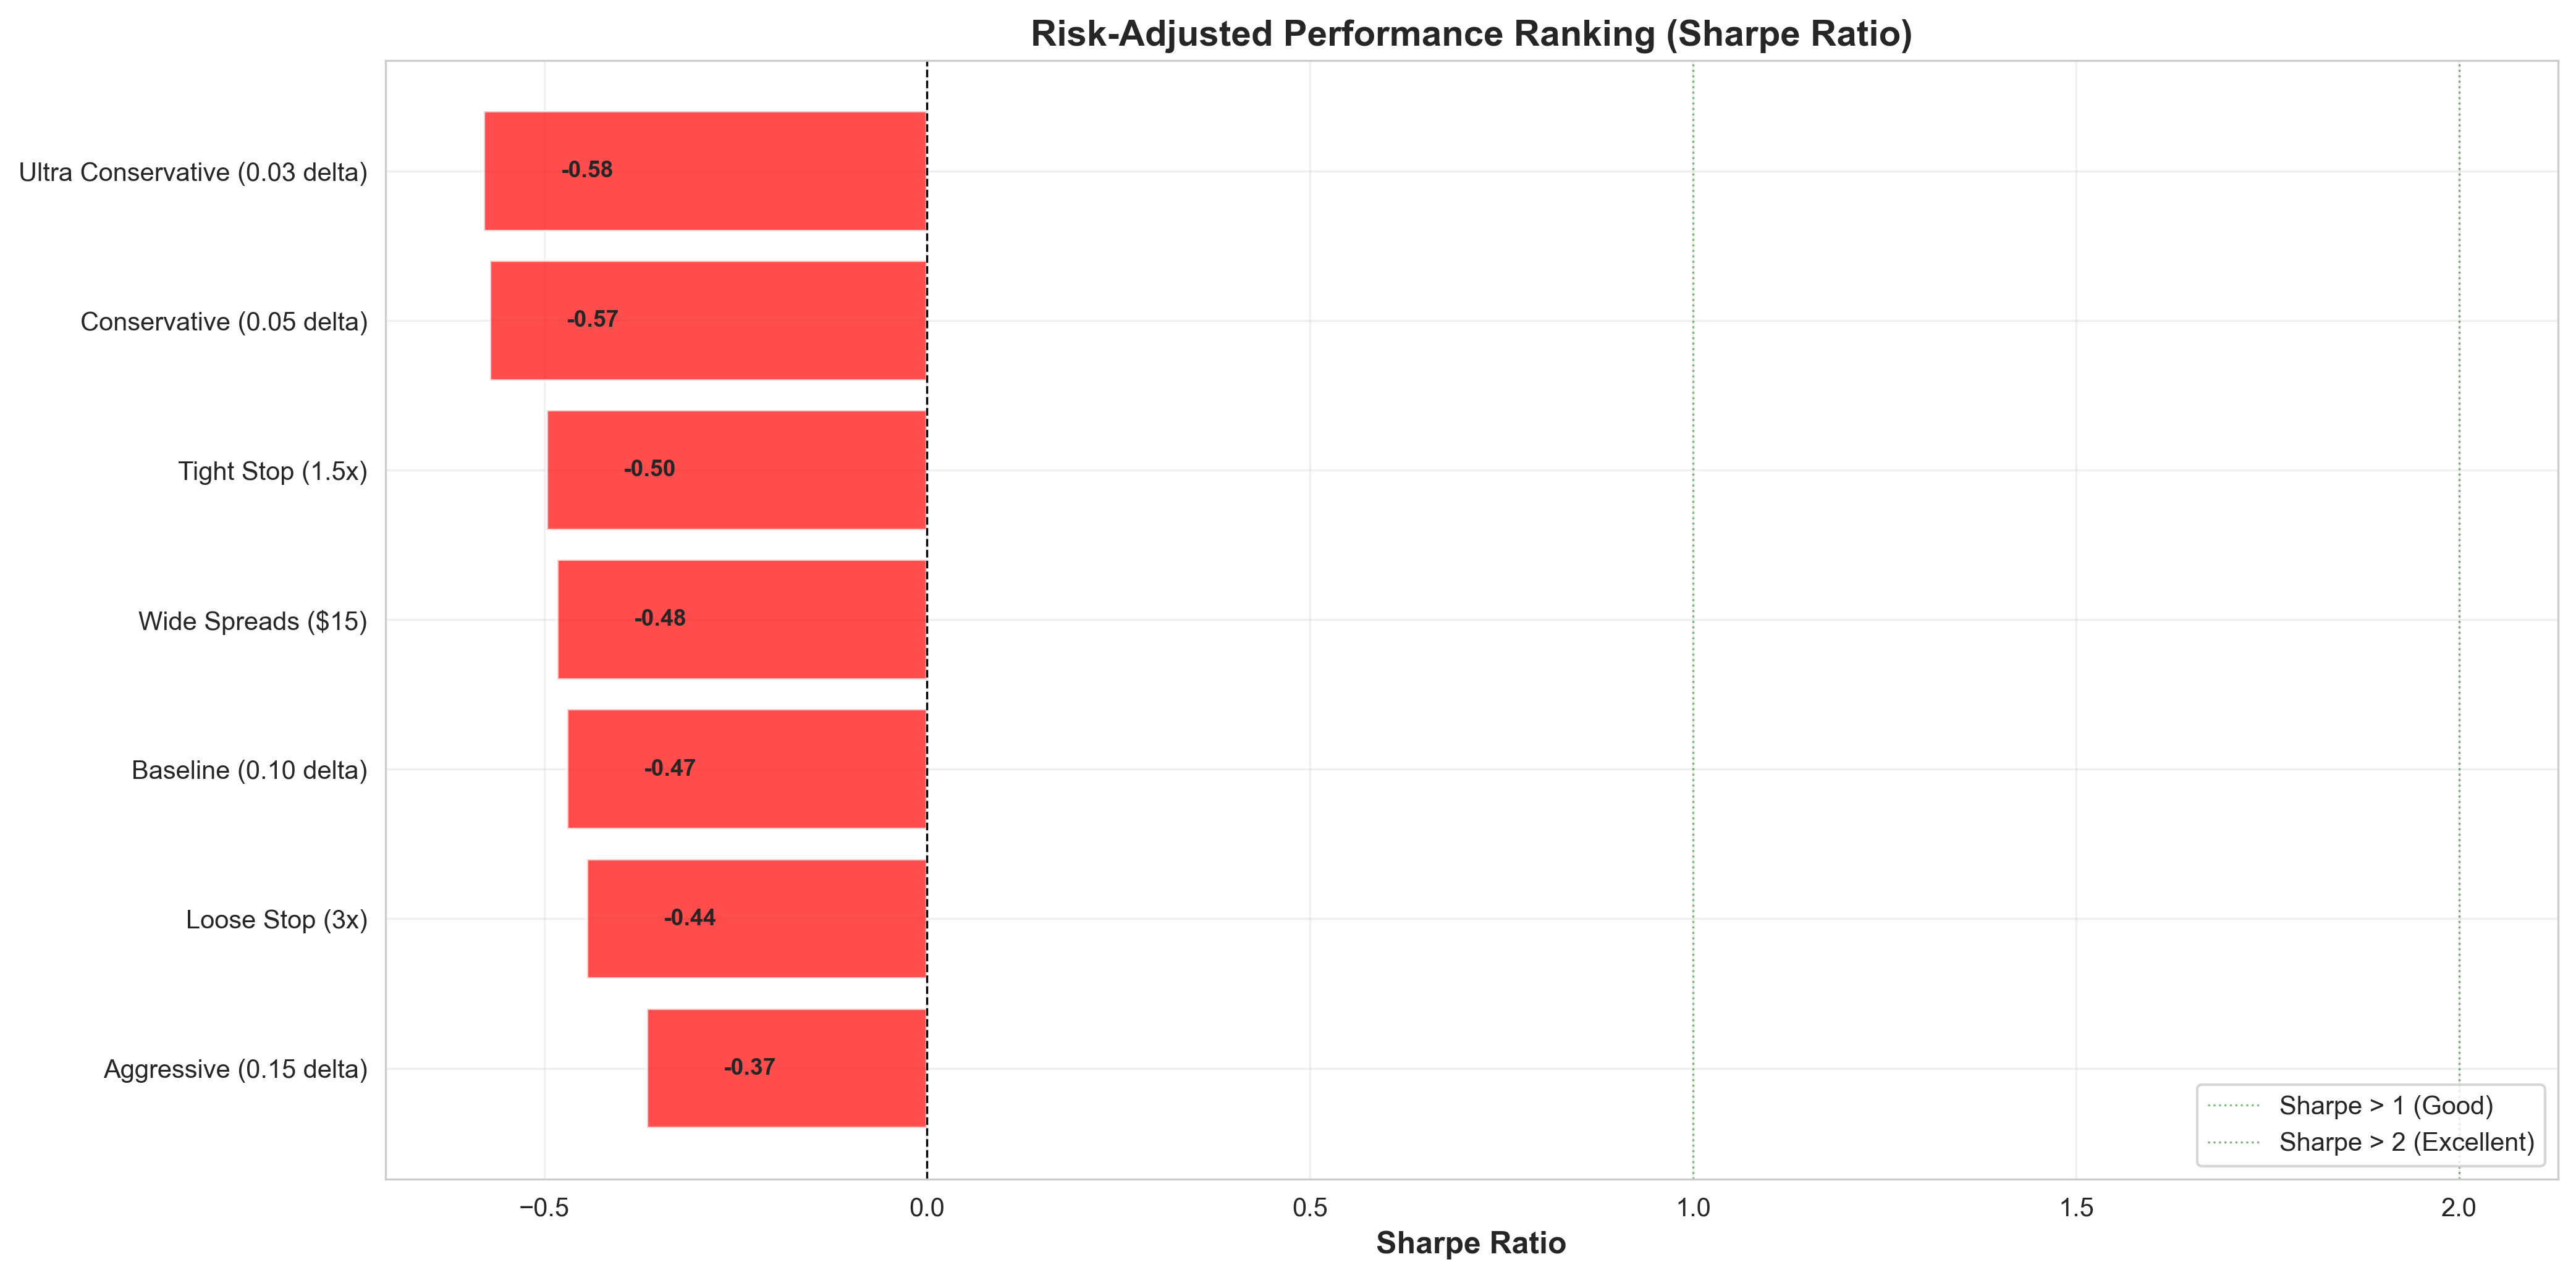
No amount of parameter tuning fixes this asymmetry. I tested seven configurations:
Strategy Total P&L (14 scenarios) Notes
───────────────────────────────────────────────────────────────────────
Aggressive (0.15Δ) -$1.90M Best of bad options
Loose Stop (3x) -$2.22M More premium, more pain
Baseline (0.10Δ) -$2.28M Middle of the road
Tight Stop (1.5x) -$2.34M Stopped out too often
Ultra Conservative (0.03Δ) -$2.43M Too little premium
Conservative (0.05Δ) -$2.54M Worst of both worlds
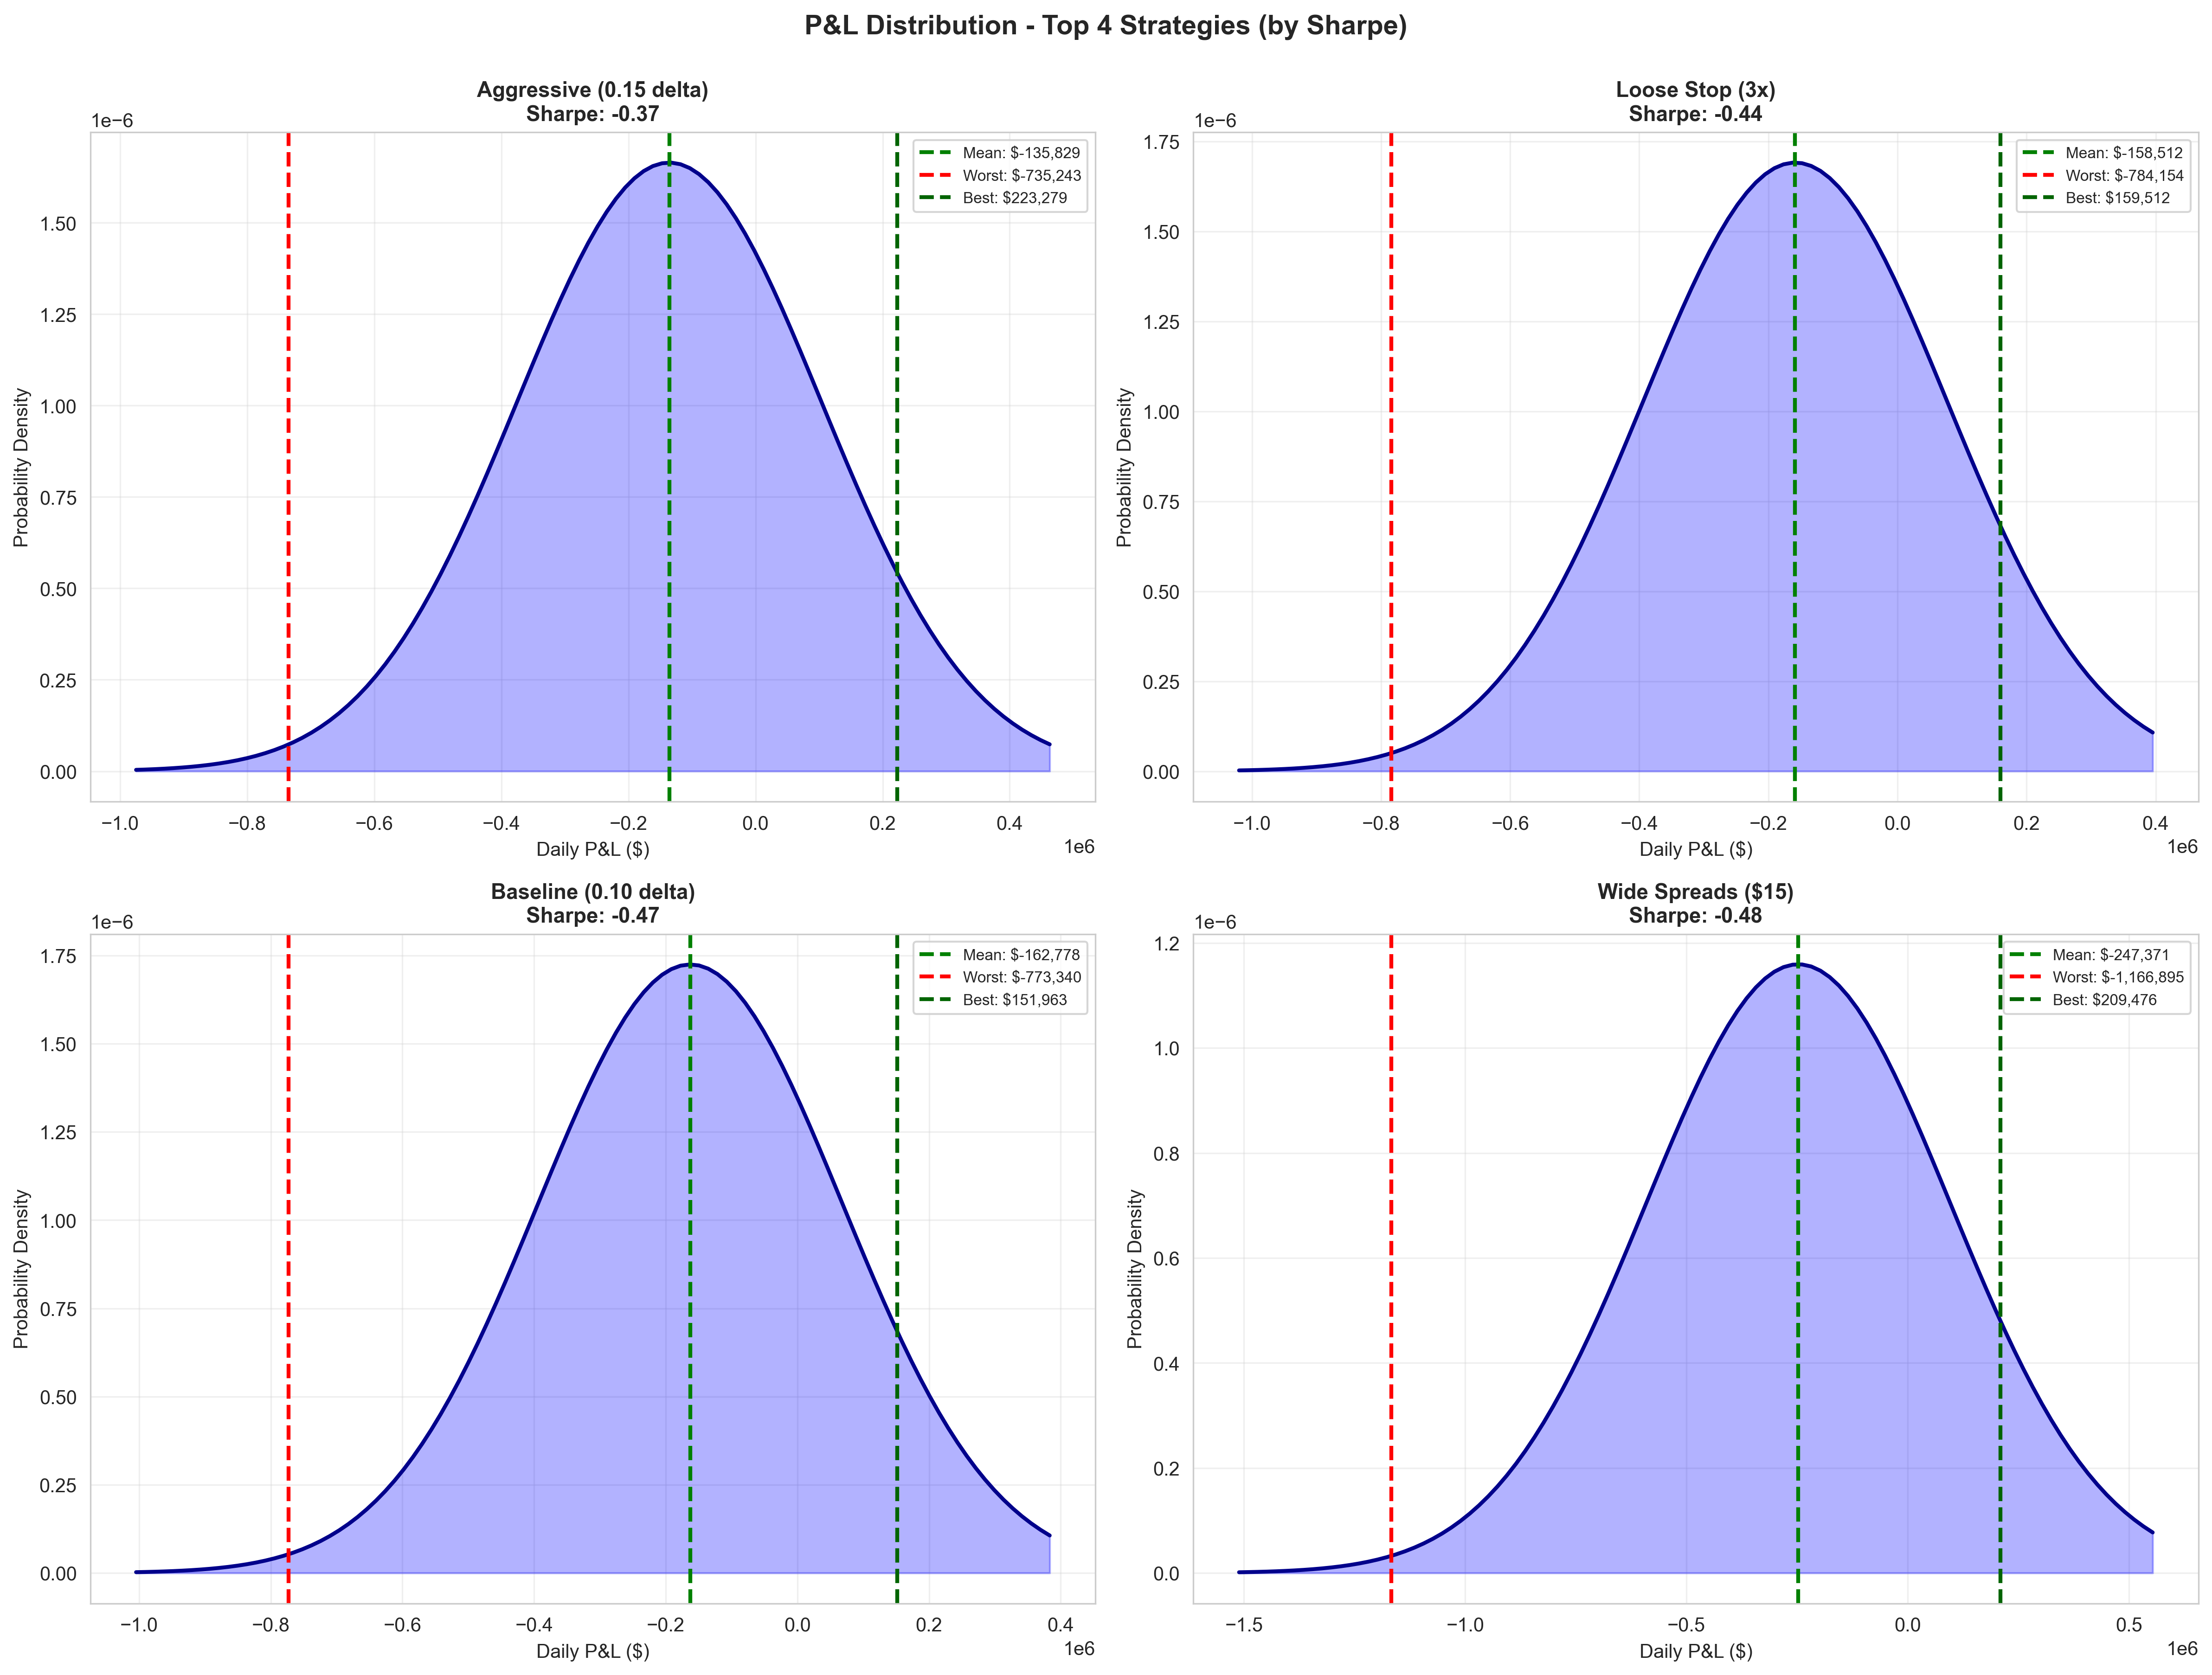
Wide Spreads ($15) -$3.46M Amplified lossesWide spreads were particularly brutal — the extra $5 of width turned a -$735k Black Monday loss into -$1.17M.
Next Steps: Monte Carlo and Regime Analysis
Before jumping to implementation changes, the priority is understanding the probability distribution of outcomes more rigorously. The 14-scenario stress test tells us what happens in specific conditions. Monte Carlo tells us how often and in what combinations.
Building the Monte Carlo Framework
The simulation needs to answer three questions:
1. What’s the true expected annual return?
Each trading day draws from a probability distribution of scenarios. The weights matter enormously. If Black Monday events occur once per decade versus once per year, the strategy’s expected value changes sign.
Historical calibration from 1990-2025 SPX data:
Days with |move| < 1%: ~75%
Days with |move| 1-2%: ~20%
Days with |move| 2-3%: ~4%
Days with |move| > 3%: ~1%
VIX regime frequencies:
VIX < 15: ~35% of days
VIX 15-25: ~45% of days
VIX 25-35: ~15% of days
VIX > 35: ~5% of days
The simulation runs 10,000 trials of 252 trading days each, sampling from these distributions with appropriate correlation structure (high VIX clusters with large moves).
2. What’s the probability of ruin?
Expected value alone is insufficient. A strategy with +5% expected annual return but 40% chance of -50% drawdown isn’t tradeable for most accounts.
Key outputs:
P(profitable year)
P(drawdown > 20%)
P(drawdown > 50%)
P(account ruin) at various time horizons
Distribution of terminal wealth after 1, 3, 5 years
3. How sensitive are results to scenario frequency assumptions?
This is where it gets interesting. Small changes in tail event frequency can flip the strategy from positive to negative expectancy.
Sensitivity analysis across:
Tail event frequency: ±50% from historical baseline
VIX spike correlation with large moves: 0.5 to 0.9
Recovery speed after crashes: immediate vs. sustained volatility
Clustering effects: isolated events vs. volatility regimes
Regime Gating Analysis
The hypothesis: if we only trade in favorable regimes, the math changes.
Test 1: VIX Threshold
Run the full Monte Carlo with a simple rule: no positions when VIX > X.
VIX Threshold    Trading Days    Expected Return    Sharpe    P(Profitable Year)
─────────────────────────────────────────────────────────────────────────────────
None                   252               ?             ?              ?
< 30                  ~240               ?             ?              ?
< 25                  ~215               ?             ?              ?
< 20                  ~175               ?             ?              ?
< 15                   ~90               ?             ?              ?
The trade-off is clear: tighter thresholds reduce tail risk but also reduce opportunity. Somewhere there’s an optimum.
Test 2: Momentum Filters
Skip trading on days following large moves (>1.5%). The assumption is that volatility clusters—a big move today increases probability of a big move tomorrow.
Test 3: Calendar Exclusions
Fed days, triple witching, major economic releases. These have known elevated volatility. Quantify the impact of sitting out.
Correlation Structure Deep Dive
The naive Monte Carlo assumes independent daily draws. Reality is messier. Volatility clusters. Crashes beget crashes. Recovery days cluster too.
Modeling approaches:
GARCH(1,1) for volatility persistence
Markov regime switching between calm/stressed states
Copula functions for tail dependency between VIX and SPX moves
Each produces different ruin probabilities. The conservative approach: use whichever model produces the worst outcomes, then verify the strategy still works.
Validation Against Historical Drawdowns
The ultimate sanity check: run the strategy through actual historical periods.
2008 Financial Crisis: Sep-Nov period
2010 Flash Crash: May 6
2015 China Devaluation: Aug 24
2018 Volmageddon: Feb 5
2020 Covid Crash: Feb-Mar
2022 Rate Shock: Jan-Jun
If the Monte Carlo says 5% probability of -50% drawdown but the strategy would have blown up in 3 of 6 historical stress periods, the model is wrong.
The goal is a clear answer… under what conditions (if any) does this strategy have positive expected value with acceptable ruin probability? If the answer is “none,” that’s useful information. If the answer is “VIX < 22, no Fed days, skip post-gap days,” that’s a tradeable edge.
What I’ve Learned
Short premium strategies have a seductive backtest profile in normal markets. The trade-level win rate is high, the income is steady, the equity curve looks smooth. But win rate is the wrong metric when your losers are 4-5x larger than your winners. A 63% win rate sounds fine until you realize the expected value is negative.
All it takes is a couple of big drawdowns to wipe out all your profits in one fell swoop.
The 14-scenario stress test revealed what happens at the tails—but a stress test isn’t a probability distribution. The real question isn’t “what happens in a Black Monday?” It’s “what’s the expected value when Black Mondays happen with X frequency?” That’s a Monte Carlo question, and it requires careful calibration of scenario weights against historical data.
The Two-Engine architecture was always about systematic decision-making. The next phase applies that same rigor to the statistical foundation: understanding the full probability distribution of outcomes before committing capital.
Next part: Monte Carlo engine build and baseline simulation results.
Technical files:
EXTREME_SCENARIO_FINDINGS.md— Complete stress test methodology and resultsBACKTEST_RESULTS_COMPARISON.md— Delta targeting validation
Remember: Alpha is never guaranteed. And the backtest is a liar until proven otherwise.
These posts are about methodology, not recommendations. Some of the approaches discussed here involve complex instruments (e.g., options and derivatives) and not suitable for all investors. Many of my analyses probably contain errors — if you find them, please let me know.
While I may hold positions in some of the underlying assets discussed here, my posts are not an endorsement or a recommendation of those underlying assets.
The material presented in Math & Markets is for informational purposes only. It does not constitute investment or financial advice.
Thank you for sharing these 3 pieces, it's an interesting strategy, may I ask for some clarification? In the original video the guy buys tails so far out he might as well be short naked strangles, but in your first article you use a pretty tight iron condor with the long end only 10 strikes away. So in this scenario, are the 15 delta strangles (which perform best in normal circumstances) hedged similarly, with close strikes, or using the far tails, or just naked?
In ur historical drawdown list , any reason u left out “Liberation day” from last year ?