

This is Post 2 of the 0DTE Autopsy arc. Post 1 covered the FOMC trade. Yesterday’s postmortem showed the mechanism was real — it just showed up 24 hours after the contract expired. Which raises the obvious question: if the extra day of theta was what killed the FOMC call, does buying a 1DTE instead of a 0DTE fix it for earnings?
Before I get into the numbers, one story from chess history.
Keres vs. Botvinnik, 1948
In April 1948, at the Hall of Columns in Moscow, Mikhail Botvinnik was three rounds from winning the world championship. Paul Keres — the great Estonian, the pre-war favorite, the man most historians think should have been champion in 1938 — sat across from him with the black pieces. Keres had already lost three games to Botvinnik in the match. He needed to win this one to keep his chances alive, and everyone in the hall knew it.
He played the French Defense. He’d been playing the French his whole career, but on this day he took an active variation he rarely used against a Botvinnik who was known for his dogged preparation when it came to openings. Botvinnik won in 25 moves. The story that followed the match around for decades was that Keres had been ordered by Soviet officials to lose so a Russian could take the title. Yuri Averbakh, who was there, always insisted that was nonsense. Keres just played badly under pressure and reached for a more complicated weapon than the position called for.
Buying an ATM NVDA earnings call, seeing it die, and then buying the 1DTE version next time to give the trade “more room to work” is the same thing. It looks like a fix but it really isn’t. It is the same losing structure, only you pay a higher premium.
The Setup
I ran the numbers on every NVDA earnings print since Feb 2023. Fourteen events. Here’s what the data says: the 1DTE is worse. Not marginally worse — structurally worse. It loses more often, it goes to zero more often, and there is not a single event in the sample where holding the extra day rescued a 0DTE loss.
NVDA reports Wednesday after the close. This is the trade retail is setting up right now, and it’s the wrong trade.
BLUF In ~200 Words
NVDA prints Q2 FY2027 on Wednesday August 26 AMC. Consensus is around $91.9B revenue and $2.08 EPS. NVDA has beaten in each of the last seven quarters, and UBS is calling for a possible $3-4B revenue beat with a raise on top of it.
None of that matters as much as retail thinks it does.
I simulated buying an ATM call at Wednesday’s 4pm close on every after-close NVDA earnings print from Feb 2023 through May 2026. Holding to Thursday’s close gives you the 0DTE. Holding to Friday’s close gives you the 1DTE. Fourteen events.
The 0DTE hit rate is 35.7%. The 1DTE hit rate is 28.6%. The 0DTE goes to zero six times. The 1DTE goes to zero eight times. And the number of events where the 1DTE turned a 0DTE loss into a profit is zero.
The extra day doesn’t rescue the trade. It just gives you more time to lose the premium.
The Two Trades, Side by Side
Setup is the same as the FOMC series: buy an ATM call at Wednesday’s 4pm close, hold either to Thursday’s close (0DTE) or Friday’s close (1DTE). Strike rounded to the nearest $5. Entry IV pegged at 110% for the 0DTE and 90% for the 1DTE — those are proxies, not chain reconstructions, and they only affect entry cost. Expiry value is intrinsic at the terminal close. The whole point of the exercise is the comparison, not the absolute return level.
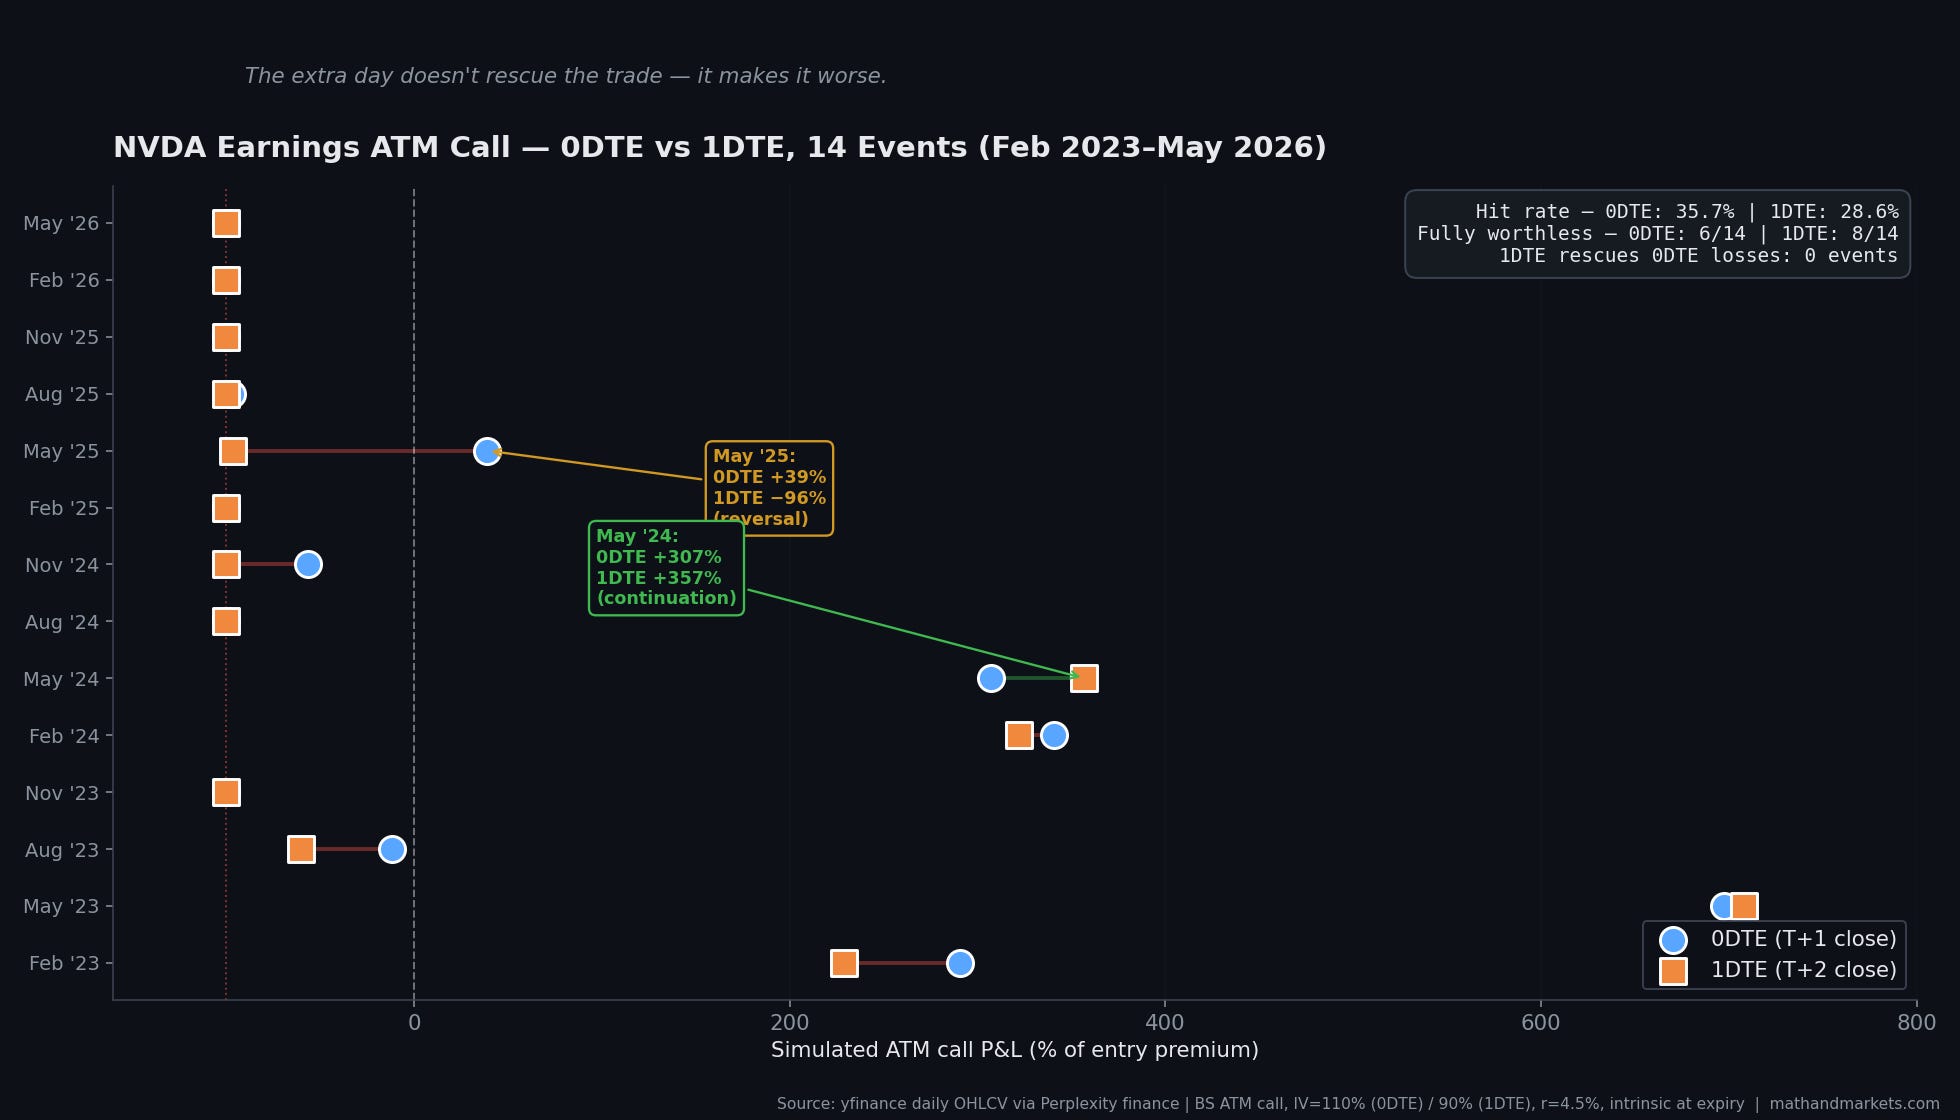
Earnings Dumbbell: 0DTE vs 1DTE P&L across all 14 events. Blue dots are the 0DTE, orange dots are the 1DTE, connected by a line so you can see which structure won each event. The 1DTE dot is lower than the 0DTE dot on the majority of events — including the May 2025 event where the extra day turned a +39% win into a −96% loss.
Every metric that matters is worse for the 1DTE.
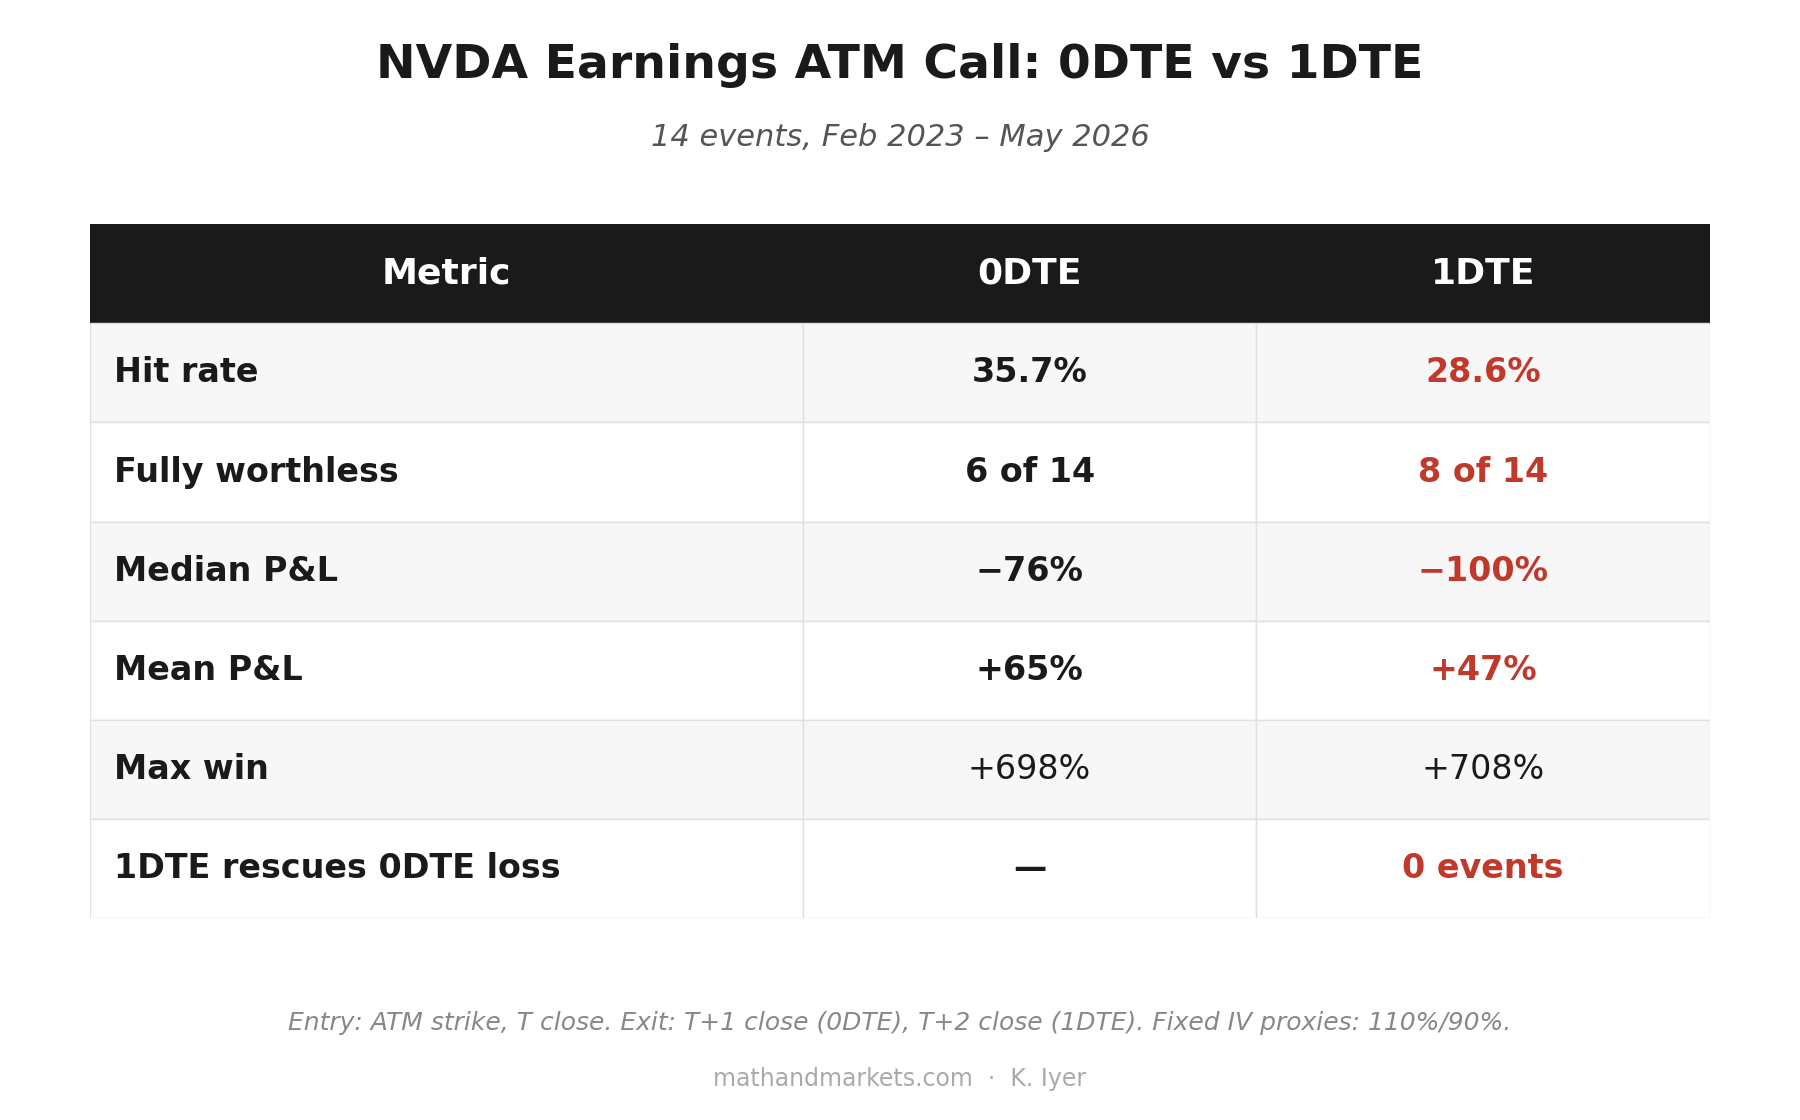
The mean is positive on both because four tail events carry the average.
Feb 2023, May 2023, Feb 2024, May 2024 — those four prints put up returns of +290%, +698%, +341%, and +307% on the 0DTE. Strip them out and the remaining ten events have a mean 0DTE return of −72% and a mean 1DTE return of −96%. The median tells you what the typical trade actually does, and on the 1DTE it’s a full write-off.
Why the Extra Day Doesn’t Save You
The intuition behind the 1DTE fix is the same intuition you saw in yesterday’s FOMC postmortem — the mechanism showed up a day late, so buy a day more. It sounds reasonable and it doesn’t survive the data.
Once an ATM earnings call goes to expiry, only intrinsic value matters. The entry IV, the vega you paid for, the theta profile — none of it shows up in the payoff. What matters is whether NVDA closes above the strike on the day you exit. For the 0DTE that’s Thursday. For the 1DTE that’s Friday.
So the 1DTE only helps if NVDA’s Friday close is meaningfully higher than its Thursday close, on days when Thursday closed just below the strike. In the fourteen-event sample, that specific pattern never happens.
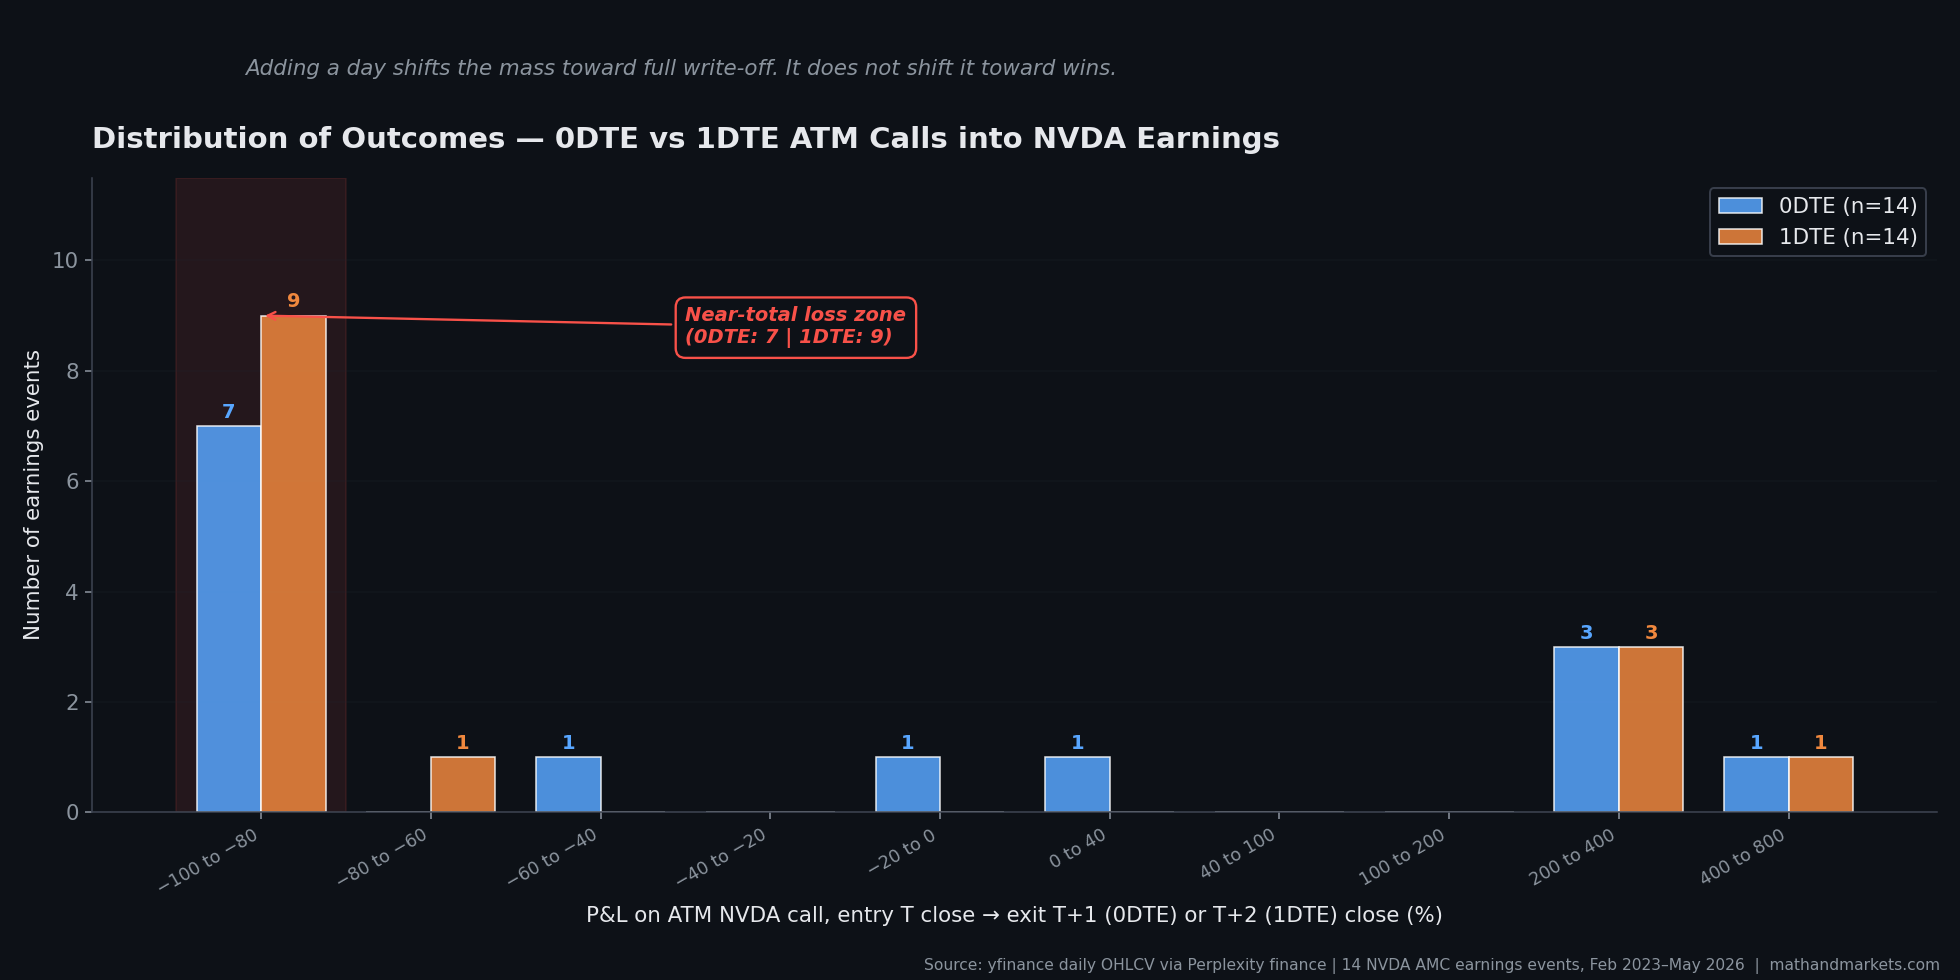
Distribution of P&L outcomes for both structures, overlaid. Blue bars are 0DTE, orange bars are 1DTE. The 1DTE has more mass in the full-loss bin and less mass in the small-win bins. Both structures have roughly the same tail of large winners.
Here’s what actually happens instead. On six of the fourteen events, the 0DTE goes to zero because NVDA was below the strike on Thursday, and on those same six events the 1DTE also goes to zero because NVDA was still below the strike on Friday. On two additional events — Nov 2024 and Aug 2025 — the 0DTE ended in a partial loss (−56% and −97%) while the 1DTE went fully to zero because Friday’s close was lower than Thursday’s. That’s where the extra worthless count comes from.
And on one event — May 28, 2025 — the extra day was catastrophic. NVDA gapped up 3.3% on Thursday, which put the 0DTE call at +39%. By Friday’s close, the stock had given back the gap and finished slightly below the strike, so the 1DTE finished at −96%. Same entry, same strike, one more day, and the trade goes from a modest winner to a near-complete loss. That is the reversal risk baked into the structure.
There’s exactly one event in the sample where the extra day helped: May 22, 2024. NVDA gapped up 9.3% on Thursday and kept climbing to +12.1% by Friday. The 1DTE returned 357% against the 0DTE’s 307%. That’s what the “give the trade room to work” thesis looks like when it actually works — and it’s one event out of fourteen, on a day when the 0DTE was already paying you a triple. The 1DTE only beats the 0DTE when the 0DTE was already deep in the money.
The Beat Doesn’t Save You Either
The other thing retail believes about NVDA earnings is that the beat is the trade. NVDA beats, stock rips, call pays. Seven consecutive quarters of beats. UBS is looking for a beat-and-raise on Wednesday, possibly $3-4B above the guide.
The data does not support the intuition.
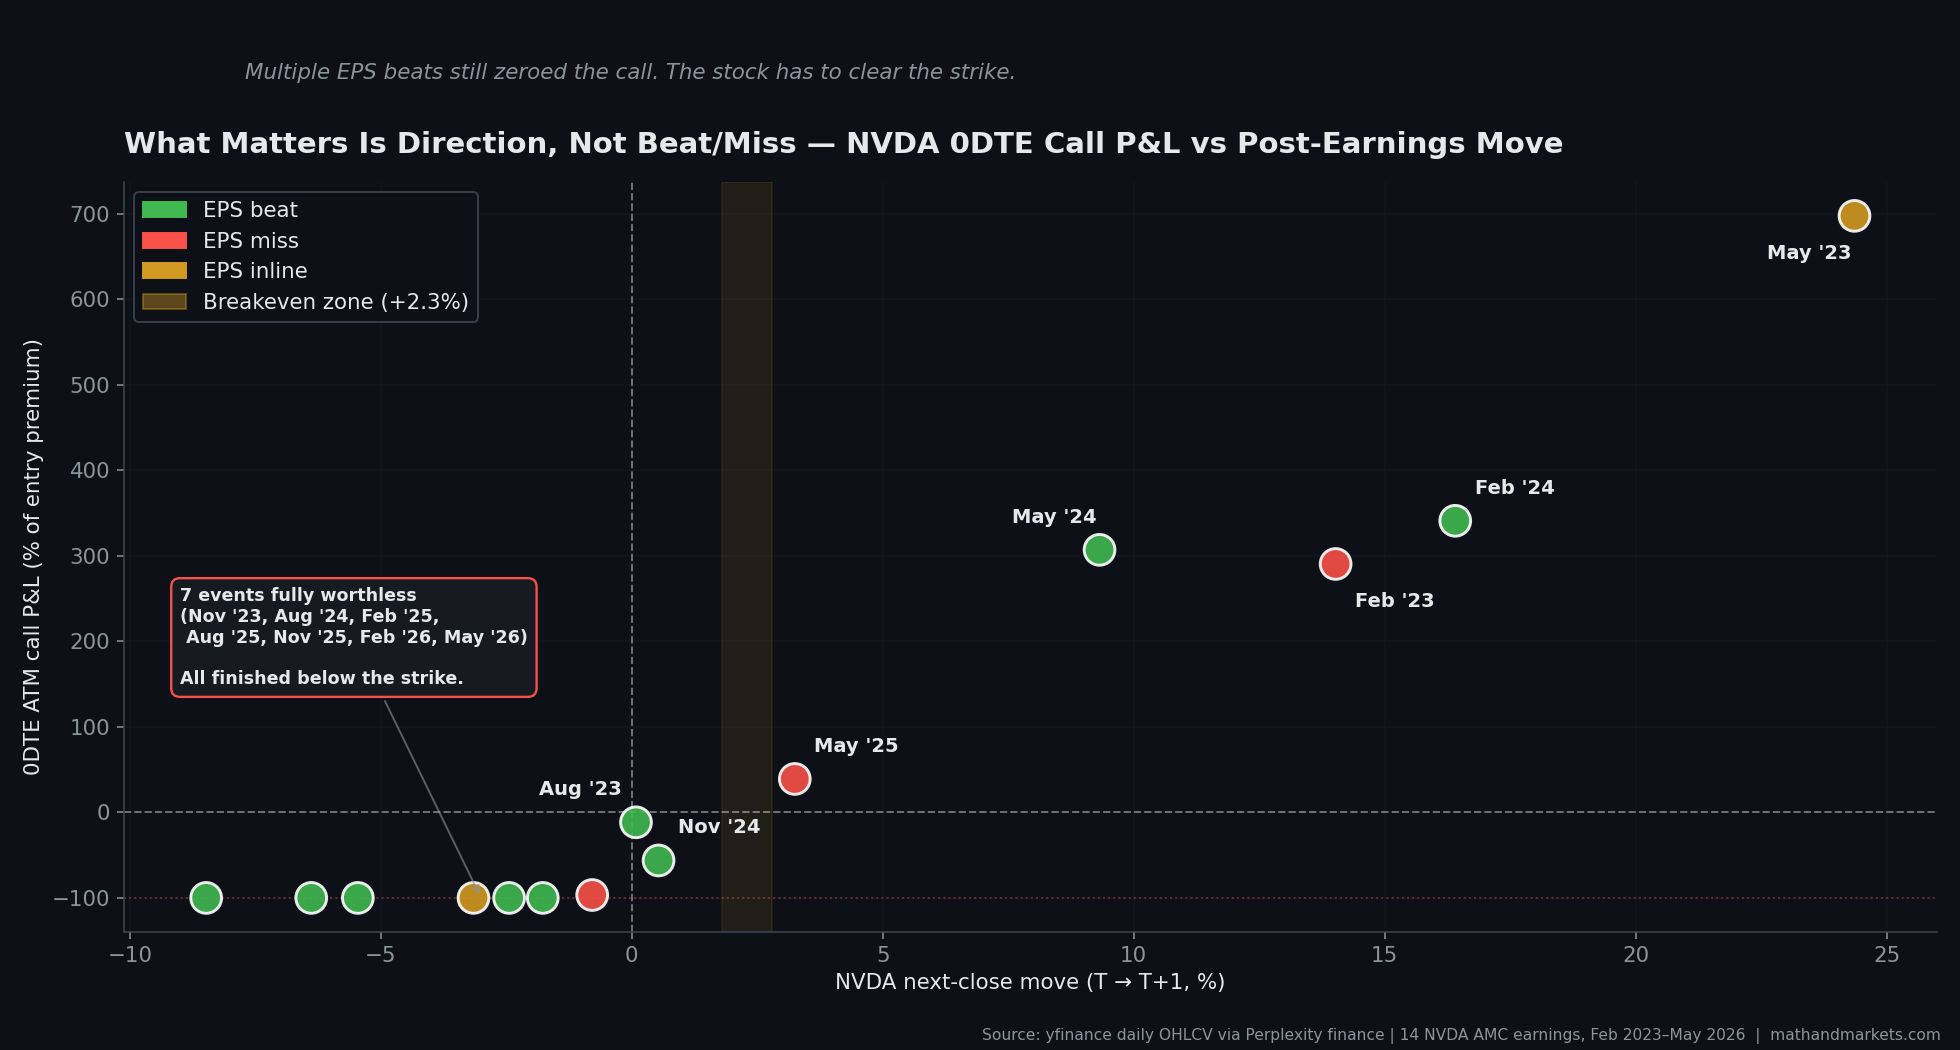
Chart: 0DTE P&L on the y-axis vs Thursday’s post-earnings move on the x-axis, with dots colored by beat/miss/inline. The green cluster (beats) is scattered across the full P&L range from −100% to +341%. The red dots (misses) include the +290% Feb 2023 outcome. Direction, not surprise sign, is what determines the payoff.
Of the fourteen events, nine were EPS beats, three were misses, and two were inline. Of those nine beats, five went to a full write-off on the 0DTE — Nov 2023, Aug 2024, Feb 2025, Feb 2026, and May 2026. The Feb 2026 print is the one to sit with: NVDA beat consensus EPS by roughly 24%, which is the kind of blowout that retail assumes has to produce a call payoff, and the stock closed down 5.5% the next day because the guide disappointed. The ATM 0DTE went to zero. On the other side, Feb 2023 was an EPS miss and it produced a +290% return because the guide was so strong the stock ripped 14% anyway.
What matters is whether the stock clears the strike on the day the option expires. Not whether the EPS number was above consensus. The rough breakeven for an ATM 0DTE at these IV levels is a +2.3% move up. Below that, delta doesn’t outrun theta and you lose regardless of what happened on the print.
What Wednesday Looks Like Under This Frame
NVDA closed Friday at $214.75. If Wednesday’s close is similar, you’re buying a $215 strike. Under the model conventions, the 0DTE premium is around $4.95 and the 1DTE premium is around $5.60. Breakeven at Thursday’s close is roughly $220, which is a +2.4% move on the day.
Here’s the historical base rate for that move on NVDA earnings prints:
Move ≥ +2.4% next close: 5 of 14 (36%) — the trade at least breaks even
Move ≥ +5%: 4 of 14 (29%) — the trade at least doubles
Move ≥ +10%: 3 of 14 (21%) — the trade goes to a triple or better
The 1DTE version gets slightly better convexity if NVDA gaps up and keeps running — that’s the May 2024 case. But it gets strictly worse expected value if the initial gap fades — that’s the May 2025 case. In the sample, the fade case shows up more often than the runaway case, which is why the 1DTE hit rate is lower and the median is worse. On base rates, the 0DTE is the marginally less bad choice. Neither is what the historical distribution actually rewards.
What Would Change the Read
The single biggest lever on this analysis is entry IV. I’ve been running 110% (0DTE) and 90% (1DTE) as fixed proxies. Real earnings IV varies by event — sometimes it prints at 130% on the 0DTE, sometimes closer to 90%. Higher IV inflates the entry premium and raises the required move to break even. Lower IV compresses it. If you can find an NVDA earnings event where the 0DTE ATM IV is trading meaningfully below 95%, the trade math actually gets interesting.
This is not that event. Wednesday’s implied move is running around 6.5%, which puts the 0DTE IV close to the 110% assumption.
The other lever is strike selection. An OTM call at $225 or $230 has lower delta, lower premium, and requires a bigger move — but if the move happens, the multiple is much higher. That’s the trade behind every “+2,047% on my Feb 2023 NVDA call” screenshot you’ve seen on X. It’s a different lottery ticket with a different payoff profile, and I’m going to break it down in Post 3 alongside the non-event day trade.
Caveats & Considerations
I ran this on fourteen events but that’s really a small sample. NVDA has only reported four earnings prints per year, and the daily options chain only goes back to 2022-2023 for the strikes I’m using as proxies. So the base rates I’m quoting have real error bars around them, so you should absolutely keep that in mind when you review this.
What I’m confident about is the structural argument. The 1DTE call is a bet that NVDA will close higher on Friday than on Thursday when Thursday closed just below the strike. That specific pattern is rare in the data, and when the opposite happens — the initial move fades — the extra day converts winners into losers. The mechanism is clean even if the sample is thin.
What I’m less confident about is the exact hit rates on any single move threshold. If NVDA’s earnings behavior changes structurally over the next few quarters — as it has multiple times in the past three years — the numbers I’m quoting will move.
What to Do With This
If you’re going to buy an earnings call anyway: Buy the 0DTE, not the 1DTE. The data is clear that adding a day gives the trade more time to reverse against you than it gives it time to work. The 1DTE only wins when the 0DTE was already winning.
If you’re sizing this trade: Assume you’re going to zero. That is the median outcome. Anything you can’t afford to fully lose has no business in this position, and the tail winners in the sample only exist because someone was willing to fully lose the other ten.
If you’re serious about the earnings vol trade: The interesting side of this is the seller side, not the buyer side. NVDA earnings IV consistently prices in more move than the stock delivers, and the structural edge is in collecting that premium — not in paying it. The mechanics of running that trade responsibly are a different post and a very different risk profile.
This post is not a trade recommendation. It's an analysis of what the vol surface is pricing in and what fourteen historical NVDA earnings prints have actually done. Alpha is never guaranteed and the backtest is a liar until proven otherwise. Position sizing, risk tolerance, and holding period are yours to tackle. Do your own research and eat more salads.