
The NVDA 0DTE FOMC Trade Is a Lottery Ticket
Part 1 of 0DTE Autopsy: Retail vs. Vol Surface

This is the first post in a three-part series autopsying the short-dated NVDA options trade where retail traders lose money. Post 1 covers FOMC. Post 2 will cover earnings. Post 3 will cover non-event days. The thesis across the arc: the danger in short-dated NVDA options is not being wrong on the event, it is being on the option-buying side at all.
Summary in ~200 Words
Retail is setting up a bounce trade in NVDA into Wednesday’s FOMC decision. NVDA is down 7% from its July 14 high, semis are down 12%, the Fed is expected to hold at 3.50-3.75%, and a dovish tone from Chair Warsh at 2:30pm would give the market a reason to buy the AI names back. Buying ATM NVDA 0DTE calls into that setup looks like a cheap way to get leverage on the bounce, with the maximum loss capped at the premium paid.
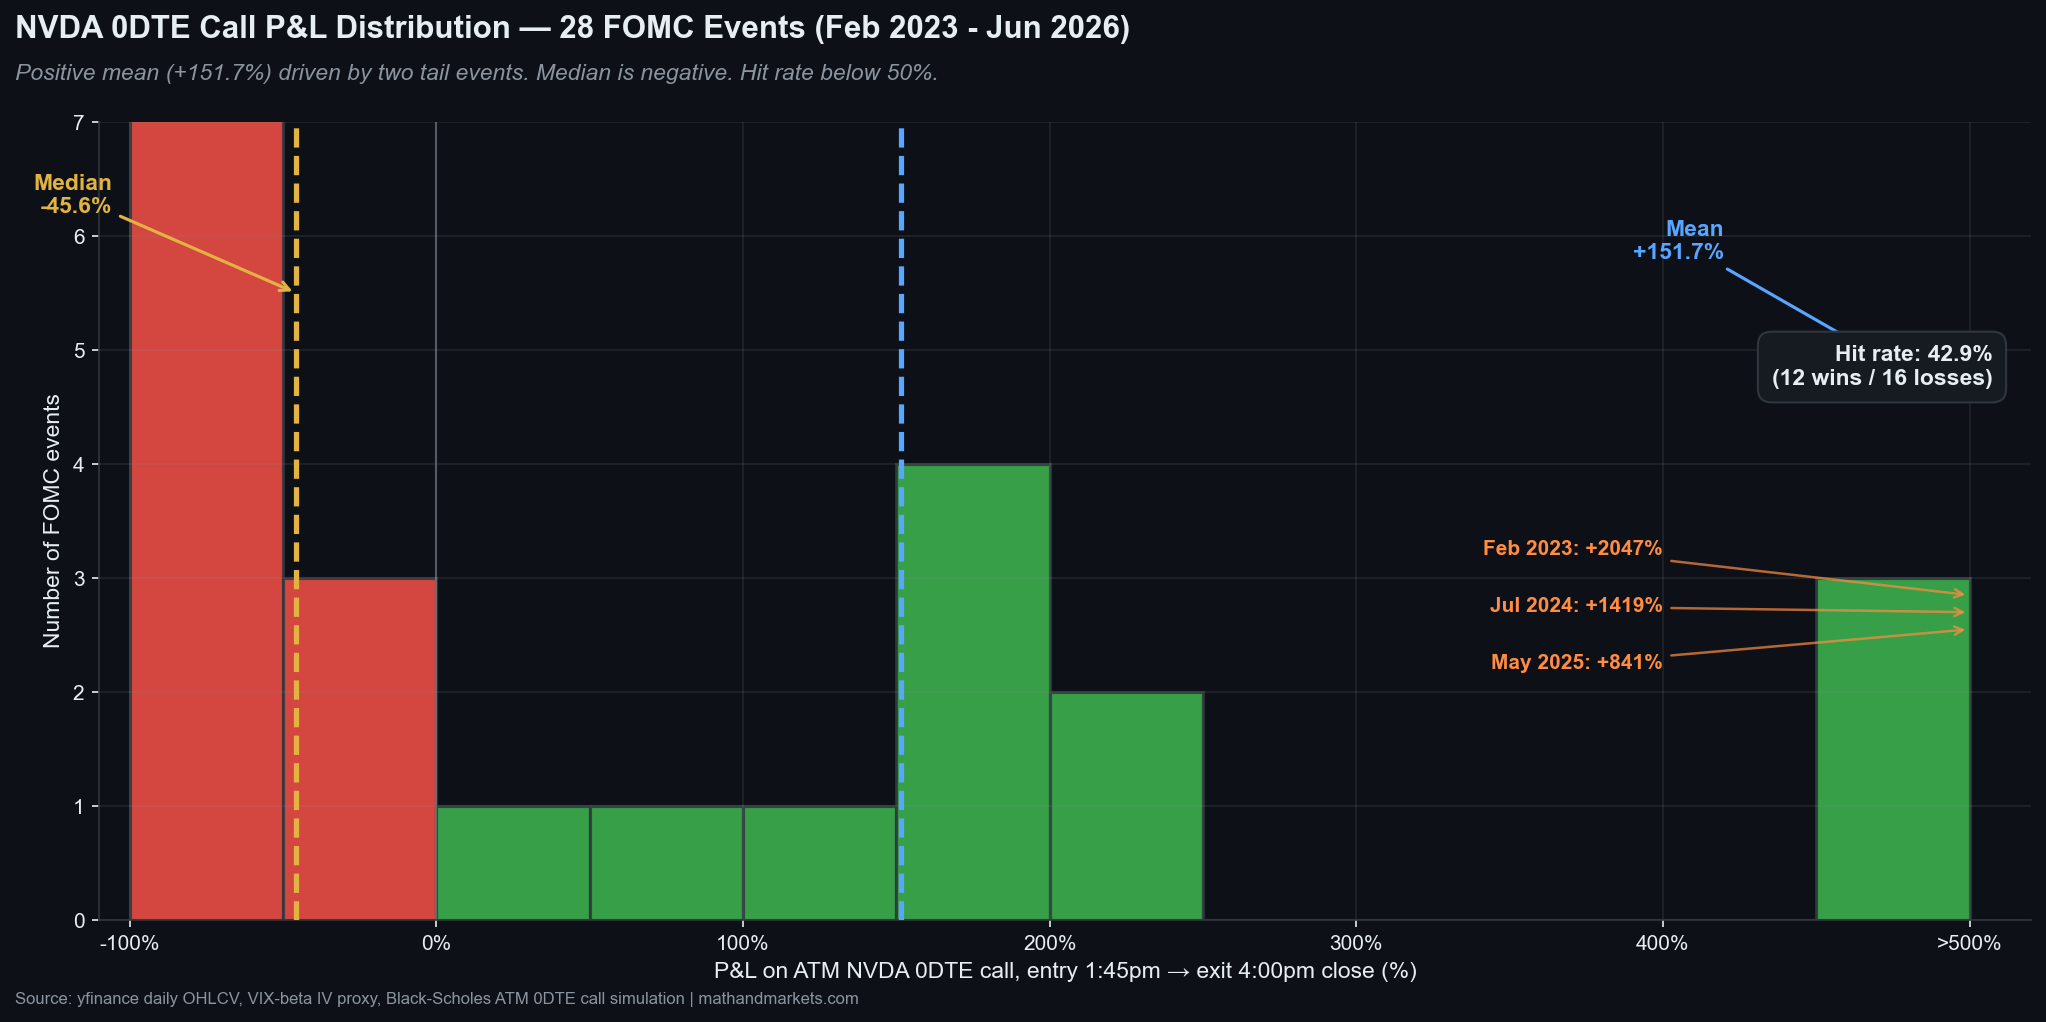
So I pulled every FOMC decision day from February 2023 through June 2026 — 28 events — and simulated buying an ATM NVDA 0DTE call at 1:45pm and holding to 4:00pm close. The mean return is +151.7%. The median return is −45.6%. The hit rate is 42.9%. Three tail events out of 28 drive the entire positive mean; strip them out and the mean flips to −2.4%. Theta is a certain loss on every single event without exception. The sum of delta, vega, and theta before convexity is −95% of entry premium on average.
This is a lottery ticket. It has a positive expected value on paper, sits below chance on hit rate, and pays out the mean only on days that account for 7% of the sample.
So effectively, retail is not buying a leveraged bounce trade. They are buying a lottery ticket priced to look like a leveraged bounce trade.
The Latvian Gambit
You didn’t really think I was going to write a post without one of these, did you?
In July 1955, at the U.S. Junior Championship in Lincoln, Nebraska, a twenty-year-old Viktors Pupols told a twelve-year-old Bobby Fischer that he was going to play the Latvian Gambit against him that evening. Fischer did not believe him. Pupols played it anyway — 1.e4 e5 2.Nf3 f5, one of the oldest and worst opening lines in chess. It’s one where White scores 62% and Black scores 17% at the master level. Fischer lost on time. It was one of only two games he would ever lose on the clock in his entire career. Pupols would later say, “Bobby lost more Latvian Gambits that afternoon than in all the rest of his life.”
Capablanca lost to the Latvian Gambit too. The opening survives on the rare occasion when White does not know the refutation cold and Black lands a haymaker before move twenty. Most Latvian games are Black losses (bite me if you want to debate this). But a small number are spectacular Black wins. But the average result is a loss.
But every so often the win is big and a new generation of players convinces themselves the opening is actually good.
Buying an at-the-money NVDA 0DTE call into FOMC is the Latvian Gambit. Most trades lose. A handful of trades win spectacularly and post on WSB. The average return is dominated by those handful of oversized wins, and if you strip them out, the average trade is a pretty bad loser.
The retail poster screenshotting a +1,400% FOMC-day NVDA call is showing you the equivalent of Pupols beating Fischer on time in Nebraska. It does not mean the opening is playable.
The Setup Retail Sees
NVDA closed Tuesday at $197, down 7.1% from the July 14 intraday high of $211.78. The broader semi complex is worse — SMH is down 11.8% over the same ten-session window, and second-tier semis have been hit harder than NVDA. In fact, NVDA is holding up better than its sector index, which most of retail would read as strength within a weak group.
The Fed decision lands Wednesday at 2:00pm ET. Consensus is a hold, the fifth consecutive meeting with no move. Chair Kevin Warsh’s press conference at 2:30pm is where any surprise would come from, and market-implied odds of a rate hike later in 2026 have climbed back to roughly 40% on rising oil prices. The tail risk sits on the hawkish side of the print, not the dovish one. But of course, retail is buying calls (at least that’s the sense you get if you read WSB).
The retail thesis has four assumptions — (1) NVDA has bottomed, (2) a dovish Fed triggers a bounce (3) NVDA gets the most leverage on that bounce because it is the highest-beta name in AI, and (4) a 0DTE call caps the downside at whatever you paid for it. Every one of those claims is defensible in isolation. But problem shows up when you check them against what NVDA has actually done on 28 previous FOMC days.
The Distribution Retail Is Actually Buying
The mean return on an ATM NVDA 0DTE call across 28 FOMC decision days from February 2023 through June 2026 is +151.7%. That number, on its own, sells the trade. Buy the call, hold to close, walk away with a 2.5x on average. It is also a completely misleading way to describe what happens on the trade.
The median return on the same 28 events is −45.6%. The hit rate is 42.9%. Twelve of twenty-eight trades finished in the green, sixteen finished in the red. The mean sits at +151.7% because three events — February 1, 2023 (+2,046.5%), July 31, 2024 (+1,418.7%), and May 7, 2025 (+840.5%) — carry the entire positive average.
Strip those three days out and the mean of the remaining 25 events is −2.4%. Twenty-two of the 28 events, or 79% of the sample, are the trade that most closely resembles what a retail buyer would experience: a call that mostly loses money.
This is what a lottery-ticket’s distribution looks like. Most tickets lose. A small number pay out enormously. The mean of a lottery ticket can be positive and it can still be a bad trade if you cannot survive the losses to collect the wins, or if you cannot run the trade often enough for the tail to converge to the mean. A retail trader running the NVDA 0DTE call four to eight times a year on FOMC days is not running it often enough for the mean to matter. They are running it often enough to lose four or five times in a row and stop, months before the tail event lands.
The at-the-money 0DTE put fares worse across the board. Mean −9.6%. Median −100%. Hit rate 32.1%. Puts are structurally worse because NVDA’s upward drift over the sample dominates and because the ATM strike grid puts a Wednesday put slightly out of the money at entry.
The at-the-money straddle — long both call and put — is the only structure in the dataset with a hit rate above chance. 57.1%. Mean +34.8%. Median +21.7%. It collects on both convexity events and does not need to guess direction. It also costs roughly double the premium of either leg alone and typically it is not the trade retail is running. Typically, retail buys calls directionally, expecting a bounce.
Where the Money Actually Went
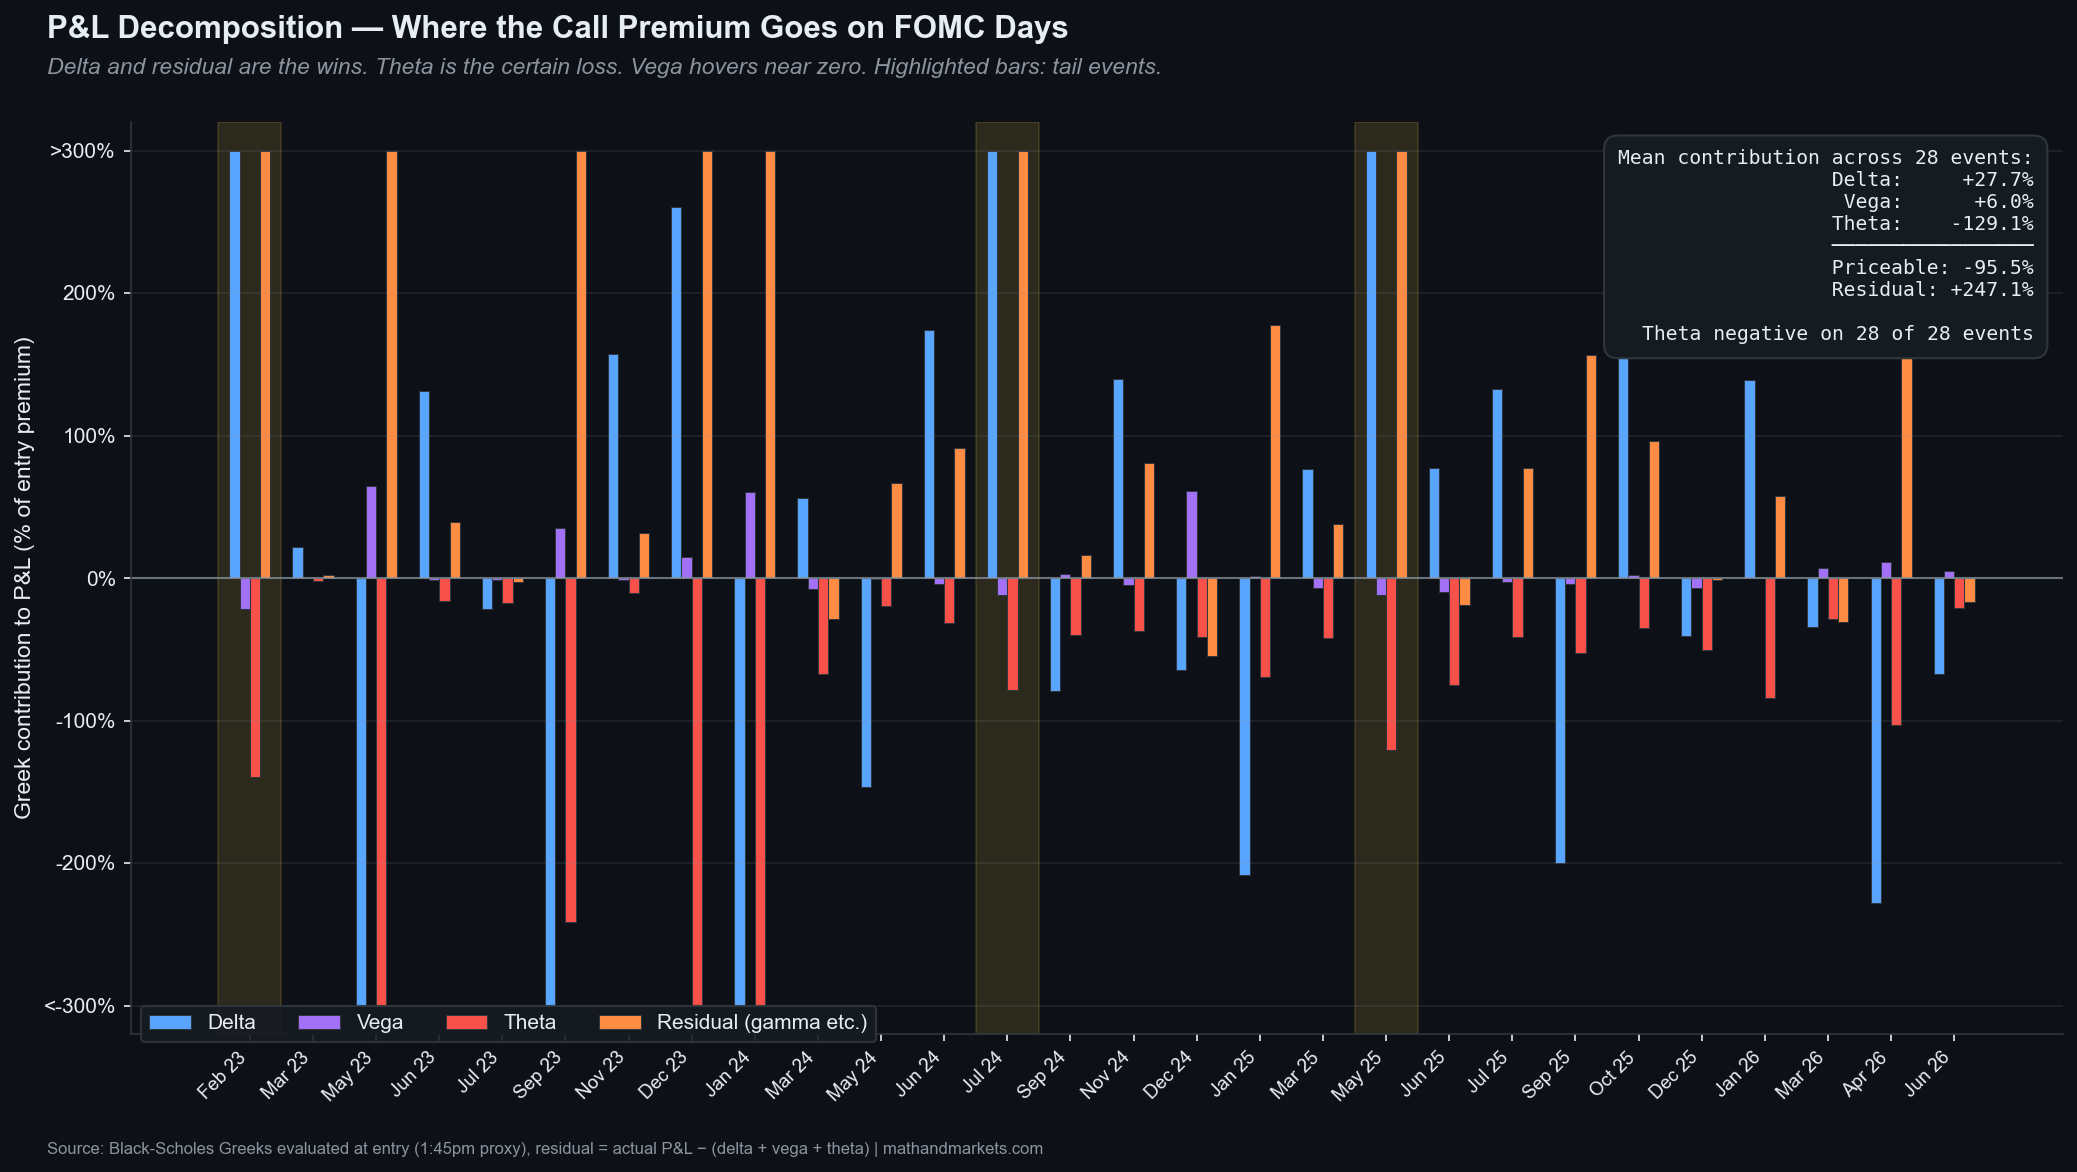
The way to see why the median is so negative even with a positive mean is to decompose each simulated call into its Greek components. For every event, I computed the delta, vega, and theta contributions to P&L using the entry-time Greeks, and let the residual capture gamma and other higher-order curvature.
Theta is negative on 28 of 28 events. Mean theta contribution is −129.1% of entry premium. There is no exception, no meeting where time decay worked in the buyer’s favor. The 2:15 window between the 1:45pm entry proxy and the 4:00pm close bleeds premium on every single historical event.
Vega is negative on 16 of 28 events, or 57.1% — the same number as the VIX-down count. Mean vega contribution is +6.0% but median is −1.0%, which means vega is slightly positive on average because the two big hawkish shocks (December 2024 and September 2023) inflated VIX and juiced vega on those days. On the median FOMC day, vega is a small loss.
Delta contribution mean is +27.7%. NVDA drifts up slightly more often than down across the sample, which produces a modest positive delta lean. But the delta gain is dominated by theta in every low-move event. Delta needs a real move to overcome the theta bleed, and the median move is not big enough.
Sum delta, vega, and theta: −95% of entry premium on average.
The three Greeks that describe the smooth, priceable part of the option’s value together predict a nearly complete wipeout on the average trade.
The reason the actual mean comes out to +151.7% is a +247.1% residual, which is gamma and near-expiry curvature that first-order Greeks cannot capture (if you are wondering what a residual is, it’s what’s left of the P&L after you subtract the delta, vega, and theta contributions — mostly gamma and other higher-order curvature the linear Greeks miss).
That residual is not a repeatable edge. It is the same three-event tail as before, re-expressed in Greek terms. The convexity payoff is real, and it is entirely concentrated in the handful of days when NVDA moved 7% or more on the print.
The Rotation Read Doesn’t Transfer
The idea that NVDA is the “safe semi” and is better positioned than the sector because it has outperformed SMH during the July drawdown largely holds up in a very specific window. From the July 14 peak to Tuesday’s close, NVDA is down 6.98% and SMH is down 11.78%. NVDA has outperformed by roughly five percentage points over ten sessions.
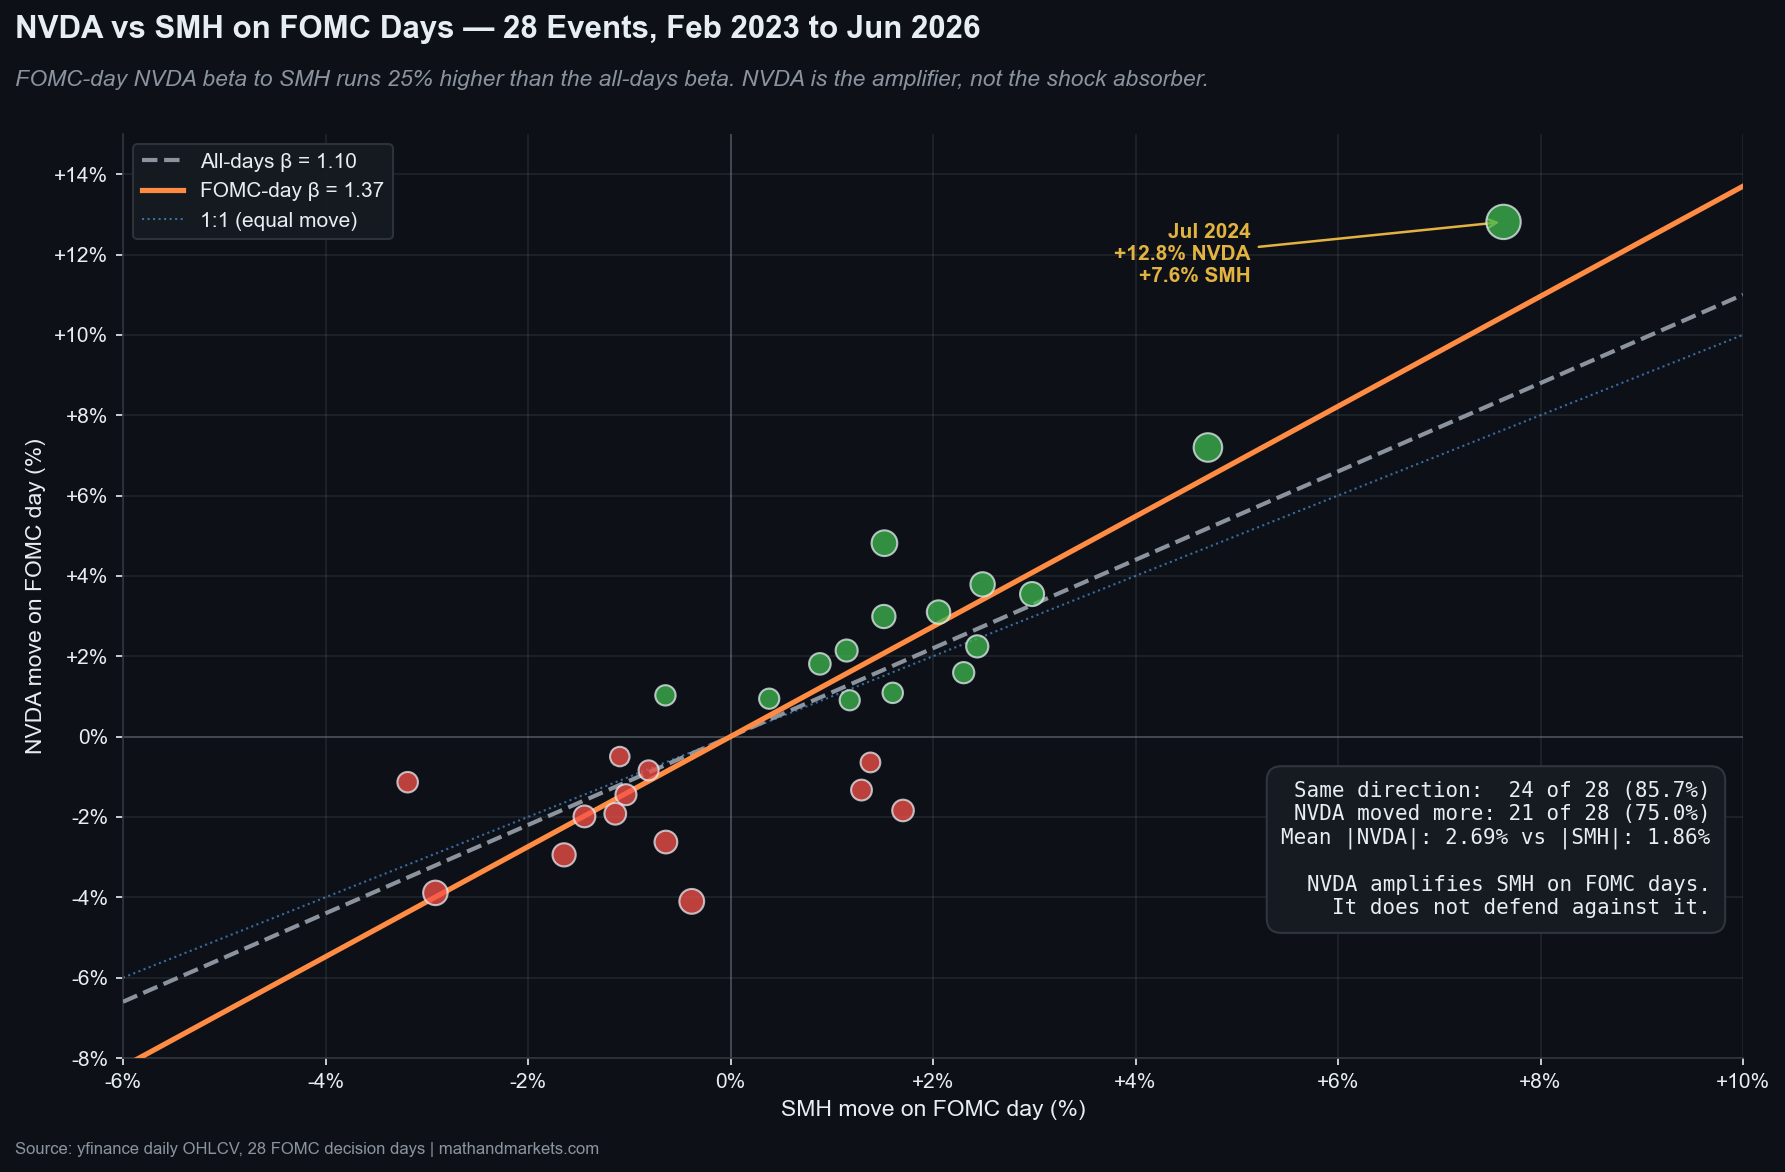
But that relationship does not transfer to FOMC days. NVDA’s beta to SMH across the 28 FOMC decision days in the sample is 1.37. The all-days beta over the same two-year window is 1.10. NVDA moves relatively harder against SMH on FOMC days than on an average day, not softer. NVDA moved in the same direction as SMH in 24 of 28 FOMC events, or 85.7%, and moved by more than SMH in absolute terms in 21 of 28, or 75%. Mean absolute NVDA move on FOMC day is 2.69% against 1.86% for SMH.
So WSB and retail are reading NVDA’s outperformance over the last two weeks — which came out of company-specific AI-capex news, not sector-level defensiveness — as a signal that NVDA will hold up better than SMH on Wednesday.
The historical data says the opposite. On FOMC days, NVDA has been the amplifier within the semi complex, not the shock absorber. If SMH sells off on a hawkish surprise, NVDA has historically sold off harder.
What the Trade Actually Needs
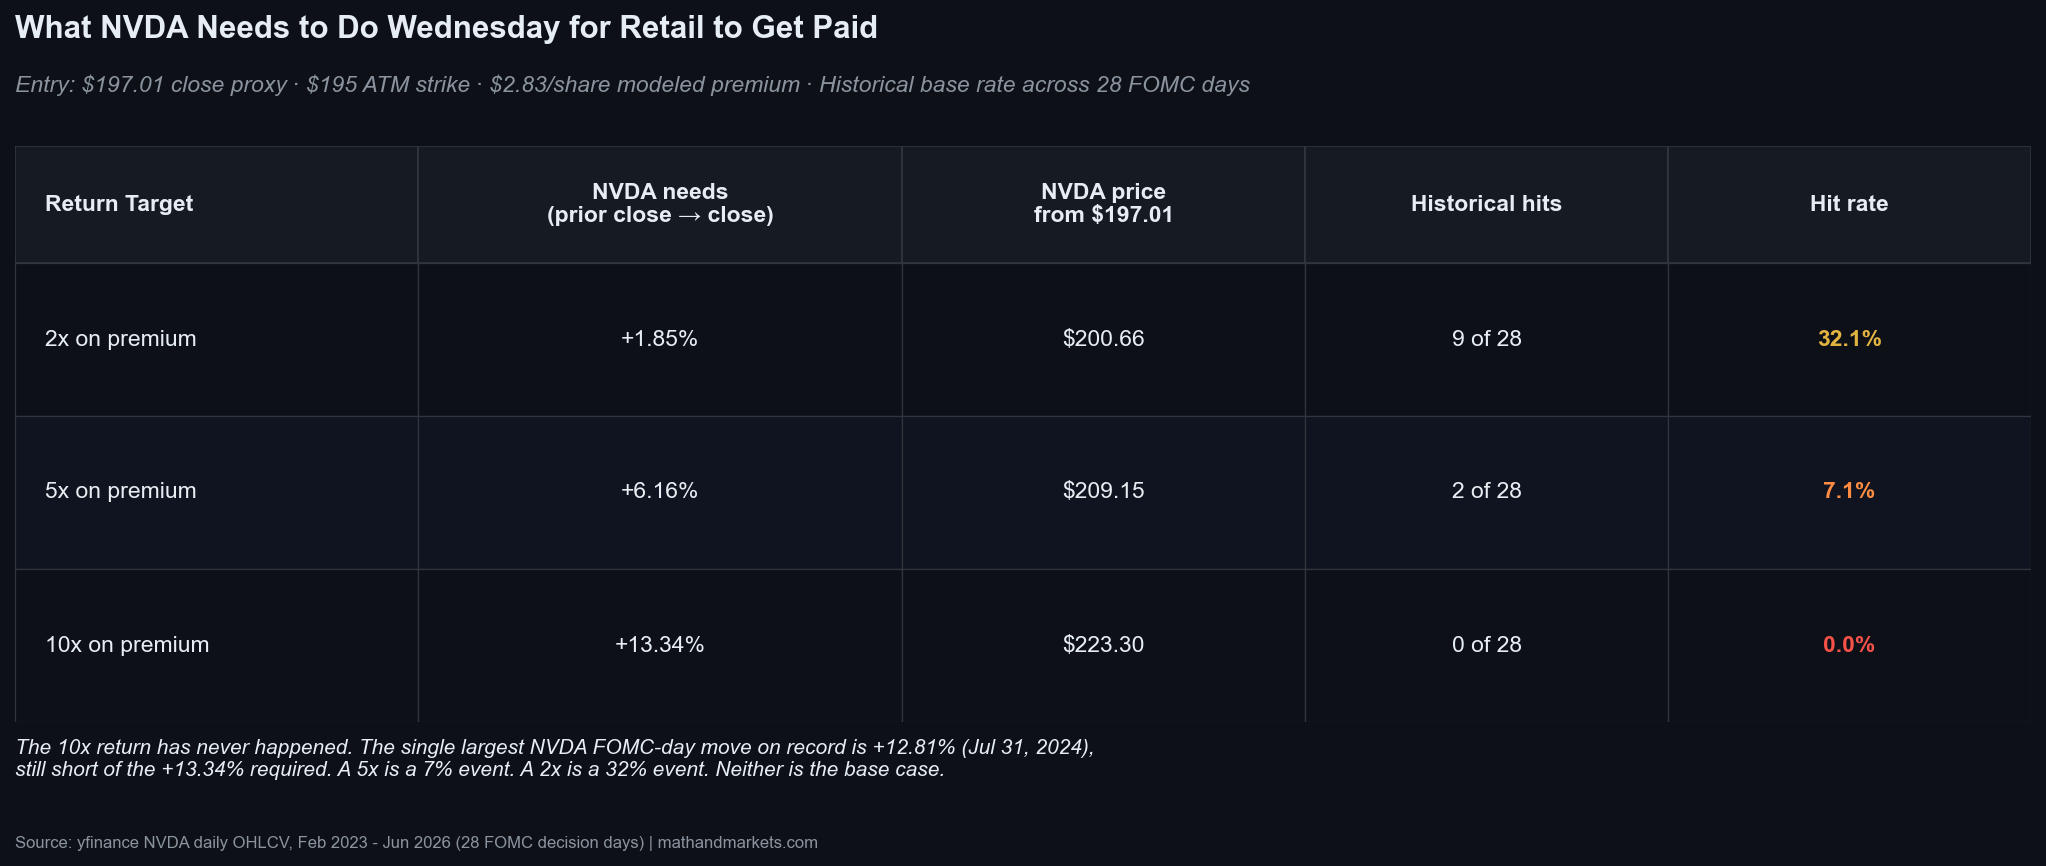
Using Tuesday’s close as the 1:45pm-proxy entry point, the nearest-$5 ATM strike is $195, which puts the call $2.01 in the money at entry. The modeled call premium is $2.83 per share, or $283 per contract. Breakeven at expiry is $197.83, only 0.42% above the entry spot. That looks like a small required move because the option is already $2 intrinsic — the breakeven is deceptively (or perhaps perilously) close.
The question is not where breakeven sits. The question really is what does NVDA need to do to produce the returns retail is chasing?
Well, a 2x return on premium requires NVDA to move +1.85% on the day, which has happened on 9 of the last 28 FOMC days — a 32.1% hit rate. A 5x requires +6.16%, which has happened 2 of 28 times, or 7.1%. A 10x requires +13.34%, which has never happened once in the sample.
The 10x is literally impossible on this historical sample. No FOMC day in the last three and a half years has produced a large enough move. The single biggest single-day NVDA move in the entire 28-event dataset is +12.81% on July 31, 2024, which still falls short of the +13.34% required for a 10x. The retail poster who screenshots a “I’m looking for a 10x” thread before Wednesday is asking for something that has not happened once in the observable history of this trade.
The 5x is a 7% event. The 2x is a 32% event. Neither is the base case. Both sit well below the hit rate retail assumes when they estimate their edge.
What Would Change the Read
The vol-crush and theta arguments hold up cleanly across the sample and are not sensitive to small changes in methodology. What is sensitive is the tail. If tomorrow’s FOMC produces an outlier NVDA move — a genuine dovish surprise from Warsh that resets rate expectations, or a hawkish surprise that breaks the recent range in the other direction — the trade lands in the tail bucket that pays out the historical mean. That is the scenario WSB is implicitly betting on. It is not zero-probability. After all, it is a 7% base rate, and it is what you are compensated for when you are holding through the theta and vega drag.
The read also breaks if NVDA IV going into Wednesday were closer to its trailing realized rather than elevated. In that eventuality, the pre-decision IV proxy puts NVDA implied vol at 56%, meaningfully above its trailing 30-day realized. Retail is paying up for that spread. If pre-event IV compressed materially between now and Wednesday morning, the theta and vega drag would shrink and the trade’s expected value would improve. That is not the setup on the tape.
There is also a channel this analysis does not capture. MSFT reports Wednesday after the close, META and AMZN report Thursday. If those prints confirm continued AI-capex spending, NVDA can rally on the reports alone, regardless of what the Fed does. That is a two-to-three-day trade with multiple catalysts. A 0DTE call bought Wednesday morning expires before the first earnings release even hits the tape.
What Comes Next
This is Post 1 of the 0DTE Autopsy arc. Post 2 covers NVDA 0DTE and 1DTE calls into the late-August earnings print, where the mechanism shifts from macro mispricing to idiosyncratic vol crush. Post 3 covers non-event days, where retail pays theta and IV premium on days when nothing happens. FOMC is where the argument is cleanest, because theta is guaranteed, vega is negative on the median day, and delta cannot outrun them without a tail move.
The three days in the sample that produced the outsized wins were not what a retail trader would call “a bounce trade into a dovish Fed.” They were extreme reactions to Fed communication that reset how the market thought about rates for months afterward. Buying the ticket does not put you in that bucket. It just puts you on the hook for the premium.
This post is not a trade recommendation. It’s an analysis of what the vol surface is pricing in and what the historical distribution of outcomes has been on FOMC days. Position sizing, risk tolerance, and holding period are your problem. Alpha is never guaranteed and the backtest is a liar until proven otherwise. Do your own research and eat your vegetables.