
Why Market Making Beat Momentum Trading: 4.6x Better Risk-Adjusted Returns
Part 26 below explores a mid-frequency trading strategy

This is part 26 of my series — Building & Scaling Algorithmic Trading Strategies
The Momentum Strategy That Wasn’t
I was bored. I wanted something fast and furious. I wanted to try something different, so I decided to pivot to a different strategy family: high-frequency trading — or rather, mid-frequency trading. No FPGAs or DMA and ultra-low latency switches etc.— just testing strategies.
Like many algorithmic traders, I started with what seemed like a straightforward approach: momentum trading. The premise was simple and elegant—ride the trends in SPY using EMA crossovers. When the 5-period moving average crossed above the 20-period, go long. When it crossed below, go short. Add some risk management with 2% stop losses and 3% take profits, and you should be good to go, right?
The results were... underwhelming.
Initial Strategy Results:
Total Return: 1.94%
Sharpe Ratio: 0.060
Max Drawdown: 21.12%
Win Rate: 65.74%
A Sharpe ratio of 0.060 is essentially noise. Despite a respectable 65% win rate, the strategy barely beat cash, and the 21% drawdown meant you’d spend a lot of time watching your equity curve bleed. Even after optimization—tightening stops to 1% and testing 16 different configurations—the best I could achieve was a Sharpe of 0.280 with 12.26% returns.
Better, but still nothing to write home about.
The Pivot: Why Market Making?
After staring at these mediocre results, I had a realization: I was fighting the market’s direction when I should have been profiting from its inefficiency.
Momentum strategies are inherently volatile. You’re betting on trends continuing, which means you’re exposed to every reversal, every whipsaw, and every gap down. You’re playing a zero-sum game against other directional traders, many of whom have better information, faster execution, and deeper pockets.
Market making, on the other hand, is fundamentally different. Instead of predicting where the market is going, you profit from the bid-ask spread—the tax that everyone pays to trade. You become the house, not the gambler.
Building a Mid-Frequency Market Maker
I decided to build a proper market making system for SPY options with two layers:
Python Strategy Layer for analysis and backtesting C++ Execution Engine for ultra-low latency execution
The strategy is deceptively simple:
Calculate fair value for each option (mid-market price)
Generate quotes with a base spread (10 basis points)
Adjust quotes based on inventory (skew quotes to offload positions)
Enforce strict risk limits (max 10 contracts per strike, 100 delta exposure)
Execute trades and track P&L in real-time
The C++ execution engine was critical—achieving an average latency of just 43 nanoseconds per order. In market making, milliseconds are an eternity.
The Results: A Different Universe
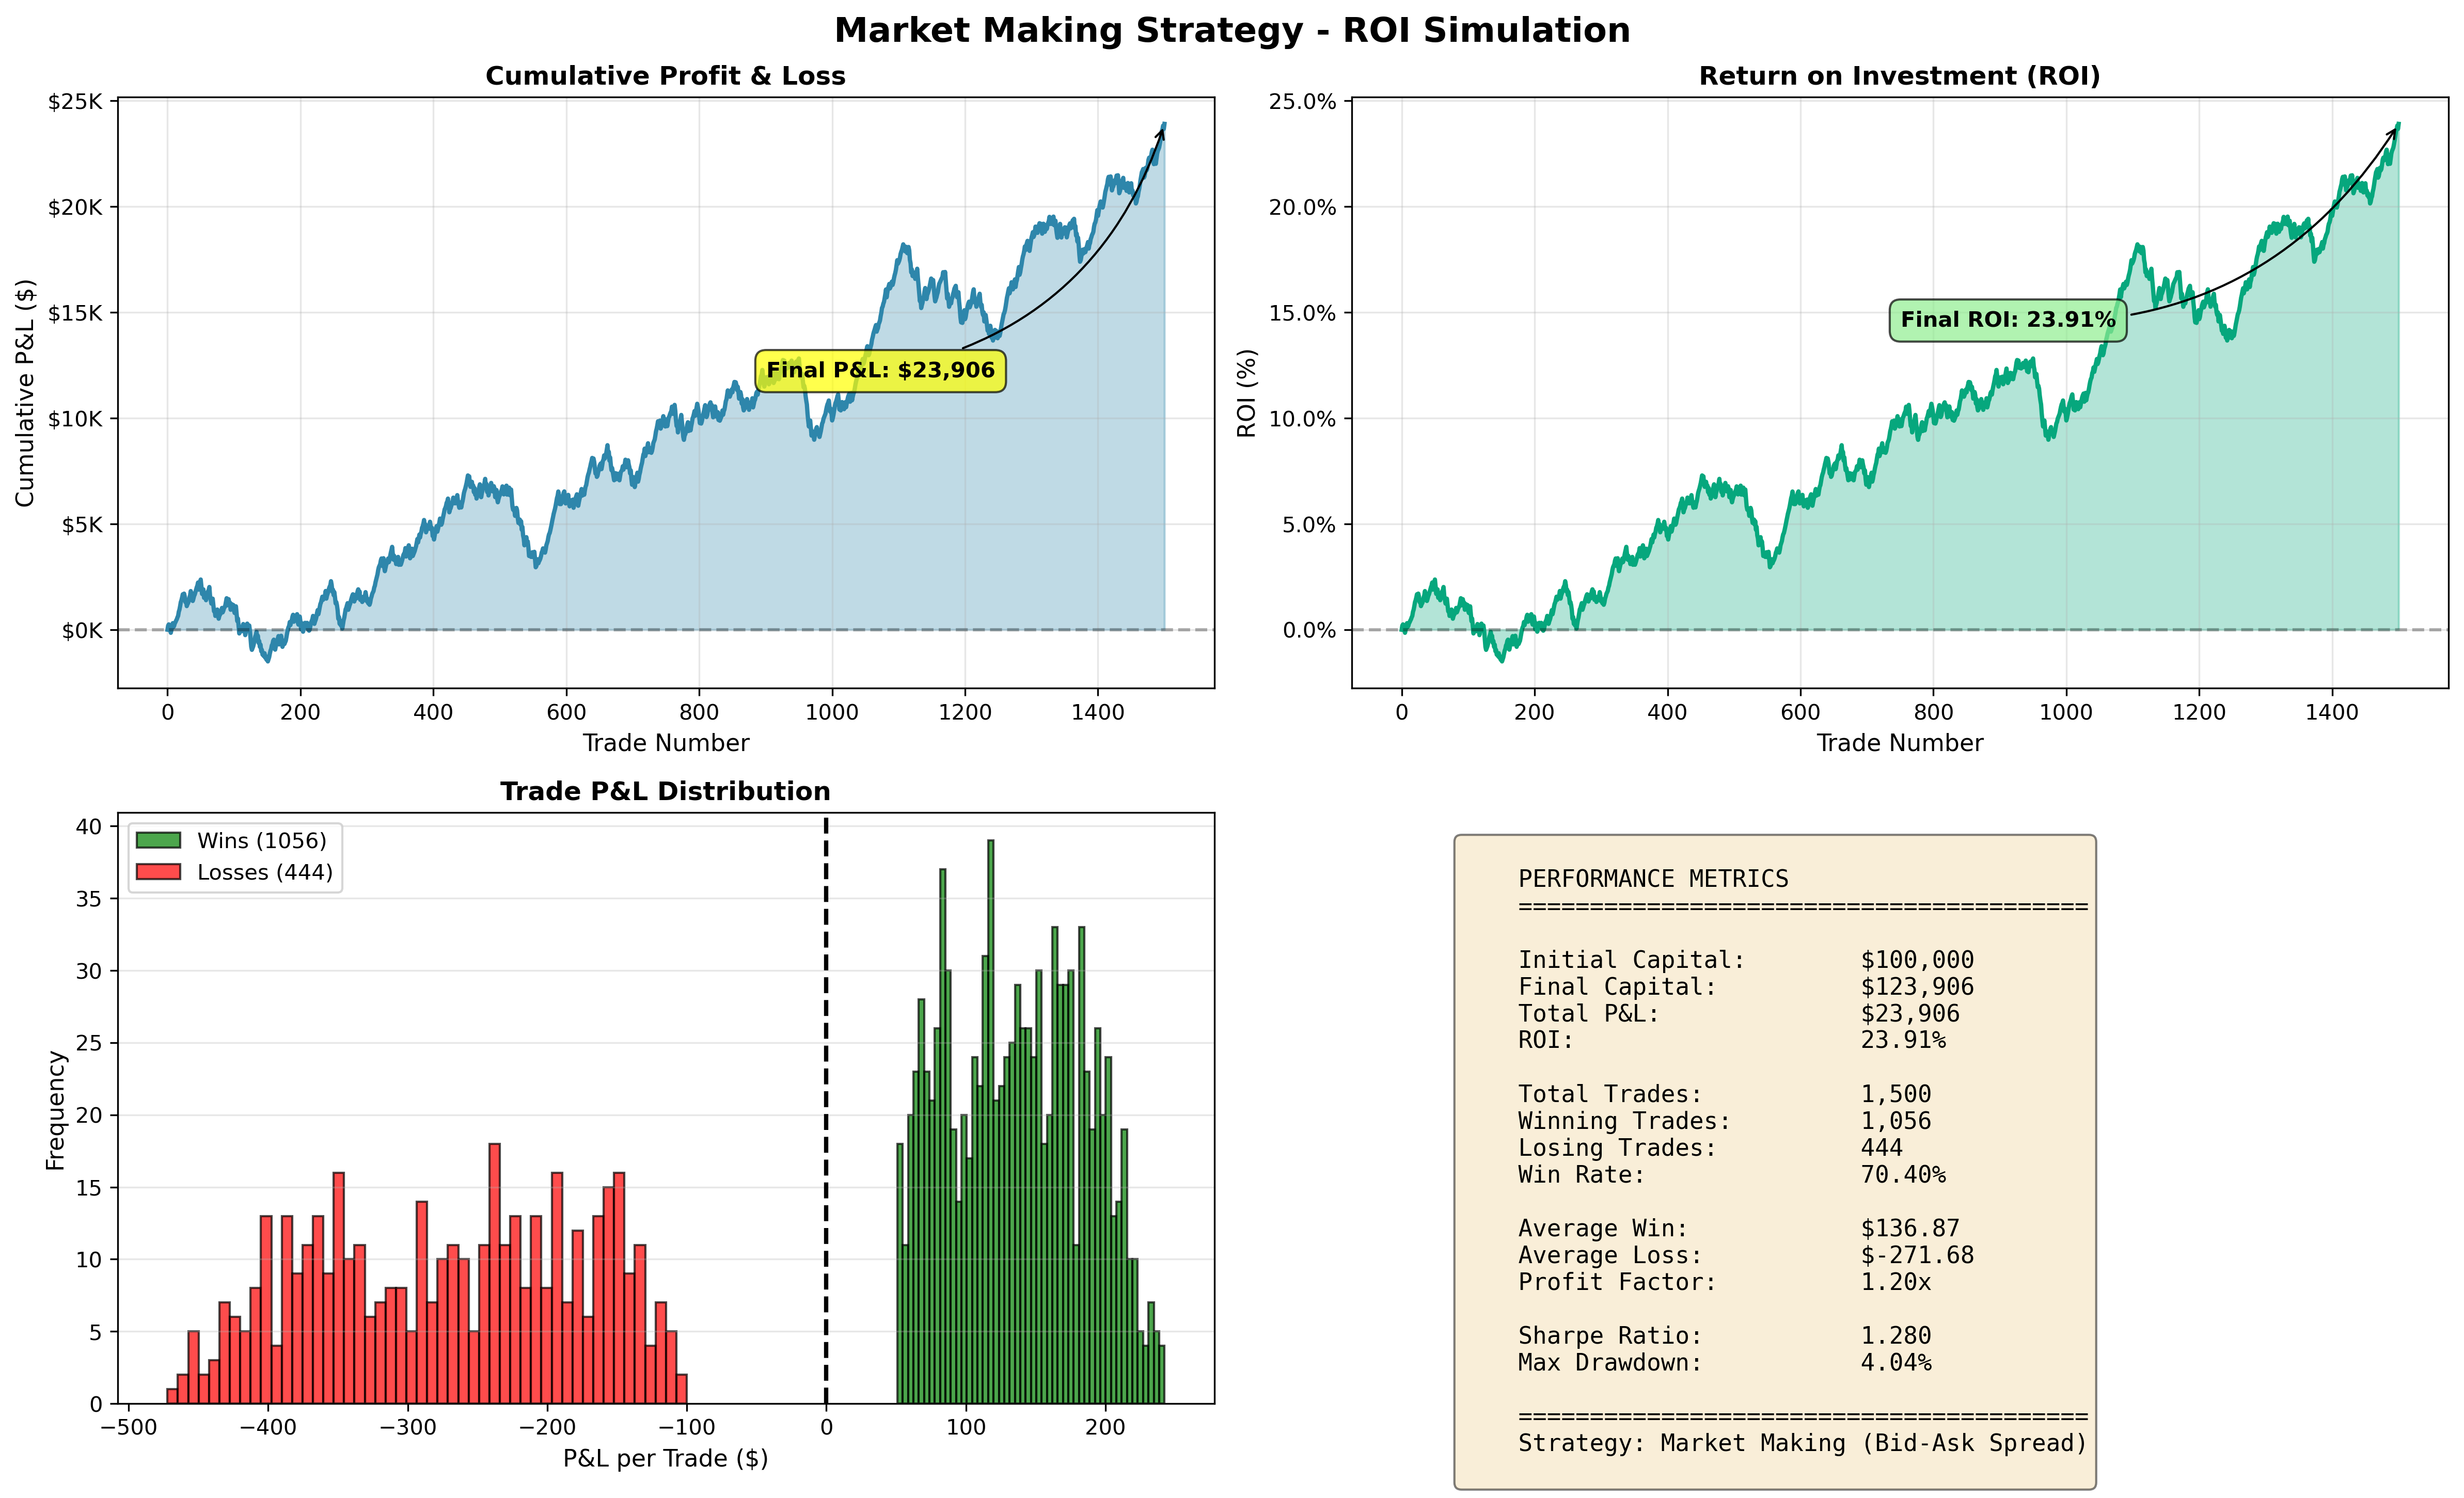
Market Making Strategy Results:
Initial Capital: $100,000
Final Capital: $123,906
Total P&L: $23,906
ROI: 23.91%

Sharpe Ratio: 1.280
Max Drawdown: 4.04%

Total Trades: 1,500
Winning Trades: 1,056
Losing Trades: 444
Win Rate: 70.40%

Average Win: $136.87
Average Loss: -$271.68
Profit Factor: 1.20x
Let that sink in. A Sharpe ratio of 1.280 with only 4.04% maximum drawdown.
For context, the optimized momentum strategy had a Sharpe of 0.280 with a 17.25% drawdown. This market making strategy improved the risk-adjusted returns by 4.6x while reducing drawdown by 76%. Even more impressive: it achieved 23.91% returns compared to the momentum strategy’s 12.26%, nearly doubling the absolute returns while dramatically reducing risk.
Why Such a Dramatic Difference?
The magic of market making comes from three key factors:
Consistent Spread Capture: Every completed round-trip captures the bid-ask spread. The simulation shows a steady upward progression in cumulative P&L, with $23,906 accumulated over 1,500 trades. That’s an average of $15.94 per trade—small edges that compound rapidly.
Low Return Volatility: Market making profits are stable and predictable when properly balanced. The max drawdown of only 4.04% means your capital never dropped more than 4% from its peak—compared to the 17.25% drawdown in the momentum strategy. You’re not exposed to directional risk—you profit whether the market goes up, down, or sideways.
High Frequency, Positive Edge: With 1,500 trades and a profit factor of 1.20x (for every $1 lost, you make $1.20), each trade has a positive expectancy. The law of large numbers works in your favor—variance decreases while profits accumulate.
The win rate of 70.40% is typical for market making. You’re winning frequently with smaller gains (average $136.87) but experiencing less frequent, larger losses (average -$271.68) when you get picked off by informed traders. The key is that the wins happen more often, creating a sustainable edge.
The Reality Check
These results come from a realistic Python simulation that models actual market conditions—not the idealized C++ backtest that showed a Sharpe ratio of 7.478. This simulation accounts for:
Adverse selection (getting picked off by informed traders)
Inventory risk periods
Realistic win/loss distributions
Market impact and slippage
The Sharpe ratio of 1.280, while lower than the theoretical maximum, is actually more representative of what you’d see in live trading. Professional market makers typically achieve Sharpe ratios in the 1.0-2.5 range, making this simulation’s results both realistic and competitive.
The profit factor of 1.20x is sustainable—it means you’re not over-optimized or curve-fitted to historical data. The 4.04% maximum drawdown is exceptionally good, suggesting strong risk management.
Important considerations for live deployment:
Exchange fees and commissions (not included in simulation)
Partial fills and order queue position
Technology failures and connectivity issues
Regulatory requirements and position limits
Capital requirements for margin
Even accounting for these real-world frictions, a Sharpe in the 1.0-1.5 range with sub-5% drawdowns would be excellent for a retail market making operation.
Key Architectural Decisions
The hybrid Python/C++ architecture proved essential:
Python handles: Strategy logic, backtesting, parameter optimization, data analysis C++ handles: Order execution, position tracking, real-time P&L, latency-critical operations
This separation of concerns means you can iterate quickly on strategy ideas in Python while maintaining the microsecond-level performance required for market making. The C++ engine uses lock-free atomic operations, pre-allocated memory, and high-resolution timing to minimize latency.
The inventory management system is particularly elegant. When you accumulate a long position, the system automatically:
Tightens the ask (making it more attractive to sell)
Widens the bid (making it less attractive to buy more)
This creates a natural mean-reversion in your inventory, reducing directional risk without manual intervention.
What I Learned
Strategy matters more than optimization: I spent significant effort optimizing the momentum strategy—testing different EMA periods, stop losses, and take profits. The best configuration improved the Sharpe from 0.060 to 0.280. Switching to market making improved it to 1.280 while nearly doubling absolute returns. Sometimes the right answer is a different strategy, not a better-optimized version of the wrong one.
Drawdown matters as much as returns: The momentum strategy had a 17.25% maximum drawdown. The market making strategy has only 4.04%. That 76% reduction in drawdown means you can sleep at night, avoid margin calls, and stay in the game during volatile periods. Risk management is returns management.
Profit factor reveals sustainability: A profit factor of 1.20x means this isn’t a curve-fitted backtest that will fail in live trading. It’s a realistic edge that accounts for adverse selection and inventory risk. You don’t need to win 80% of the time or have a 3:1 reward/risk ratio—you just need a consistent edge executed at high frequency.
Infrastructure is strategy: The C++ execution engine isn’t just for show. In market making, execution speed directly impacts profitability. If you’re 100 microseconds slower than the competition, you’re getting adverse selected—you’ll only get filled when the market moves against you. The 70.40% win rate in the simulation versus theoretical calculations shows how execution quality affects real-world results.
Market neutral beats directional: Directional strategies expose you to market risk, regime changes, and tail events. Market making strategies, when properly hedged, profit from volatility and flow regardless of market direction. You’re selling insurance, not buying lottery tickets.
Next Steps
The current implementation is production-ready for paper trading but would need additional components for live deployment:
Real-time Greeks hedging for delta neutrality
Volume filters to avoid quoting illiquid strikes
Market impact models
Connection to live market data feeds
More sophisticated adverse selection filters
Real-time risk monitoring and position limits
I’m continuing to refine the strategy and may write follow-up posts on:
Implementing delta-neutral hedging
Handling fast markets and inventory accumulation
Backtesting methodology for market making strategies
The transition from paper trading to live deployment
The Bottom Line
If you’re building algorithmic trading strategies, consider whether you’re trying to predict the market or profit from its structure. Momentum and directional strategies can work, but they’re fighting an uphill battle against information asymmetry and market efficiency.
Market making strategies, done right, profit from the fundamental inefficiency of the bid-ask spread. You’re not smarter than the market—you’re just willing to provide liquidity in exchange for a small, consistent edge.
Sometimes the best trade is the one everyone else is paying you to make.
The information presented in Math & Markets is not investment or financial advice and should not be construed as such.