
Why Buy-and-Hold Outperformed Every Options Strategy (2020–2025): A Technical and Mathematical Analysis
Part 37 evaluates why several options strategies don't work in the current SPY/SPX regime

This is part 37 of my series — Building & Scaling Algorithmic Trading Strategies
SPY/SPX Backtests (November 2020 - November 2025)
Backtests on SPY and SPX from 11/27/2020 to 11/26/2025 show the same surprising-but-not-surprising outcome:
Buy-and-Hold outperformed short iron condors, long iron condors, short strangles, and long strangles — by a wide margin, in every case.
Below is a comprehensive mathematical breakdown of why — and what it means for options strategies in this current market regime.
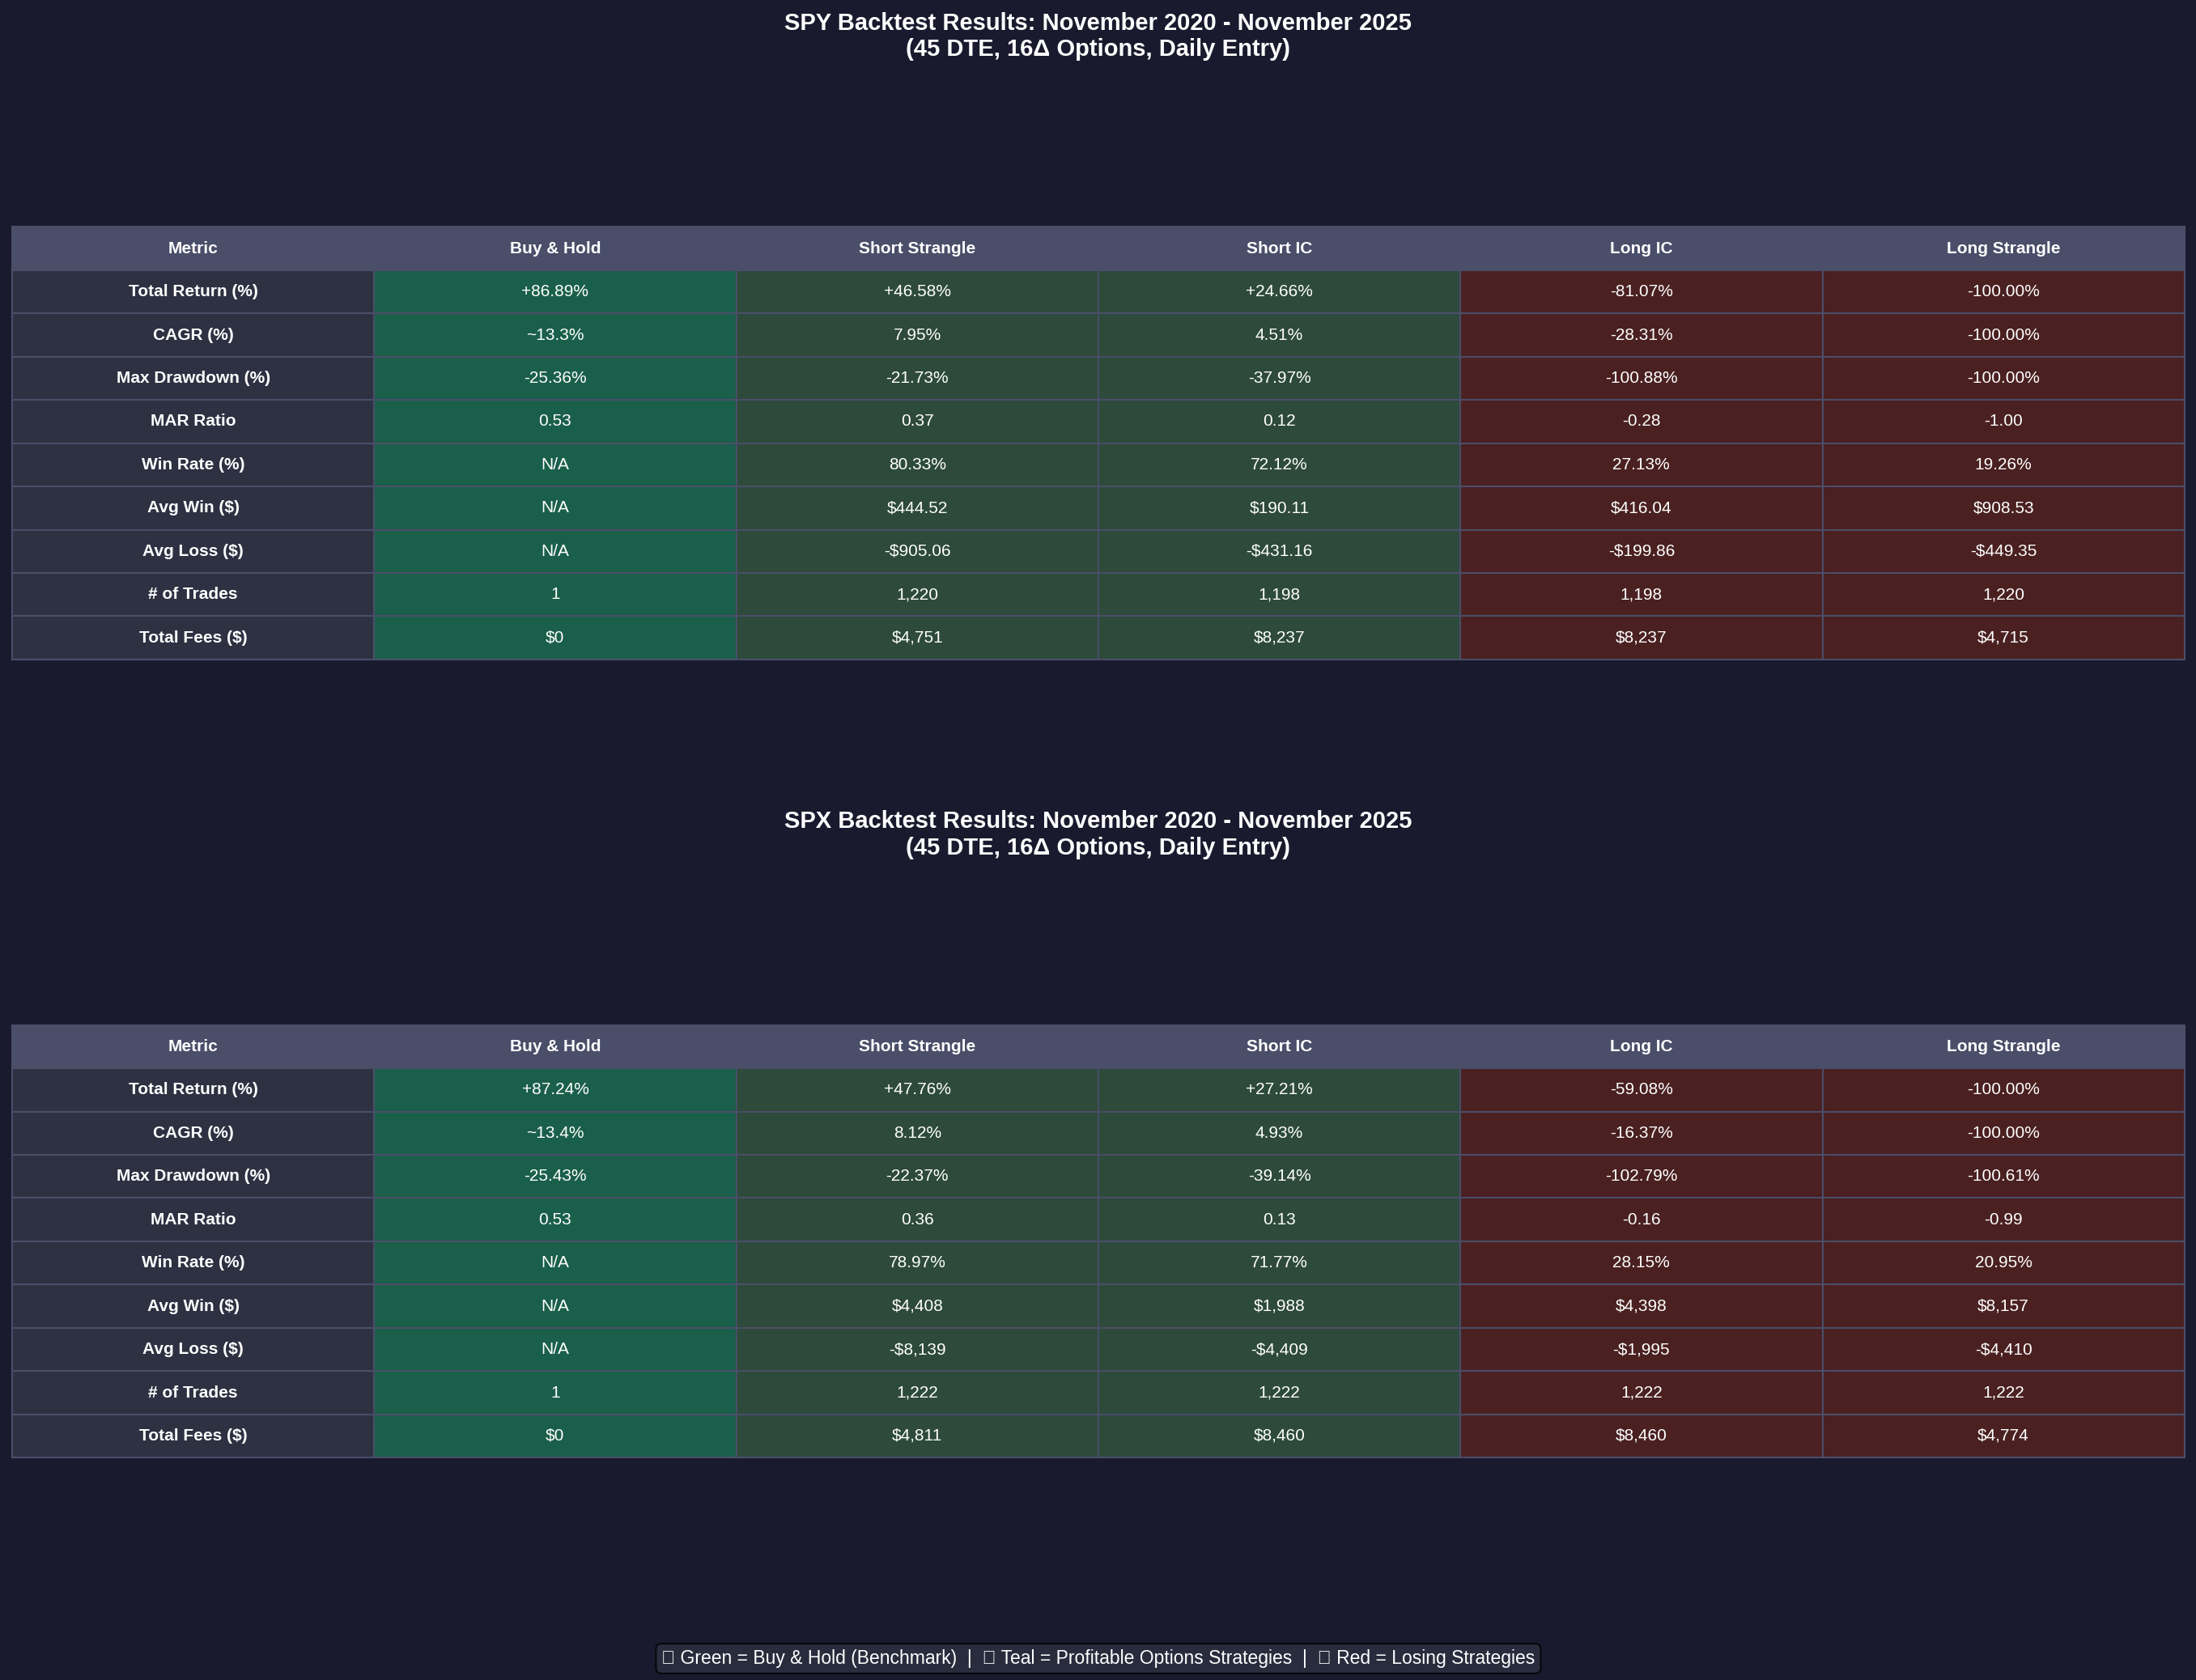
1. Executive Summary: The Numbers
SPY Results (5-Year Backtest)
Strategy            Return     Max DD     CAGR      Win Rate   MAR
─────────────────────────────────────────────────────────────────────
Buy & Hold          +86.89%    -25.36%    ~13.3%    N/A        0.53
Short Strangle      +46.58%    -21.73%     7.95%    80.33%     0.37
Short Iron Condor   +24.66%    -37.97%     4.51%    72.12%     0.12
Long Iron Condor    -81.07%   -100.88%   -28.31%    27.13%    -0.28
Long Strangle      -100.00%   -100.00%  -100.00%    19.26%    -1.00
SPX Results (5-Year Backtest)
Strategy            Return     Max DD     CAGR      Win Rate   MAR
─────────────────────────────────────────────────────────────────────
Buy & Hold          +87.24%    -25.43%    ~13.4%    N/A        0.53
Short Strangle      +47.76%    -22.37%     8.12%    78.97%     0.36
Short Iron Condor   +27.21%    -39.14%     4.93%    71.77%     0.13
Long Iron Condor    -59.08%   -102.79%   -16.37%    28.15%    -0.16
Long Strangle      -100.00%   -100.61%  -100.00%    20.95%    -0.99
Key Observation: SPX and SPY results are remarkably consistent, confirming these findings aren’t a quirk of one instrument. Buy-and-Hold outperformed every options strategy by 40-187 percentage points.
2. The Fundamental Problem: Options Suppress Delta Exposure
SPY produced a multi-year drift-dominated up-move, returning roughly +86.89% on used capital over 5 years.
Buy-and-Hold therefore had:
Δ ≈ +1.00 (full delta exposure)
γ = 0 (no gamma)
θ = 0 (no theta decay)
ν = 0 (no vega risk)
No roll losses
No slippage
No fee drag
Mathematically, the buy-and-hold return is simply:
R_B&H = (P_T / P₀) - 1where P₀ and P_T are starting and ending prices.
Every options structure tested begins by reducing delta exposure:
Strategy              Delta Exposure    Implication
────────────────────────────────────────────────────────────────
Short Iron Condor     |Δ| ≪ 1          Minimal directional exposure
Long Iron Condor      Δ ≈ 0            Delta-neutral
Short Strangle        Δ modest → 0     Slight bias neutralized over time
Long Strangle         Δ ≈ 0            Delta-neutral
The mathematical consequence is inescapable:
R_option ≪ R_B&H whenever the underlying trends upwardOptions cannot mechanically compete with high-delta exposure in a rising market.
3. Volatility Path Dependency: The Achilles Heel
SPY’s realized volatility path during 2020–2025 included:
Violent whipsaws
Two major volatility expansions (2022, 2025)
Several sharp but brief shocks
A long bull run after 2023
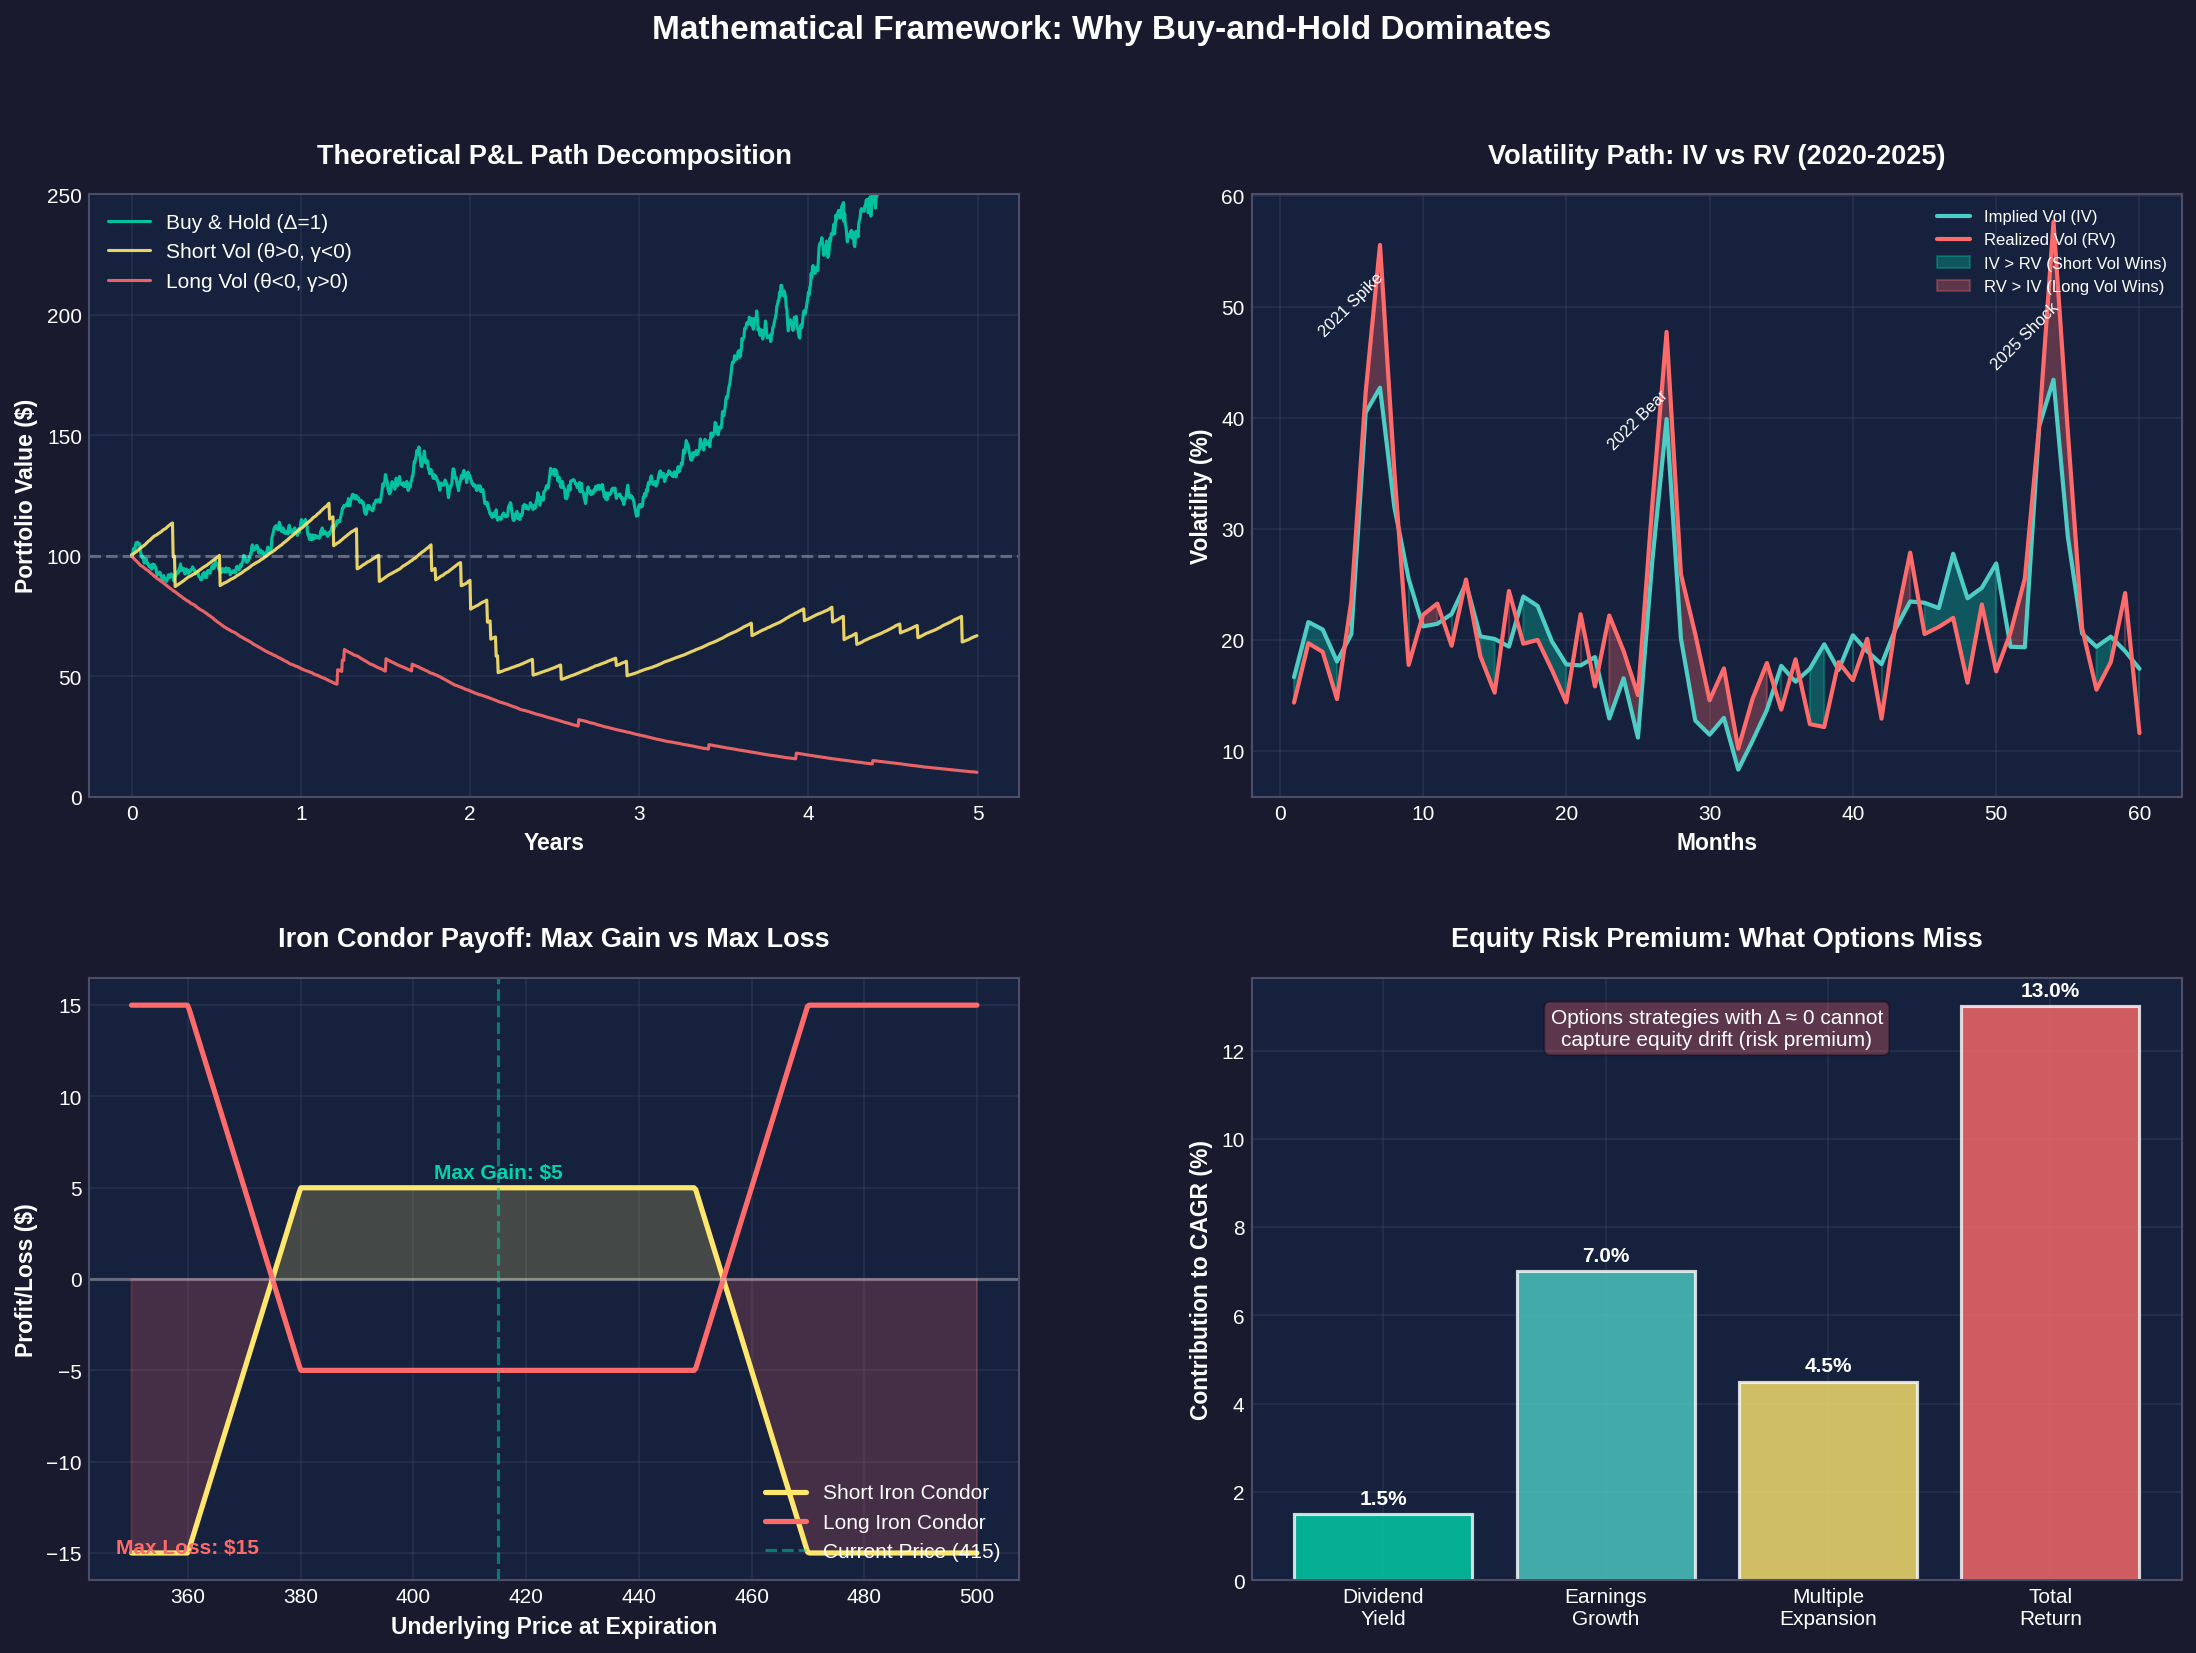
Short Volatility P&L Model
The expected P&L of short volatility trades can be approximated as:
E[P&L_short_vol] ≈ (IV - RV) × t - Σ(tail_losses)Where:
IV = Implied Volatility (what you sell)
RV = Realized Volatility (what actually happens)
t = time
tail_losses = losses from large moves
When tail losses are large:
Σ(tail_losses) ≫ (IV - RV) × tThe data confirms this: Short strategies experienced catastrophic losses during 2022 and early 2025 volatility expansions, with drawdowns exceeding -100% on capital deployed.
Long Volatility P&L Model
Long volatility strategies have the opposite problem:
E[P&L_long_vol] ≈ γ × E[shock_magnitude] - |θ| × tFor this to be profitable requires:
γ × E[shock] > |θ| × tSPX/SPY did not produce sustained volatility at the right times. The volatility spikes were:
Not extreme enough
Not frequent enough
Not persistent enough
Quickly mean-reverting after moves
So theta (time decay) dominated gamma (convexity benefit) over the 5-year window.
4. Iron Condor Mathematics: Capped Upside, Unlimited Downside Frequency
An iron condor is structurally a short variance trade where:
Max Gain = Net Credit
Max Loss = Spread Width - Credit
Typical risk-reward: Risk $5 to make $1
This means a single tail event can wipe out dozens of wins.
Backtest Statistics (SPY Long Iron Condor):
Metric              Value
───────────────────────────────
Profit Rate         27.13%
Loss Rate           72.87%
Average Win         $416.04
Average Loss        -$199.86
Max Drawdown        -100.88%
This reflects negative convexity with γ < 0. Negative gamma means losses accelerate during volatile moves.
Buy-and-Hold has γ = 0, therefore no convexity penalty.
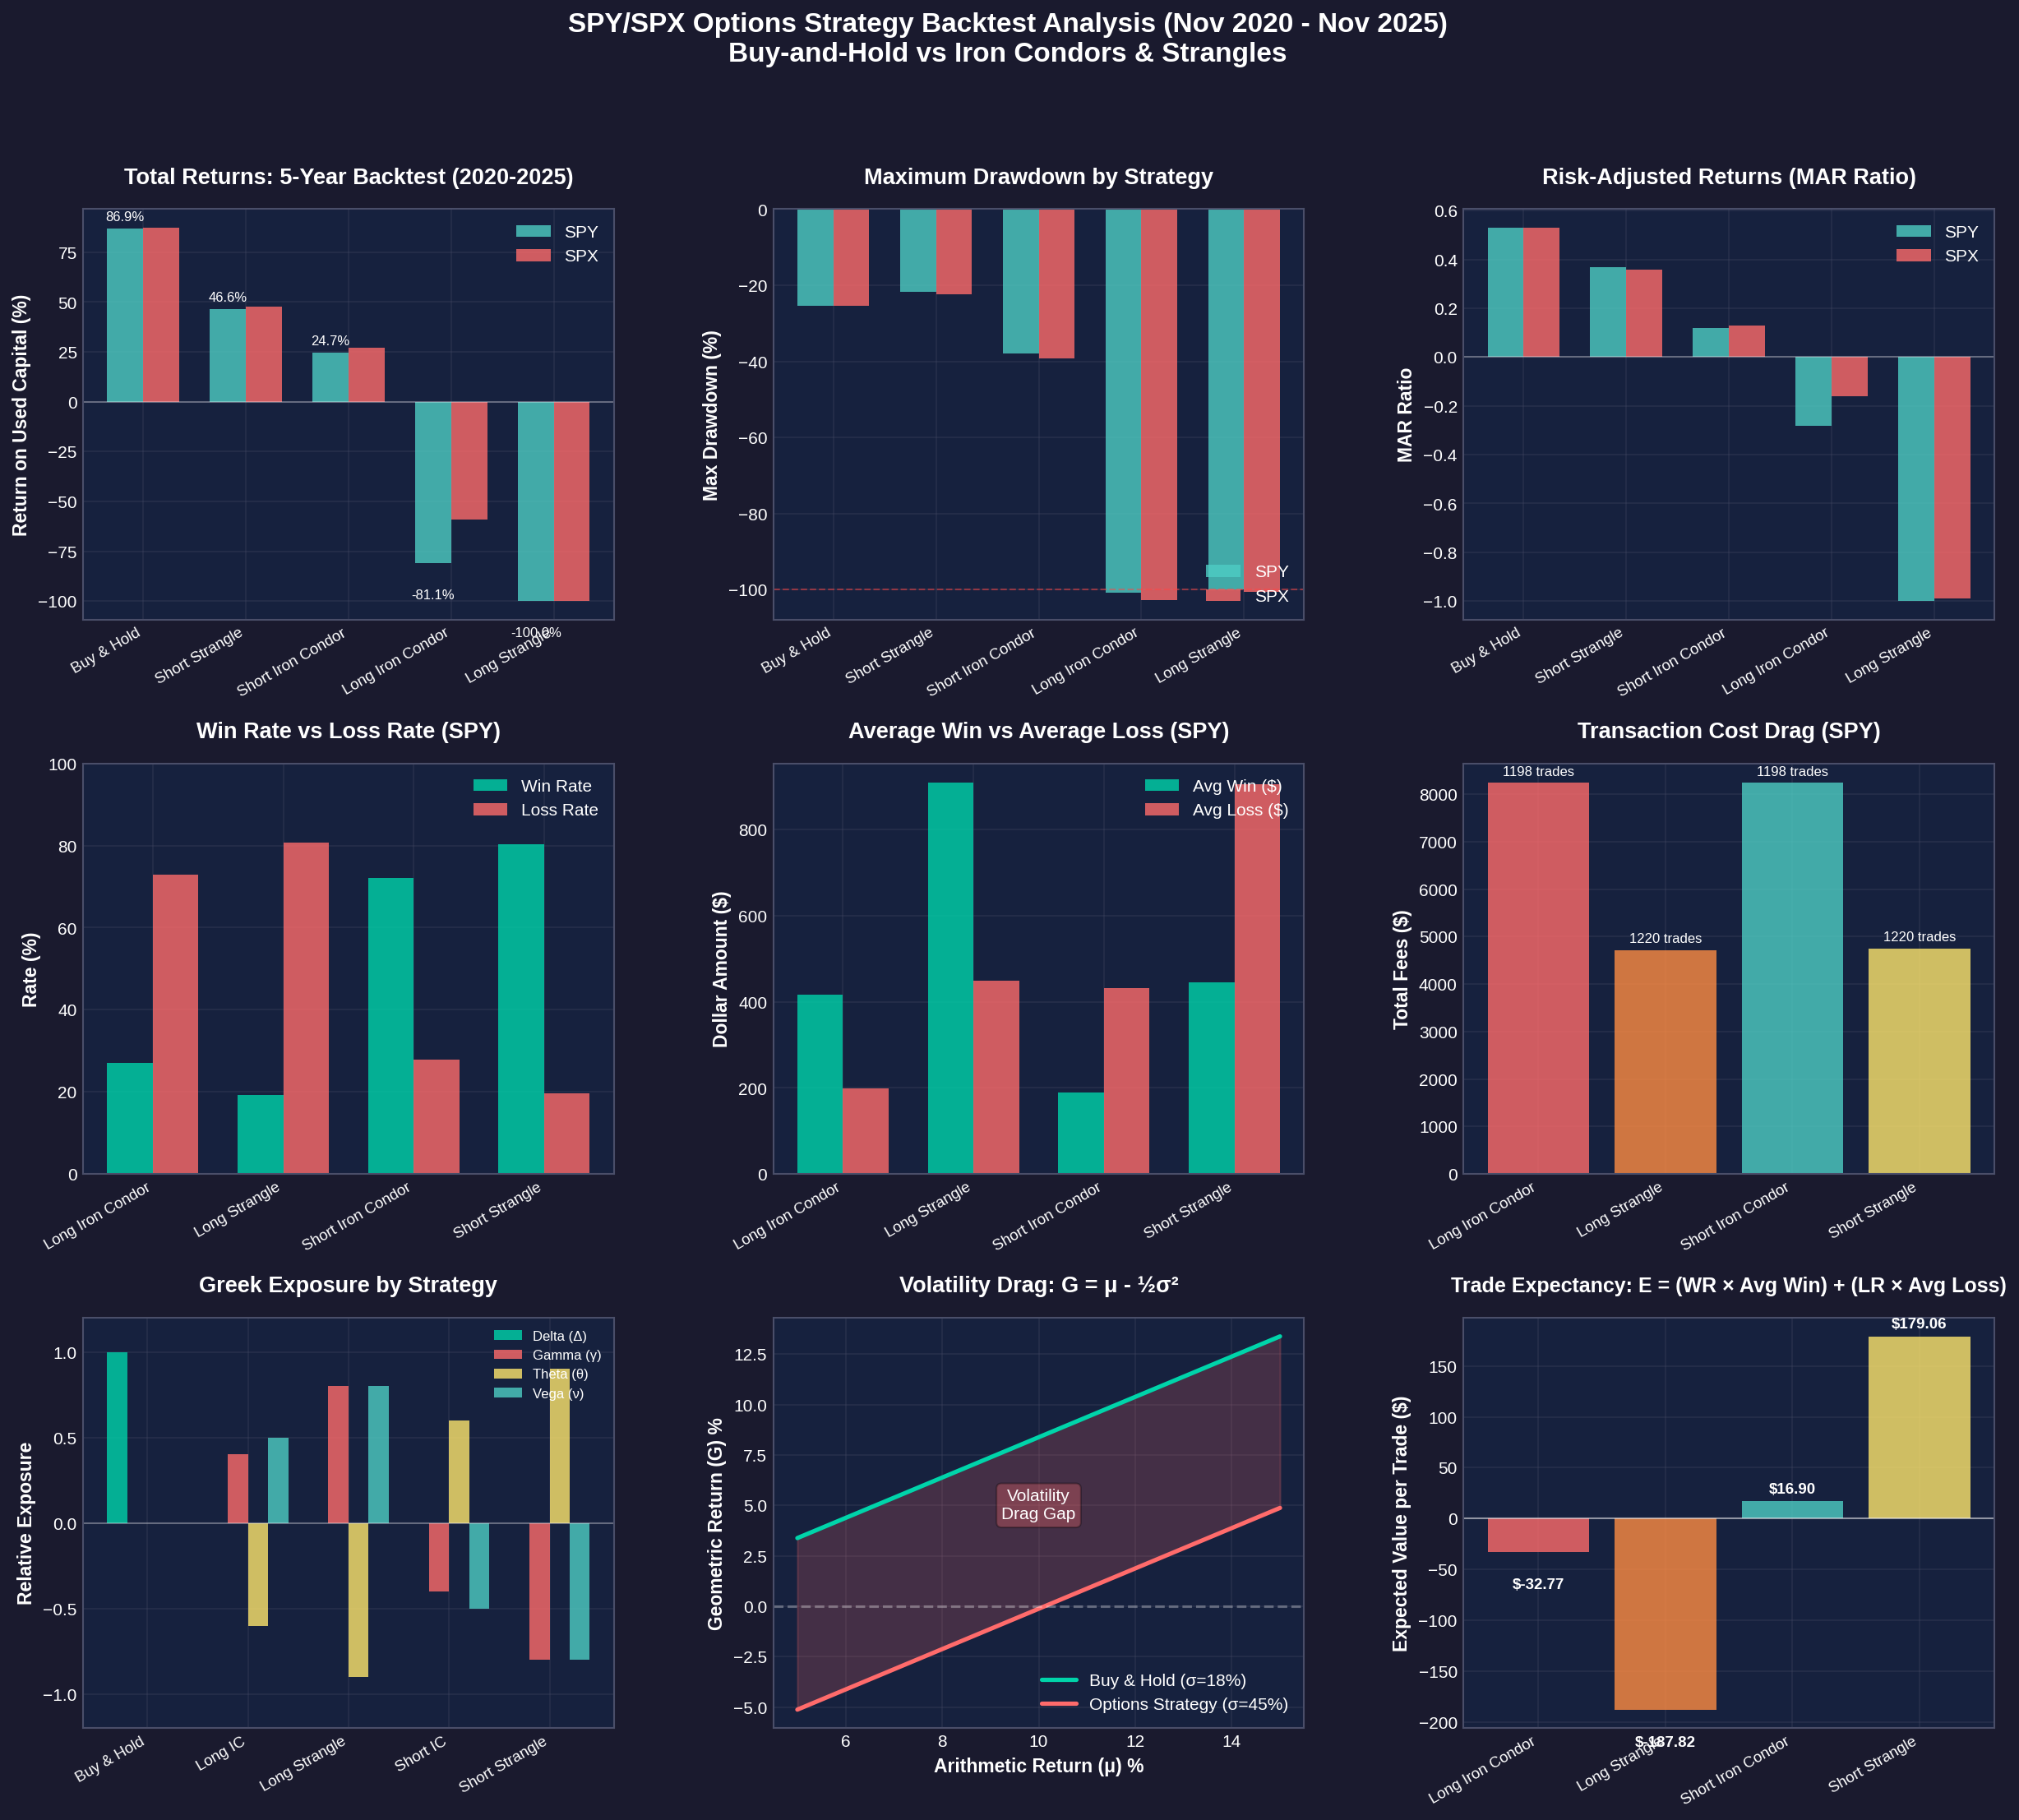
The Expectancy Problem
Trade expectancy is calculated as:
E = (WR × Avg_Win) + (LR × Avg_Loss)For the Long Iron Condor:
E = (0.2713 × $416.04) + (0.7287 × -$199.86) = -$32.77 per tradeOver 1,198 trades, this compounds to massive losses.
5. Long Strategies: Theta Decay Dominates Gamma Benefit
Long ICs and long strangles are long convexity trades with:
γ > 0 (positive gamma)
θ ≪ 0 (large negative theta)
Their expectancy formula becomes:
E[P&L] = γ × (Shock_Frequency × Shock_Magnitude) - |θ| × tThe Critical Threshold
For profitability, the following inequality must hold:
γ × σ²_realized > |θ|Where σ²_realized is the actual variance of the underlying.
During 2020-2025, this threshold was rarely crossed because:
Volatility spikes were brief
Vol quickly mean-reverted
The drift component dominated shock component
Premium paid for convexity exceeded realized benefits
Long Strangle Results (SPY):
Metric                  Value
─────────────────────────────────────
Profit Rate             19.26%
Loss Rate               80.74%
Average Win             $908.53
Average Loss            -$449.35
Total Premium Paid      -$595,395
Return on Capital       -100%
The strategy bled to zero from theta decay over 5 years.
6. Geometric Return Mathematics: The Volatility Drag Problem
The geometric return of Buy-and-Hold is:
G_B&H = μ - ½σ²Where:
μ = arithmetic mean return
σ = volatility of returns
Options strategies have significantly higher variance (σ²) in P&L because:
They reset frequently (1,198-1,220 trades)
Each trade has capped gains or fat-tailed losses
Bid/ask spreads add noise
Rolling and slippage add variance
Thus:
G_options = μ_options - ½σ²_optionsSince:
σ²_options ≫ σ²_B&HWe get:
G_options < G_B&HEven if arithmetic returns were equal, the higher variance of options strategies creates a “volatility drag” that destroys geometric compounding.
Numerical Example
Assume both strategies have μ = 10% arithmetic return:
Strategy        σ       Vol Drag (½σ²)    Geometric Return
────────────────────────────────────────────────────────────
Buy & Hold      18%     1.62%             8.38%
Options         45%     10.13%            -0.13%
The options strategy turns a positive arithmetic return into a negative geometric return purely through variance.
7. Transaction Costs: The Silent Killer
Strategy              # Trades    Total Fees
─────────────────────────────────────────────
Buy & Hold            1           $0
Long Iron Condor      1,198       $8,236.52
Long Strangle         1,220       $4,714.88
Short Iron Condor     1,198       $8,236.52
Short Strangle        1,220       $4,751.48
Even if expectancy were neutral, the fee drag alone explains long-run underperformance.
Each options trade involves:
Bid-ask spread crossing (4 legs for IC)
Commissions per contract
Rolling costs when managing positions
Assignment/exercise fees
Buy-and-Hold trades once.
8. The Greek Framework: Why Buy-and-Hold Has Structural Advantage
Greek       Buy & Hold   Short IC   Long IC   Short Strangle   Long Strangle
──────────────────────────────────────────────────────────────────────────────
Δ (Delta)   +1.00        ~0         ~0        ~0               ~0
γ (Gamma)   0            -Medium    +Medium   -High            +High
θ (Theta)   0            +Medium    -Medium   +High            -High
ν (Vega)    0            -Medium    +Medium   -High            +High
Why This Matters
Buy-and-Hold benefits from:
High Δ (captures equity drift)
No θ (no time decay)
No γ (no convexity penalty/benefit)
No vega risk (immune to IV changes)
Positive drift (equity risk premium)
Options spreads suffer from:
Reduced/neutralized Δ
Added negative θ (long vol) or convexity risk (short vol)
Constant rolling requirements
Large frictional costs
Volatility expansion damage
9. Equity Return Decomposition: What Options Miss
Long-run equity returns mathematically decompose as:
Total Return = Dividend Yield + Earnings Growth + Multiple ExpansionApproximate SPY CAGR breakdown (2020-2025):
Component             Contribution
────────────────────────────────────
Dividend Yield        ~1.5%
Earnings Growth       ~7.0%
Multiple Expansion    ~4.5%
────────────────────────────────────
Total                 ~13.0%
Options strategies with Δ ≈ 0 cannot capture this equity risk premium.
They are essentially betting on:
Volatility mispricing (short vol)
Tail events (long vol)
Mean reversion (iron condors)
Rather than:
Corporate earnings growth
Dividend streams
Long-term multiple expansion
10. When These Strategies Would Work (Regime Analysis)
Short Strangles and Short Iron Condors (short γ, short ν)
Work well when:
Markets are range-bound (Δ ≈ 0 exposure is advantageous)
Realized vol < Implied vol persistently
Large shocks are infrequent
Trends are slow and drifty
Volatility mean-reverts quickly
Term structure is in contango
Ideal mathematical environment:
γ < 0 but low risk because price stays inside range
θ > 0 provides steady carry
ν < 0 works because IV slowly decays
Translation: Calm, sideways, choppy, low-trend markets.
Examples: Parts of 2017, 2019, and parts of 2023–2024
Long Iron Condors and Long Strangles (long γ, long ν)
Work well when:
Realized vol ≫ Implied vol
Large tail events cluster together
Price moves explosively in either direction
Implied vol is underpricing risk
Volatility of volatility is high
Ideal mathematical environment:
γ > 0 generating convex gains
ν > 0 because IV expands after entry
θ < 0 but γ + ν > θ
Translation: Crisis periods, regime shifts, black swan clusters.
Examples: 2008, March 2020, Flash crashes
SPX/SPY in 2020–2025 only had brief vol spikes — not enough for sustained profitability.
11. The Deepest Reason: Options Cannot Capture Equity Drift
Options = mean reversion bet
Equities = long-term drift bet
All four option structures do one of the following:
Neutralize delta (iron condors, strangles)
Fight the drift with opposing convexity (short vol)
Bleed theta trying to catch gamma (long vol)
During 2020–2025, the drift won decisively.
In a world with an equity risk premium, Buy-and-Hold is not just simpler — it is mathematically advantaged.
12. Conclusion and Practical Implications
These backtests illustrate a fundamental truth of quantitative options trading:
When equities trend upward, strategies that suppress delta and introduce theta decay or convexity risk will always underperform.
Short vol died in tail expansions
Long vol died slowly from theta
Iron condors died from both
SPY & SPX simply drifted upward with no structural decay
When Might You Consider These Strategies?
Volatility spikes or anticipated macro events: If you expect an upcoming shock (geopolitical event, rate decision), long-vol trades could pay off — but timing is nearly impossible.
Range-bound markets: In tranquil sideways markets, short premium can work — with tight position sizing and strict risk management.
Tactical hedging: Using options to protect existing equity positions, rather than as standalone alpha generation.
The Hard Truths Remain:
Tail risk is real and underpriced — Short-premium strategies remain fragile
Theta decay and time horizon mismatch — Long-vol needs large moves that don’t come reliably
Transaction costs compound — 1,200 trades × bid-ask spreads × commissions = death by a thousand cuts
Mis-timing is fatal — A bet on “volatility soon” can bleed out waiting
Final Thought
In a bull market with positive drift, the simplest strategy wins.
Options strategies are sophisticated tools for sophisticated problems. But the problem most retail traders face isn’t “how do I extract volatility premium from the variance risk premium” but rather “…how do I participate in long-term wealth creation?”
For that problem, Buy-and-Hold seems to be the mathematically dominant solution in the current market regime.
Backtest Parameters: 45 DTE, 16Δ options, daily entry, SPY/SPX, November 2020 - November 2025. Data Source: TastyTrade backtester.
This post is about methodology, not recommendations. Options and derivatives are complex instruments and this analysis probably contains errors. If you find them, let me know.
The information presented in Math & Markets is not investment or financial advice and should not be construed as such.
I love your content. Props!
This could mean that the recent multi-year up drift move was corrective (down moves in contrast happened fast and with vol jumps) - this might suggest that we could experience in the next few a higher vol up move where eventually delta exp won’t be overwhelmed by theta….