
When the Escalator Becomes an Elevator: Timing Carry Crashes
Part 89 — Three modes of carry failure, early warning signals, and the regime framework for knowing when to step back

This is part 89 of my series — Building & Scaling Algorithmic Trading Strategies
Part 1: What carry actually is. This is part 2 of the Carry Trade series. Part 3: building a multi-asset carry portfolio.
Three Ways to Die
Every carry trade dies the same way — price changes overwhelm the income — but the death comes in three distinct flavors:
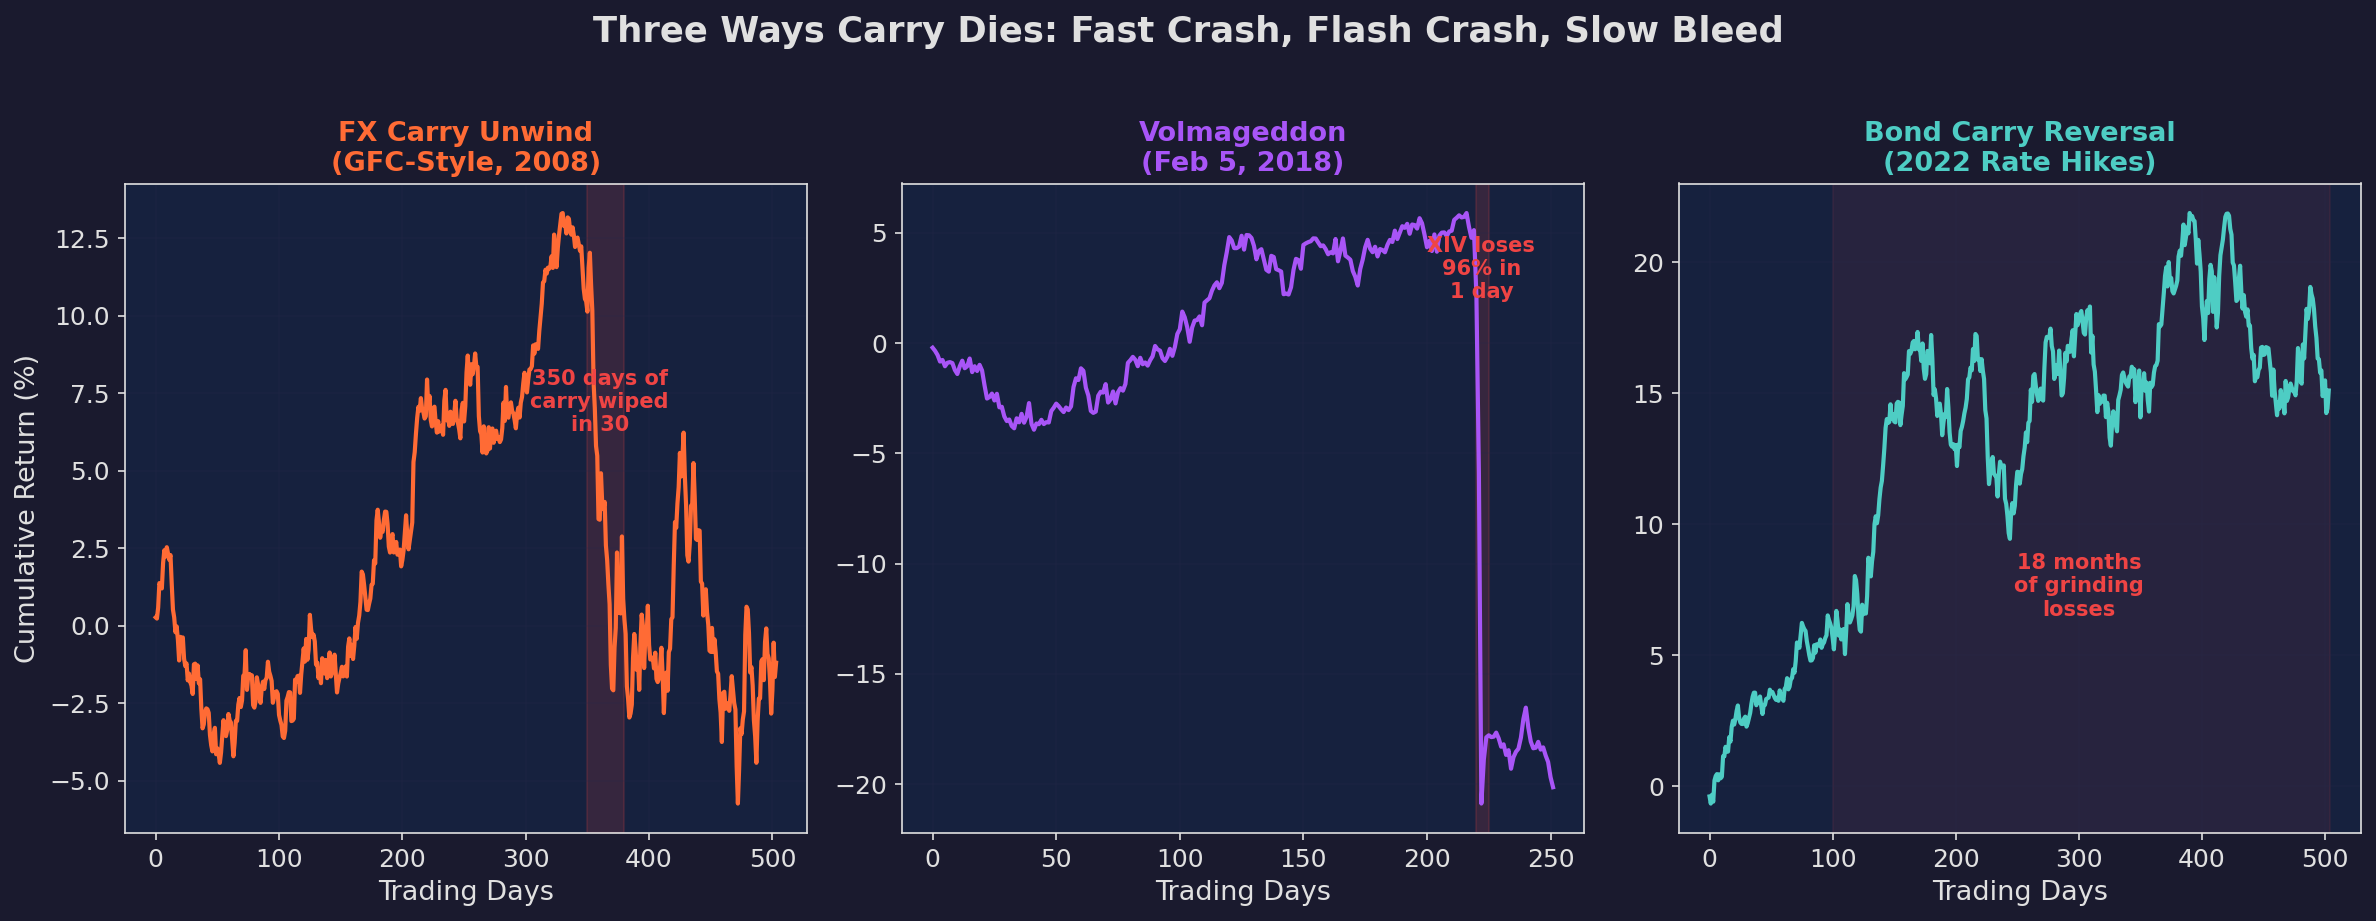
Left: the FX carry unwind (2008-style). A year of steady carry income erased in 30 days as the yen strengthened 25% against carry currencies. Center: Volmageddon (Feb 5, 2018). XIV lost 96% of its value in a single session when the VIX doubled. Right: the 2022 bond carry reversal. Not a crash but 18 months of grinding losses as the Fed hiked 500bps — the carry wasn’t wrong, the regime changed.
These three patterns — fast crash, flash crash, and slow bleed — require different detection methods and different responses.
The fast crash (FX carry, equity carry): A risk-off event triggers unwinding of crowded carry positions. Leveraged carry traders hit margin calls and are forced to sell, creating a feedback loop. The signature: cross-asset correlations spike to near 1.0 as everything carry-related sells off simultaneously.
The flash crash (vol selling): A structural break in the instrument itself. XIV, the short-VIX product, wasn’t just hurt by the VIX spike — its own termination triggered forced covering that amplified the spike. The signature: non-linear, gap-driven, over in hours.
The slow bleed (bond carry, commodity carry): The macro regime shifts. Rate hikes make bond carry negative. Contango in oil makes commodity carry negative. The carry is still accruing, but it’s overwhelmed by adverse price changes month after month. The signature: no single event, just persistent negative returns. Hardest to time because there’s no catalyst to react to.
Early Warning Signals
Can you see carry crashes coming? Well, partially. Research by Brunnermeier, Nagel, and Pedersen (2009) identifies several precursors:
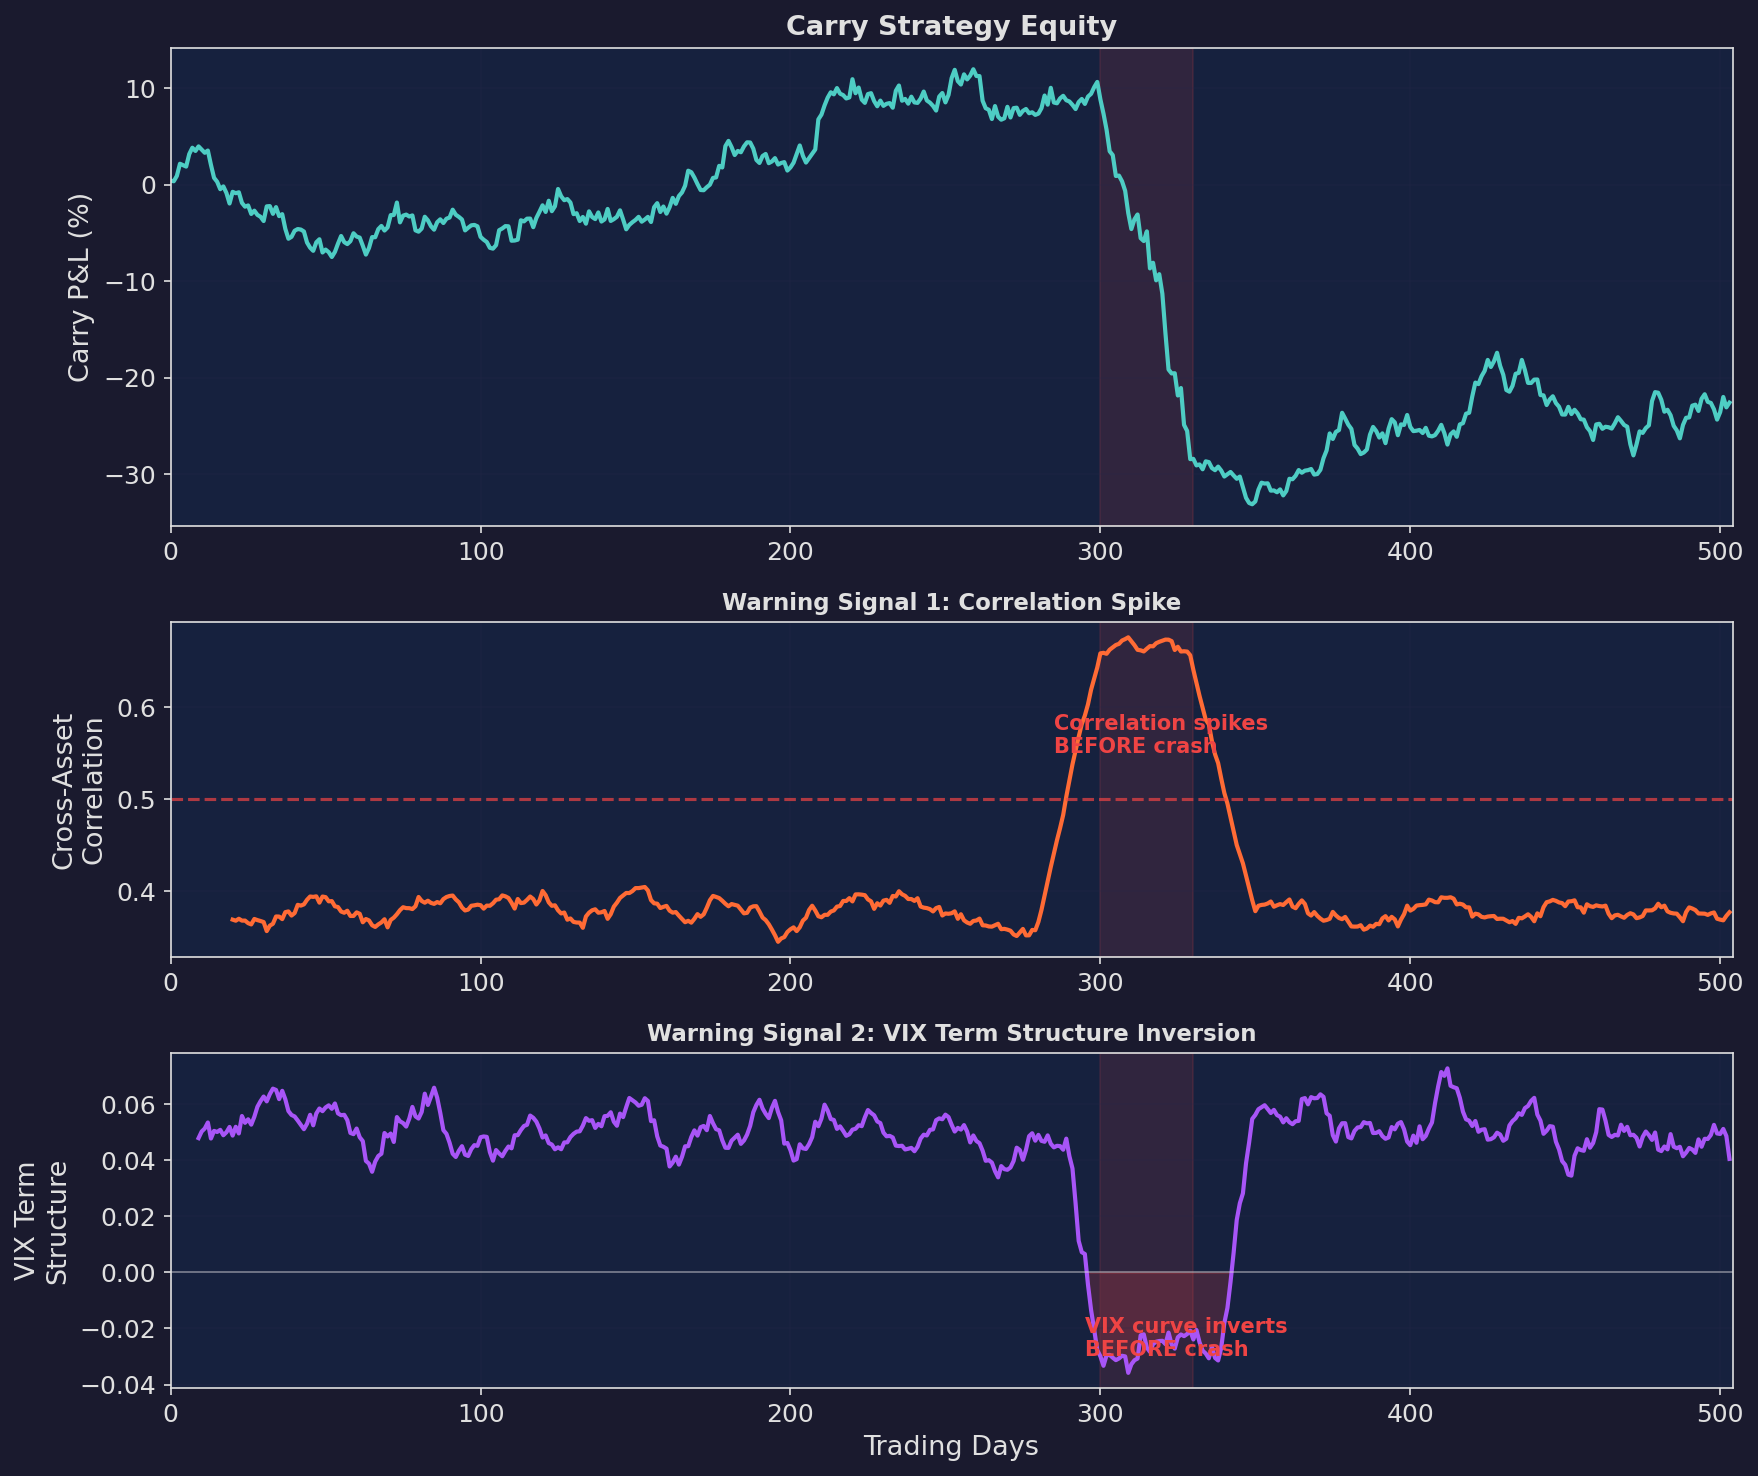
Three panels. Top: carry strategy equity with crash at day 300. Middle: cross-asset correlation rises ~20 days before the crash. Bottom: VIX term structure inverts ~10 days before. Both signals provide warning, but neither is precise — the lead time varies and false alarms are common.
The Warning Dashboard
Four signals to monitor, ranked by reliability:
1. VIX term structure inversion (most reliable). When the front-month VIX exceeds the second-month, it signals that the market is pricing immediate stress. This inverts 70-80% of the time before significant carry drawdowns. Lead time here is 5-15 days.
2. Cross-asset correlation spike. When the 21-day rolling correlation across carry strategies (FX, bonds, equities) exceeds 0.5, it signals that the “carry factor” is under stress. Lead time is 10-30 days.
3. Credit spreads widening. IG and HY credit spreads are a leading indicator of funding stress. When spreads widen by more than 1 standard deviation from their 63-day mean, carry trades become more fragile. Lead time would be 5-20 days (big challenge here is the width of time).
4. Carry crowding indicators. CFTC positioning data shows speculative positioning in carry currencies and vol instruments. Basically, extreme crowding increases crash risk. Lead time is weeks to months, but pretty imprecise.
As you can see, none of these are precise enough to time the bottom tick. But collectively, they tell you when to scale down from 100% to 30-50% — and that’s enough to avoid the worst of the damage.
The Carry Regime Framework
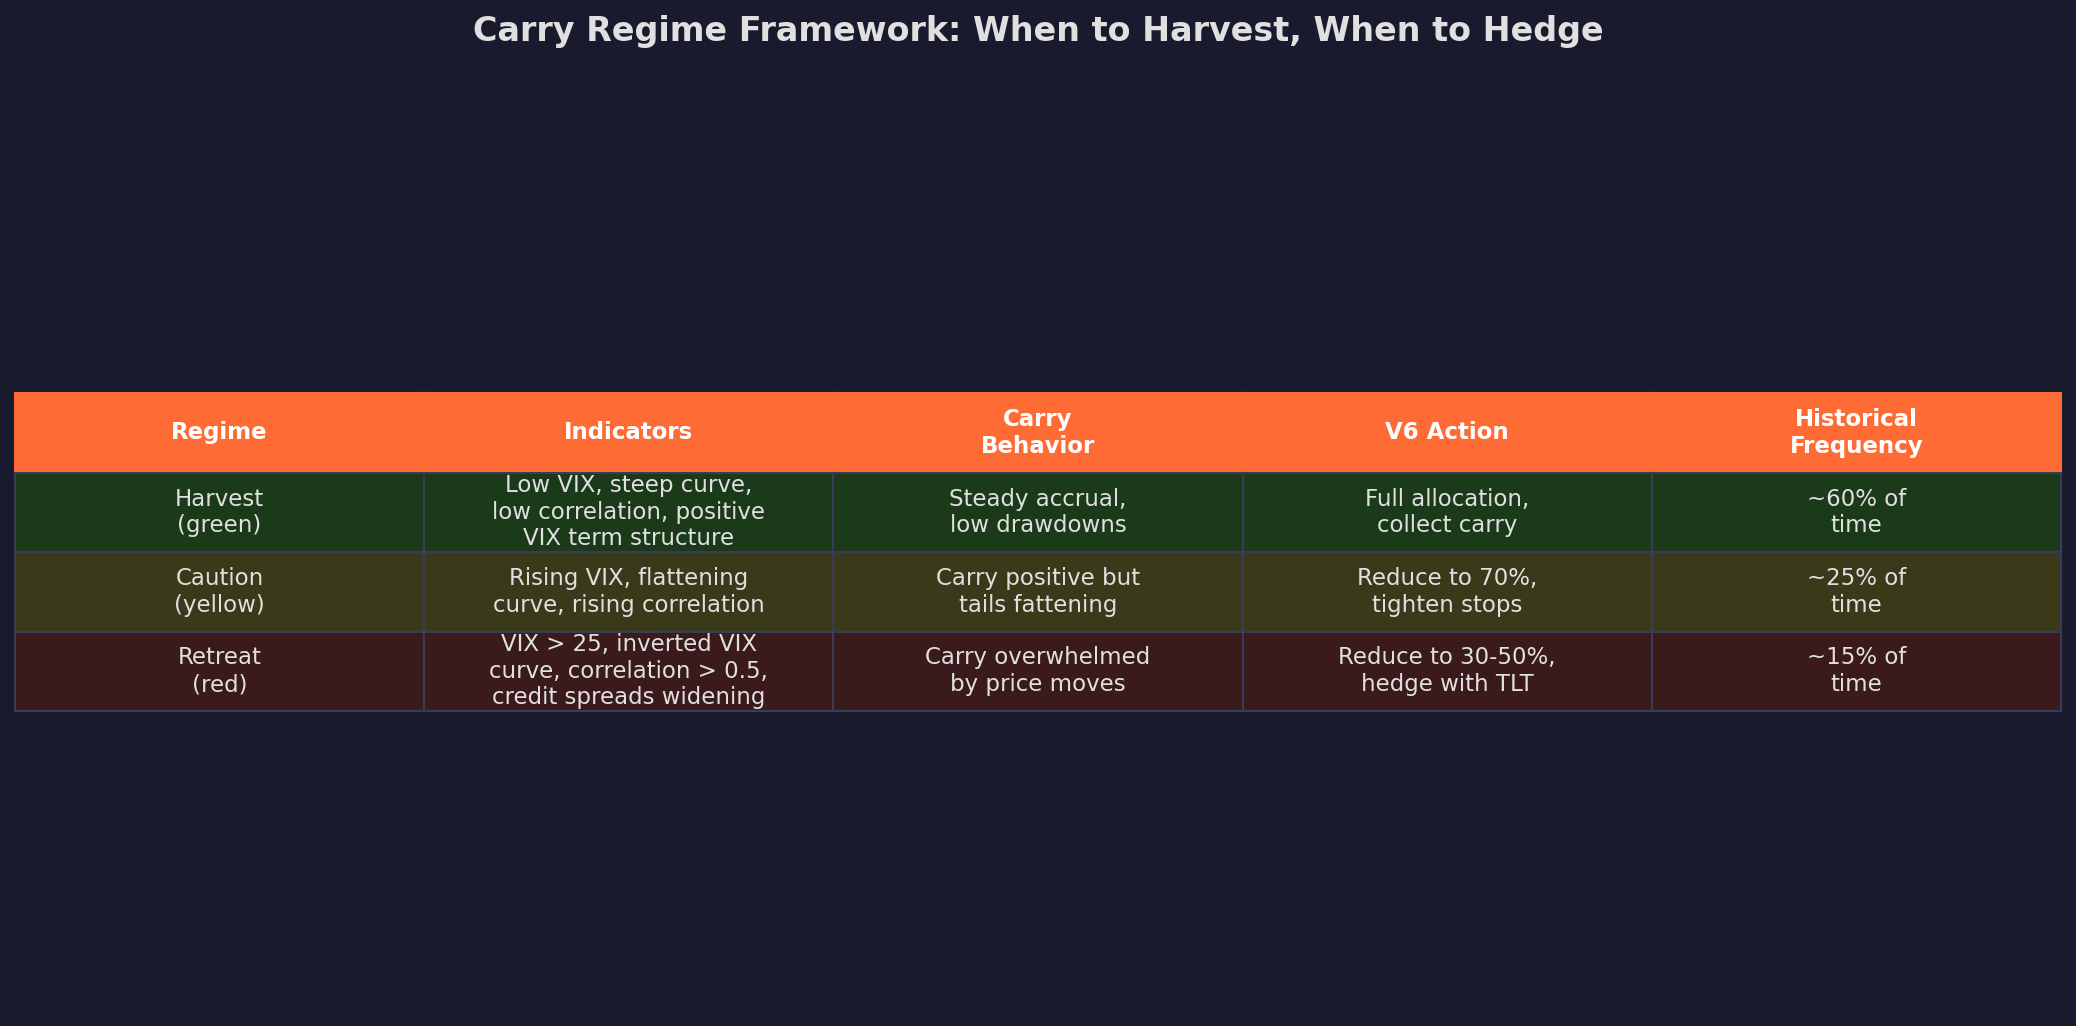
The framework maps to V6’s existing VIX regime filter. In the green regime (VIX < 20, steep curve, low correlation), V6 is already running at full allocation — and carry is accruing. In the red regime (VIX > 25, inverted term structure), V6 should already be scaling down — which protects carry too.
The insight: V6’s regime filter is already a carry timing mechanism, even though it wasn’t designed as one. The VIX regime tracks the same underlying conditions that determine carry profitability.
Carry Returns Are Regime-Dependent
This point deserves its own chart:
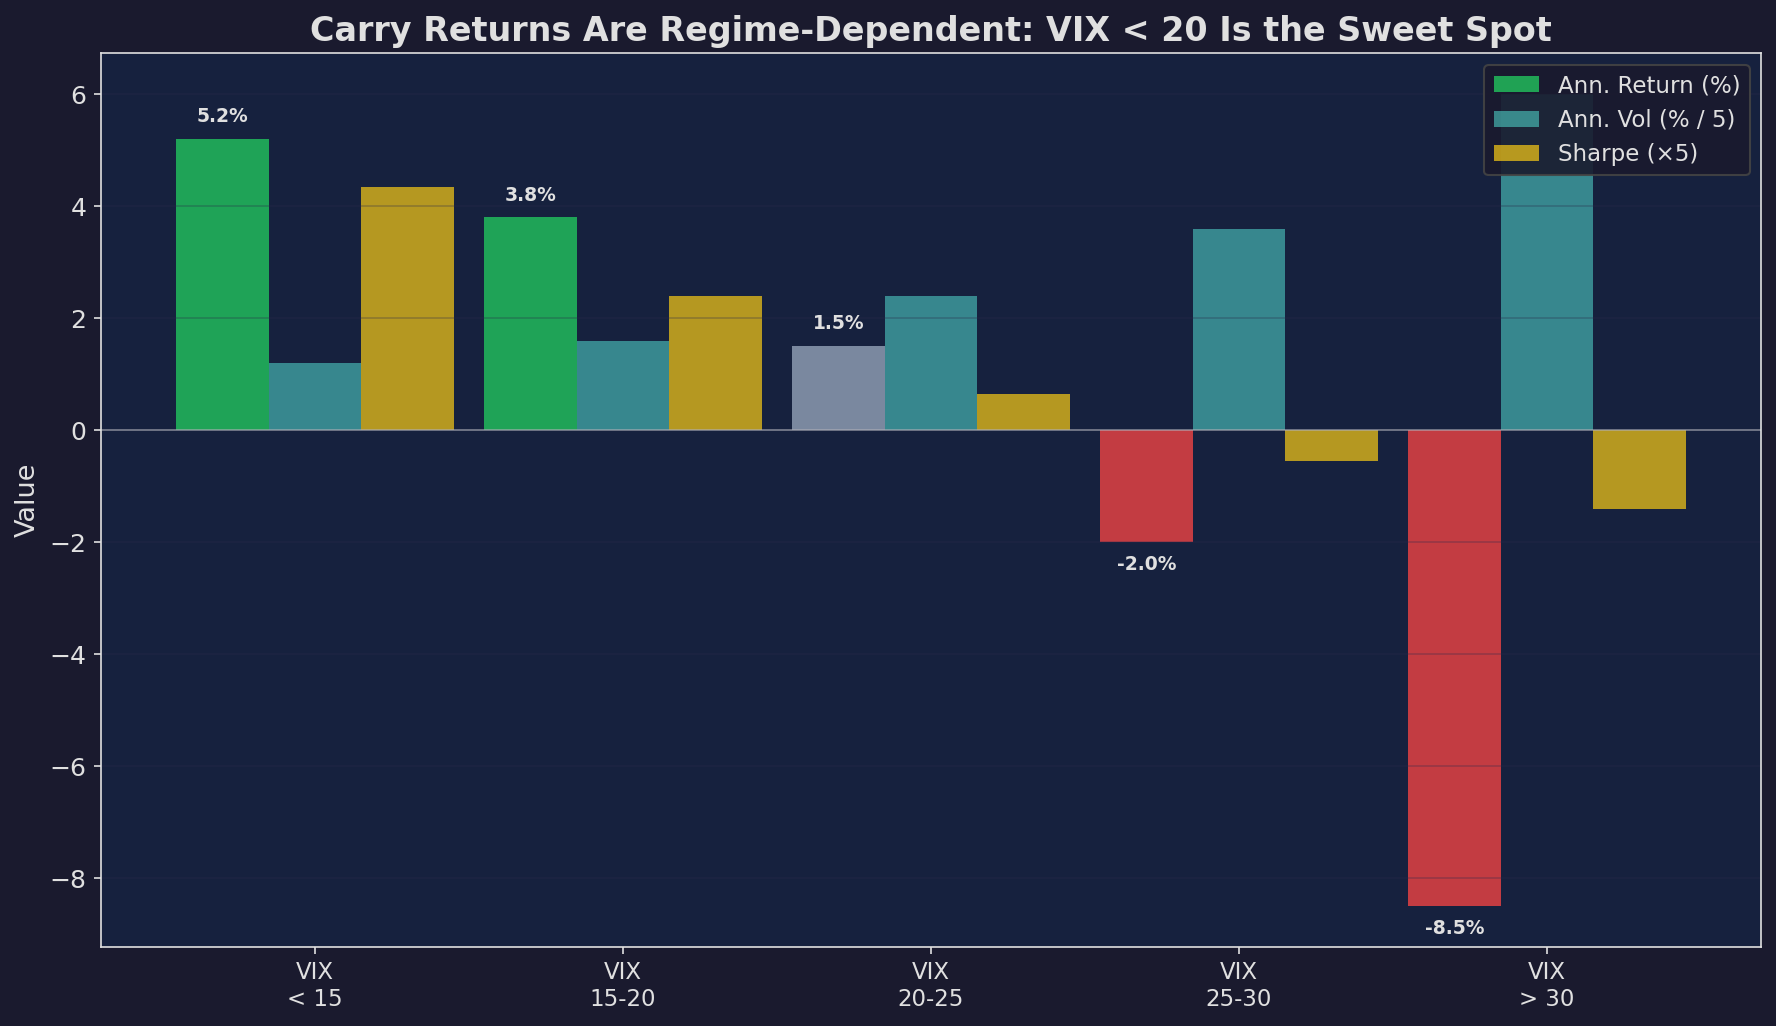
Carry returns conditioned on VIX level. When VIX is below 15, carry earns ~5.2% annualized with a 0.87 Sharpe. When VIX exceeds 30, carry loses 8.5% with a -0.28 Sharpe. The strategy only “works” in calm markets — which is fine, because that’s most of the time.
The implication is clear: carry is not a strategy you run all the time. It’s a strategy you run when conditions are favorable and shut down when they’re not. The timing decision — harvest vs. retreat — accounts for more of the total return than the carry level itself.
Timed vs. Untimed Carry
What happens when you apply regime scaling?
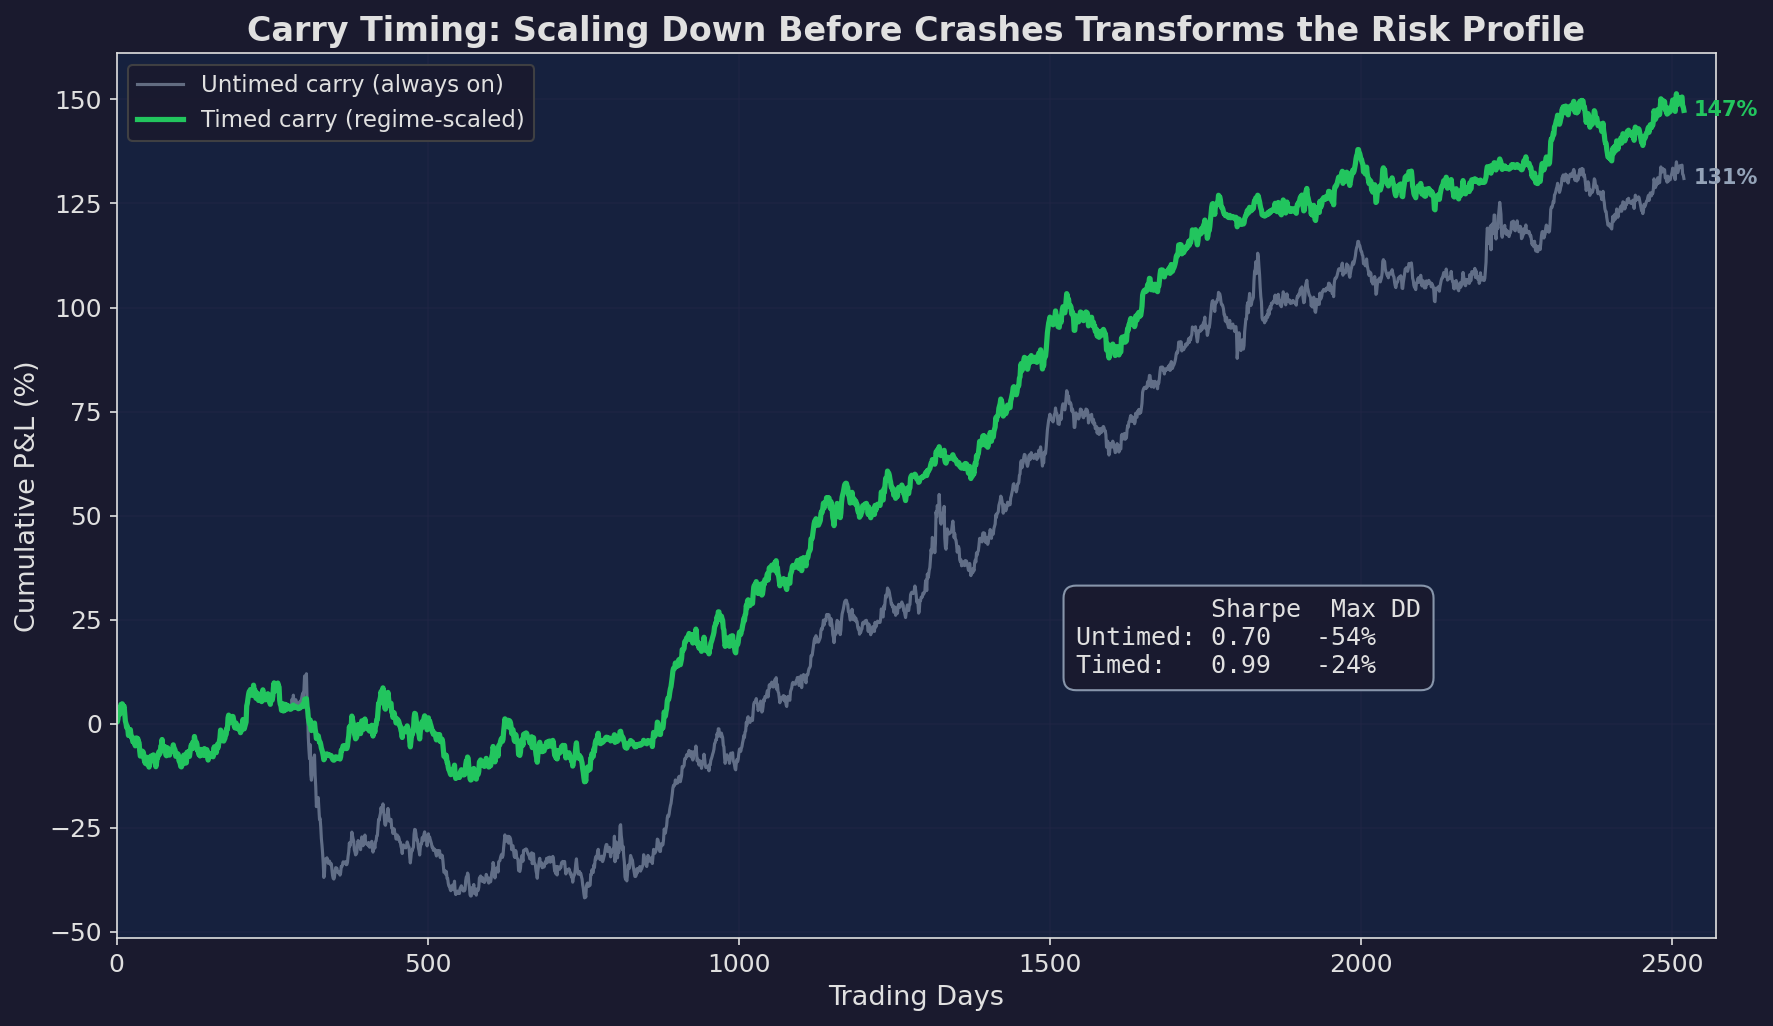
Gray: untimed carry (always on). Green: timed carry (scale to 30% when signals flash). Timed carry sacrifices some return but dramatically improves the Sharpe and cuts the worst drawdowns. The regime signals don’t need to be perfect — even a crude VIX > 25 filter captures most of the benefit.
The improvement is similar to what we saw with GEX conditioning in Part 85 (Microstructure series): you’re not predicting crashes, you’re reducing exposure when the environment is hostile. The carry still works — you’re just not sitting at full size when it’s most likely to reverse.
The Connection to V6’s Architecture
V6 already does carry timing — it just doesn’t call it that. Here’s the mapping:
V6 Component          → Carry Timing Function
─────────────────────────────────────────────────
VIX < 20: full TQQQ   → Harvest equity carry + VRP
VIX > 30: shift to TLT → Harvest bond carry instead
CUSUM alarm            → Scale down all carry exposure
Momentum threshold     → Avoid negative price-change periods
Microstructure layer   → Scale down when execution costs
                         erode carry income
Every layer of V6 that we’ve built across 89 posts — the regime filter, the momentum signals, the CUSUM monitoring, the microstructure layer — is also a carry timing mechanism. This isn’t a coincidence. Good strategies manage their carry exposure whether or not they explicitly think about it that way.
Up Next
Part 3: Building the Multi-Asset Carry Portfolio — Can we add explicit carry streams to V6? Bond curve optimization, the carry-momentum interaction, and what it would take to build a proper multi-asset carry strategy.
Remember: Alpha is never guaranteed. And the backtest is a liar until proven otherwise.
The material presented in Math & Markets is for informational purposes only. It does not constitute investment or financial advice.
Thanks for reading Math & Markets! Subscribe for free to receive new posts and support my work.