
The Mispricing Map: Three Hypotheses for SaaS Value in the AI Era
Part 77 — SaaS Series Part 3 of 4

This is part 77 of my series — Building & Scaling Algorithmic Trading Strategies
In Part 1, I mapped the SaaSpocalypse — $300B in market cap erased, growth decelerating to 12%, multiples compressed 65% from peak. In Part 2, I built a four-factor model adapted for SaaS: Efficiency Value, Quality Moat, AI Positioning, and Adjusted Momentum.
Now I want to do something harder: make specific, falsifiable claims about where I think value exists in this market. Three hypotheses, each grounded in the quantitative framework, with clear confirmation and invalidation criteria.
At the end of the day, it’s easy to say “SaaS is cheap, buy the dip.” It’s harder to say “this specific subset of SaaS is mispriced for these specific reasons, and here’s what would prove me wrong.” The latter is what makes a hypothesis tradeable so that’s what I am looking to achieve.
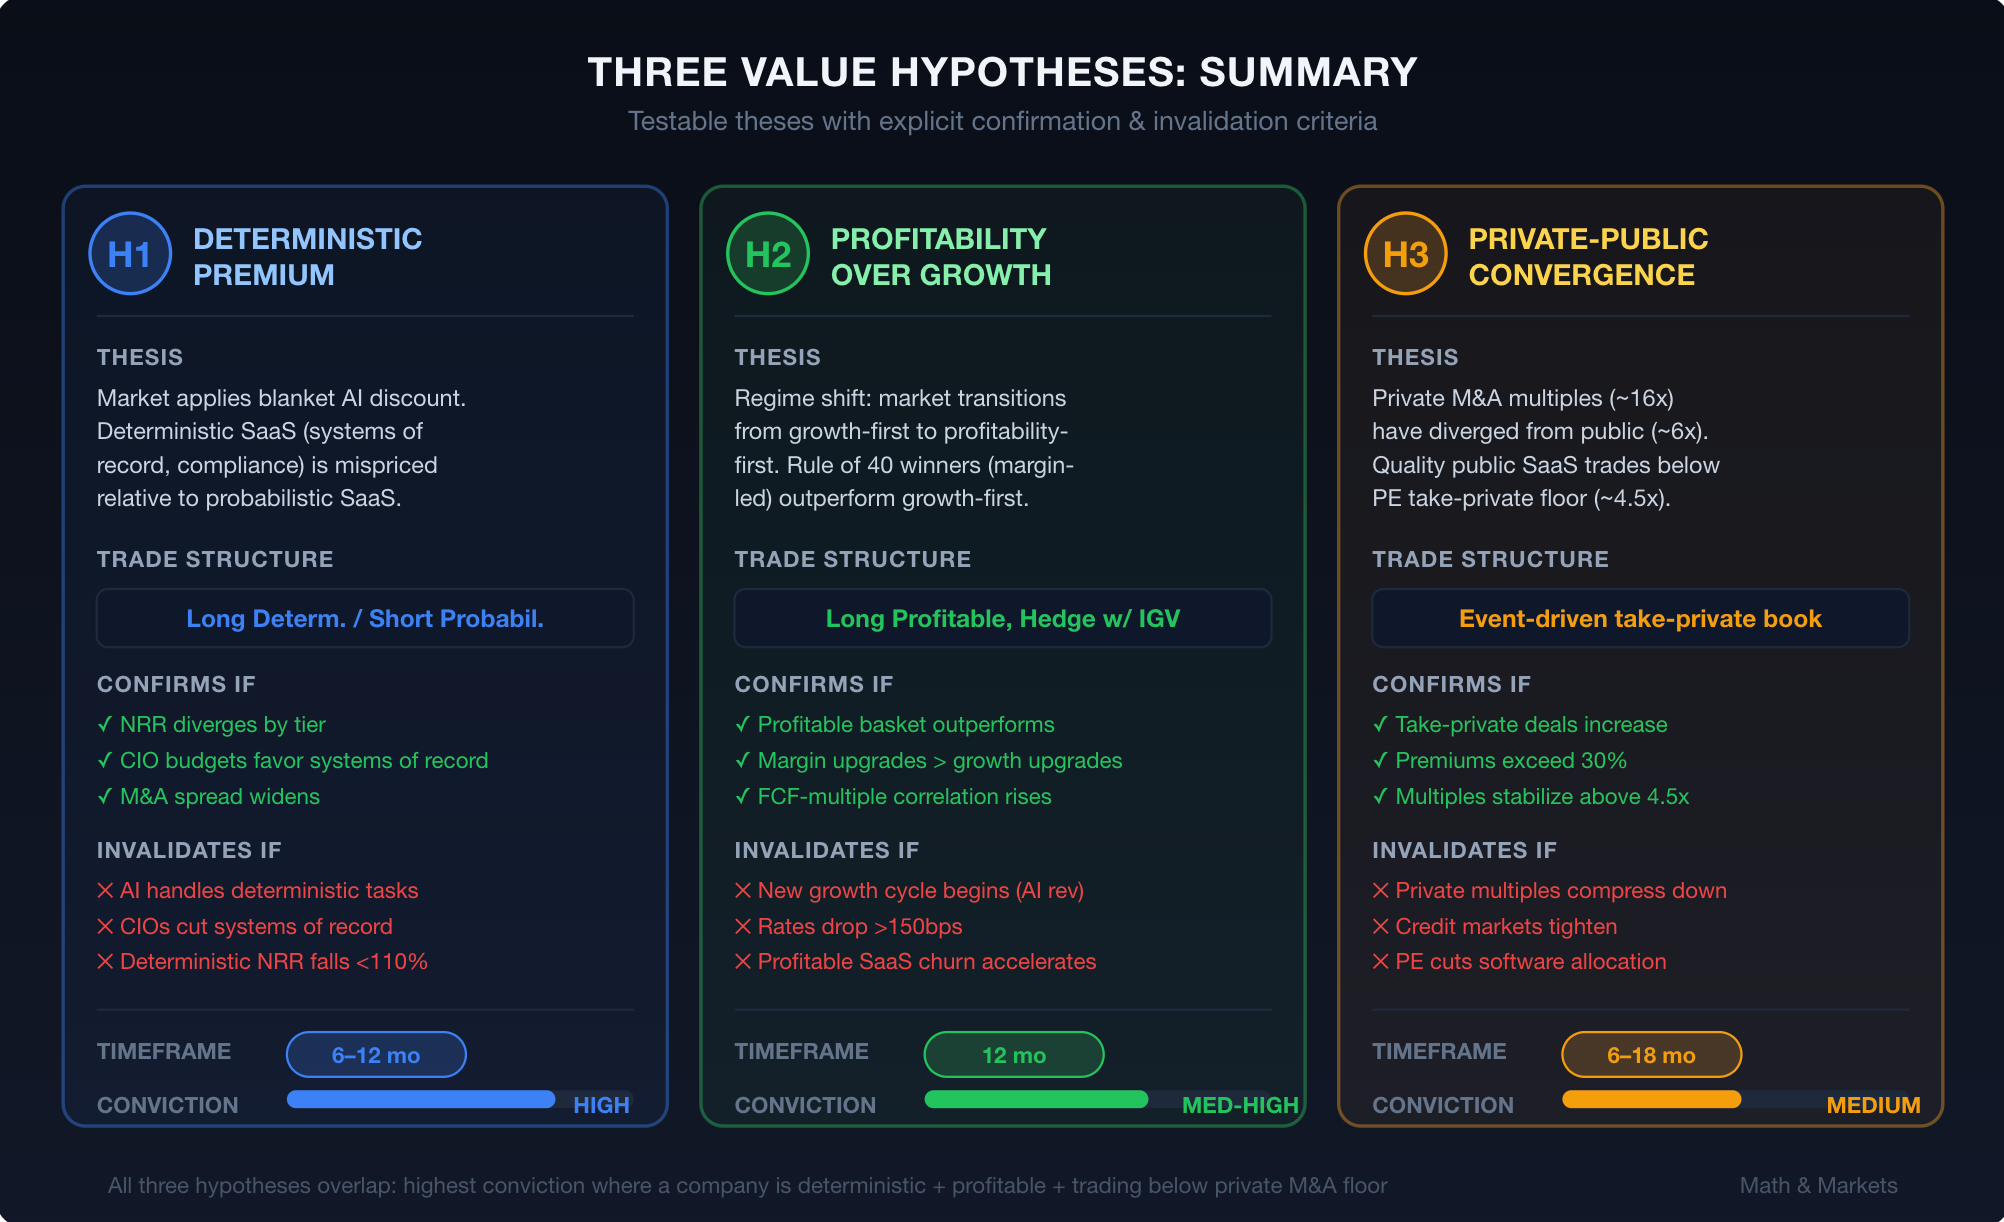
Hypothesis 1: The Deterministic Premium Is Under-Priced
The Thesis
The market is applying a blanket AI-disruption discount across the entire SaaS sector, but the actual disruption risk is concentrated in probabilistic-system SaaS (content tools, basic analytics, template workflows). Deterministic-system SaaS — companies whose products are systems of record requiring precision, compliance, audit trails, and complex state management — faces minimal displacement risk and is being dragged down by sector-wide contagion.
The spread between deterministic and probabilistic SaaS multiples should be wider than it currently is. The market will eventually re-rate deterministic SaaS upward relative to the sector, or probabilistic SaaS will continue falling, or both.
My Rationale
There’s a fundamental asymmetry in how AI disrupts software. A former Microsoft manager, quoted in enterprise CIO surveys, put it bluntly: “A ‘reality check’ is occurring among CIOs as they realize LLMs lack the deterministic consistency required for critical industries like financial services. For use cases such as underwriting, a system that provides a correct answer six out of ten times is insufficient; these processes demand 100% consistency.”
Consider what happens when AI gets it wrong in different contexts:
AI writes a mediocre blog post → you rewrite it. Cost: 20 minutes.
AI generates an incorrect financial reconciliation → cascading errors through downstream systems, regulatory exposure, audit failure. Cost: potentially catastrophic.
This asymmetry means enterprises will continue paying premium prices for deterministic systems even as they ruthlessly cut spending on probabilistic ones. Bain’s 2025 framework explicitly identifies deterministic workflows as “core strongholds” where AI enhances rather than replaces SaaS.
The empirical support is emerging. Security companies (CrowdStrike, Zscaler, Palo Alto Networks, Rubrik) maintained premium valuations throughout 2025. Analytics & Data Management expanded its EV/TTM revenue multiple by 11% while the broader SaaS index declined. DevOps commands 36.5x EBITDA multiples. These are all high-deterministic categories.
Quantifying the Opportunity
As of December 2025, the median EV/Revenue for public SaaS was 5.1x. But within this:
Cybersecurity and data infrastructure leaders: 8-12x
Mission-critical workflow automation (ServiceNow, Guidewire): 7-10x
General-purpose SaaS (content, marketing, basic CRM): 3-5x
Vulnerable probabilistic SaaS: 2-4x and falling
If you believe the deterministic/probabilistic distinction is structurally durable — and the CIO spending data supports this — then a long deterministic / short probabilistic relative value trade captures the spread widening without taking directional market risk.
Confirmation Criteria
Q1-Q2 2026 earnings show NRR and growth acceleration for deterministic SaaS relative to sector
Enterprise spending surveys show continued/increased budgets for systems of record
M&A multiples for deterministic targets remain above 8x while probabilistic targets trade below 5x
The spread between top-quartile and bottom-quartile SaaS EV/Revenue multiples widens beyond current levels
Invalidation Criteria
AI capabilities demonstrably improve in deterministic domains (e.g., reliable financial reconciliation, compliant audit trails)
Enterprise CIOs begin redirecting budgets away from traditional systems of record
Deterministic SaaS NRR falls below 110% for major names
Major AI lab ships a product that credibly replaces a deterministic system of record (not just a demo — actual enterprise adoption)
Timeframe
6-12 months. The next two earnings cycles should provide enough data to confirm or reject.
Hypothesis 2: The Rule of 40 Breakout — Profitability Will Be Rewarded More Than Growth
The Thesis
The market is transitioning from a growth-first to a profitability-first valuation regime for SaaS. Companies that have crossed the profitability threshold — particularly those with Rule of 40 scores above 40% driven primarily by margins rather than growth — will systematically outperform their growth-first peers over the next 12 months.
This is not the consensus view — if anything, the current consensus is “buy the AI-enabled high-growth names.” I think this is wrong. In a sector facing margin compression from AI commoditization, the companies that have already demonstrated structural profitability have a durability advantage that the market is underweighting.
My Rationale
The academic evidence is clear on one thing. The Fama-French profitability factor (RMW) has been the single most reliable factor premium across all time periods since 1963. The CFA Institute’s analysis found it to be “the single factor that has consistently delivered excess returns.” Going long profitable firms and shorting unprofitable ones has worked across market regimes.
Applied to SaaS specifically, the mechanism is different from traditional industries but the logic holds. Profitable SaaS companies:
Don’t need external capital. In a higher-rate environment, this matters. Companies burning cash to fund growth face dilution risk, financing risk, and increased sensitivity to capital market conditions. Profitable companies are self-funded.
Can invest counter-cyclically. When competitors are cutting, profitable companies can acquire talent, acquire customers, and acquire companies. The SEG 2026 Report notes that “established SaaS players dominate enterprise deals, using credibility and cash to fuel acquisitions.”
Have proven unit economics. A company with 80% gross margins, 110% NRR, and positive free cash flow has empirically demonstrated that its customers value the product at a price that exceeds the cost of delivering it. In an environment where AI threatens to commoditize features, this proven pricing power is defensive.
Trade at lower multiples with higher floors. Growth SaaS can lose 50%+ of its market cap if growth decelerates by a few percentage points because the multiple compression compounds with the earnings miss. Profitable SaaS has a floor: even at zero growth, the cash flows have positive present value.
Eqvista’s SaaS Index data shows the market still rewards growth over profitability — companies prioritizing revenue growth over margins achieve higher valuations. But I believe this relationship is inverting. The Hype Factor, which Eqvista tracks as a measure of investor sentiment, collapsed from 8.36x in Q1 2022 to 0.90x in Q2 2023 and has only recovered to 4.71x. The market is sobering up, and sober markets pay for profitability.
Constructing the Factor Basket
Screen for:
Rule of 40 score > 40%, with at least 20 percentage points contributed by margin (not just growth)
Free cash flow positive for at least four consecutive quarters
Gross margins > 75%
Revenue growth > 10% (to avoid value traps with declining revenues)
EV/Revenue below sector median (currently ~6x)
The Bessemer Efficiency Score (Net New ARR / Net Burn) provides an additional filter. Companies scoring above 1.5x are generating meaningful ARR growth relative to their cash consumption — the hallmark of “efficient growth” that represents the sweet spot of the Rule of 40.
Confirmation Criteria
Profitable SaaS basket outperforms high-growth unprofitable SaaS basket over 6-month rolling windows
Analyst upgrades disproportionately favor companies beating on margins rather than revenue
PE/M&A acquisition multiples correlate more strongly with EBITDA margins than with growth rates
The correlation between revenue growth and EV/Revenue multiple weakens relative to the correlation between free cash flow margin and EV/Revenue multiple
Invalidation Criteria
A new growth cycle begins (e.g., AI-native features drive material revenue acceleration for growth-first companies)
Interest rates drop significantly, reducing the cost of capital and making growth investing more attractive
Profitable SaaS experiences churn acceleration as customers substitute AI alternatives
M&A buyers consistently pay growth premiums above profitability premiums
Timeframe
12 months. This is a regime thesis, and regime shifts take multiple quarters to manifest in relative returns.
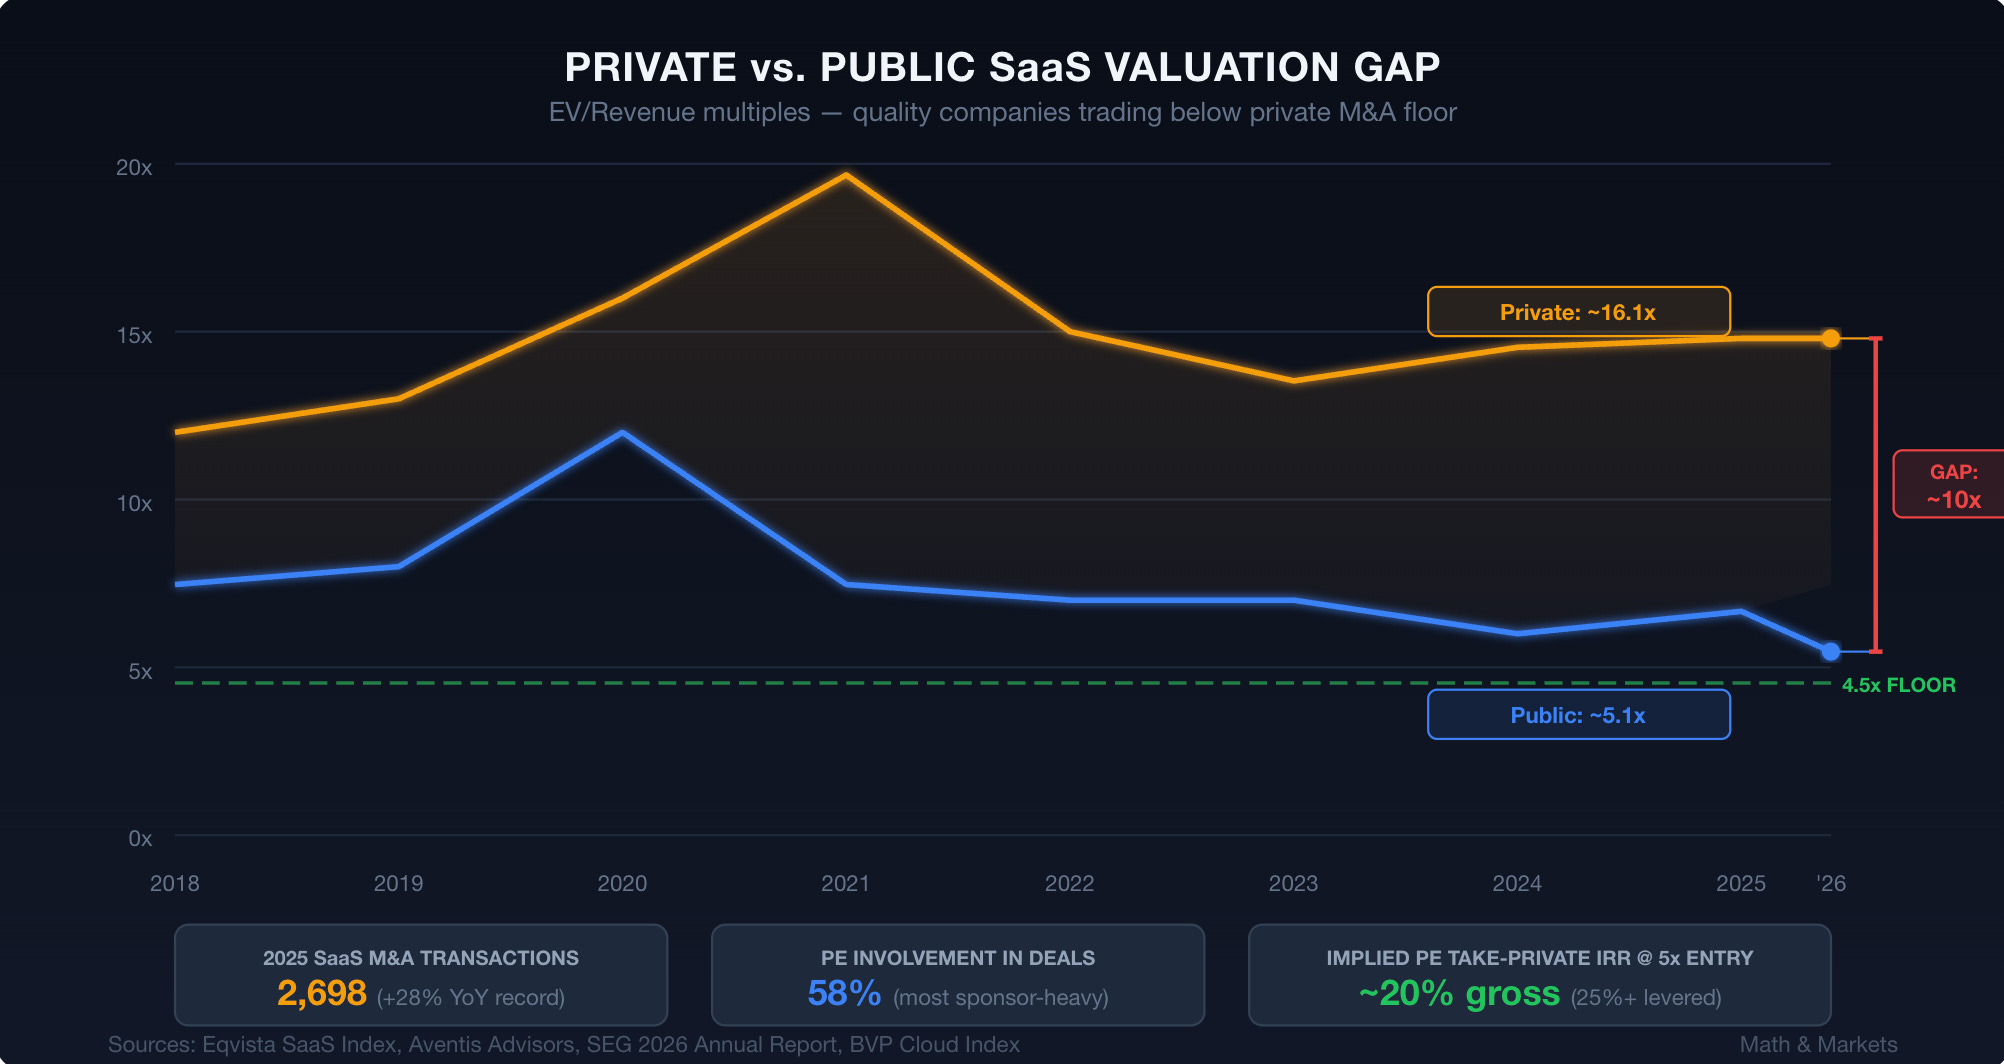
Hypothesis 3: The Private-Public Valuation Divergence Signals a Floor
The Thesis
Private SaaS M&A multiples (stabilized around 16.11x for quality companies) have diverged significantly from public SaaS multiples (~6x median). This gap is historically anomalous and signals that public markets are pricing SaaS below fundamental private-market value for quality assets. The divergence will compress — either through public market recovery, take-private transactions at premium, or both.
My Rationale
The private M&A market provides a different information signal than the public equity market. Public markets aggregate the views of momentum traders, passive index flows, algorithmic strategies, and long-term investors into a single price that fluctuates with sentiment. Private M&A prices reflect the views of strategic and financial buyers who:
Conduct months of diligence
Build detailed financial models
Underwrite specific integration synergies
Commit capital for 5-10 year holding periods
When these two markets diverge, one of them is usually wrong. The track record suggests it’s usually public markets that overshoot.
The data is striking. In 2025, SaaS M&A hit a record 2,698 transactions, up 28% YoY. Private equity was involved in 58% of deals — one of the most sponsor-heavy years on record. Strategic buyers accounted for 92% of all transactions (including PE-backed strategic acquisitions). These buyers were paying multiples well above where public markets are trading today.
As Aventis Advisors documented, the long-run median private SaaS M&A multiple is 4.5x EV/Revenue, with the top quartile above 8.1x. Several quality public SaaS companies are now trading near or below 4.5x — below the long-run median private market clearing price.
This creates a natural arbitrage mechanism: take-private. When it’s cheaper to buy a public SaaS company and delist it than to buy a comparable private company, private equity firms will do exactly that. The infrastructure is in place — PE dry powder is at record levels, and software is the most active PE sector by deal volume.
Historical Analogues
The last time public SaaS multiples approached private-market floors was Q2 2023, when the median public multiple hit ~5.5x. What followed was a recovery to ~7x over the subsequent 12 months, driven partly by take-private activity (which removed cheap supply from the public market) and partly by fundamental improvement as the market digested the rate-hike cycle.
The current selloff has pushed many names back to or below Q2 2023 levels. If the same mechanism operates — PE take-privates establish a floor, reducing public float of cheap assets — we should see compression from below.
The Floor Price Calculation
I’ve spent my fair share of time with PE firms doing DDs and in board rooms of PE held companies.
In my experience, a crude but useful calculation would be this — if a PE firm can acquire a SaaS company at 5x revenue, apply 200-400 basis points of margin improvement through operational efficiency (the standard PE playbook for software), and exit at 7-8x in 3-5 years, the IRR is attractive:
Entry: 5x revenue, 20% EBITDA margin
Exit (5 years): 7x revenue, 25% EBITDA margin, 12% revenue CAGR

Entry EV: $500M (on $100M revenue)
Exit revenue: $100M × 1.12^5 = $176M
Exit EV: $176M × 7 = $1,232M

Gross MOIC: 2.46x
Gross IRR: ~19.7%

With leverage (typical software LBO): IRR improves to 25%+
At 4x or below, these returns become compelling enough to attract take-private bids. This suggests a floor in the 4-5x EV/Revenue range for quality SaaS with above-average margins and retention.
Confirmation Criteria
Announced take-private transactions increase in Q1-Q2 2026
Take-private premiums exceed 30% (indicating public markets are significantly below private fair value)
PE firms publicly discuss SaaS as attractive (LP letters, conference commentary)
Public SaaS multiples for quality companies stop declining and establish a base above 4.5x
Invalidation Criteria
Private M&A multiples decline to match public multiples (convergence from above, not below)
PE firms reduce software allocation (as Apollo reportedly did with lending exposure)
Credit markets tighten, making leveraged buyouts more expensive and reducing PE appetite
A major take-private deal fails post-acquisition, chilling deal activity
Timeframe
6-18 months. Take-private processes take 3-6 months from indication of interest to close, so deals initiated now would be announced in Q2-Q3 2026.
Synthesis: Where the Hypotheses Overlap
The three hypotheses aren’t independent — they reinforce each other in specific quadrants:
The strongest conviction trade is a company that is: (1) deterministic-system SaaS with low AI displacement risk, (2) profitable with a Rule of 40 score above 40% led by margins, and (3) trading at or below the long-run private M&A median of 4.5x revenue.
If such a company exists — and the current selloff suggests several might — it represents a triple mispricing: the market is undervaluing its AI resilience, underweighting its profitability, and pricing it below what a private buyer would pay to take it off the market.
The weakest conviction scenario is the inverse: a probabilistic-system SaaS company, unprofitable, trading at 6x+ despite declining NRR. This is where the market’s fears are most likely to be proven correct.
The messy middle — profitable but AI-exposed, or deterministic but expensive — is where the real analytical work happens, and where the four-factor model from Part 2 earns its keep.
What’s Next
In Part 4, we’ll take these three hypotheses and translate them into a structured multi-decision trading strategy. Explicit entry rules, position sizing, rebalancing triggers, hedging mechanics, and a decision tree for when the hypotheses fail.
As always: Alpha is never guaranteed. And the backtest is a liar until proven otherwise.
The material presented in Math & Markets is for informational purposes only. It does not constitute investment or financial advice.