
The Volatility Series, Part 7: Practical Vol Trading
Part 66 — Volatility Series 7 of 7 — Building a systematic model for entries, exits, and risk management

This is part 66 of my series — Building & Scaling Algorithmic Trading Strategies
We’ve covered a lot of theory in this series: what volatility is, trading strategies, VIX arbitrage, higher-order Greeks, VIX arbitrage using higher-order Greeks, and building vol surfaces.
Now let’s build a practical framework. This post proposes a systematic model for trading volatility — a decision framework, position sizing rules, entry/exit criteria, and risk management protocols that can be backtested, refined, and adapted to your own risk tolerance.
1. The Decision Framework
Before putting on any vol trade, the framework runs through a decision tree.
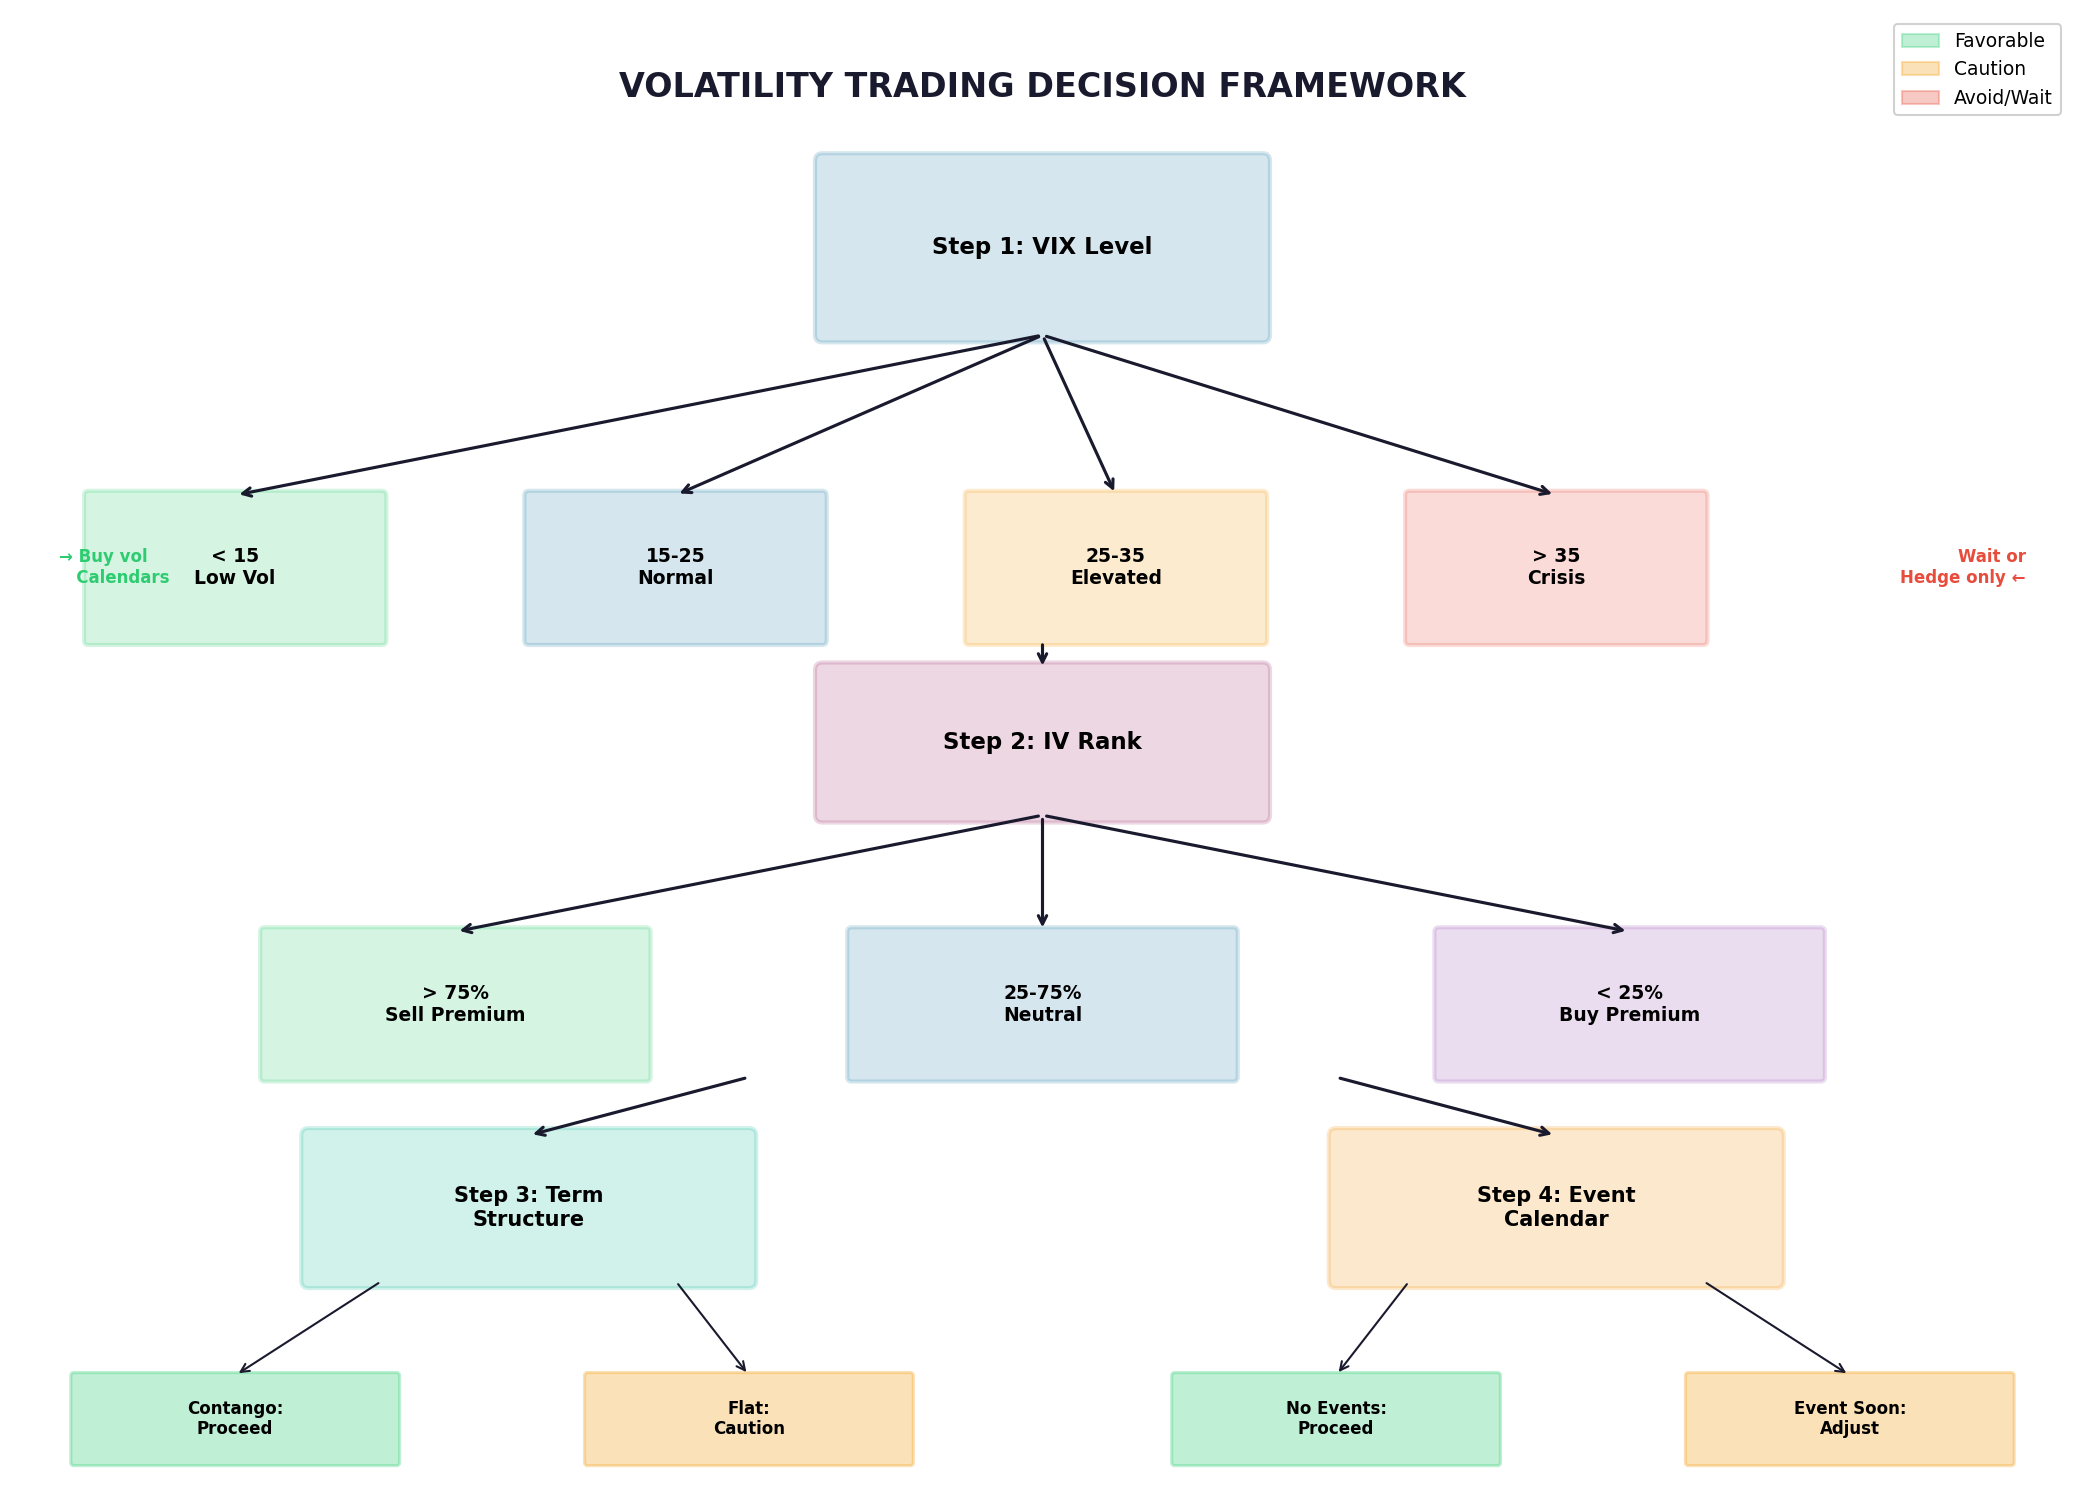
Step 1: VIX Level Assessment
The single most important input. VIX indicates the market’s current fear level and sets the baseline for strategy selection:
VIX Level       │ Market State      │ Strategy Bias
────────────────┼───────────────────┼─────────────────────────
< 15            │ Low volatility    │ Buy vol, calendars
15-25           │ Normal range      │ Neutral, either side
25-35           │ Elevated          │ Sell premium (size down)
> 35            │ Crisis mode       │ Wait or hedge only
Step 2: IV Rank Assessment
VIX level is absolute; IV Rank is relative. A VIX of 20 might be high for a calm market or low during a crisis.
IV Rank = (Current IV - 52w Low) / (52w High - 52w Low) × 100

IV Rank > 75%:  Strong bias toward selling premium
IV Rank 50-75%: Moderate bias toward selling
IV Rank 25-50%: Neutral
IV Rank < 25%:  Bias toward buying premium
Step 3: Term Structure Assessment
Is the VIX futures curve in contango (normal) or backwardation (stressed)?
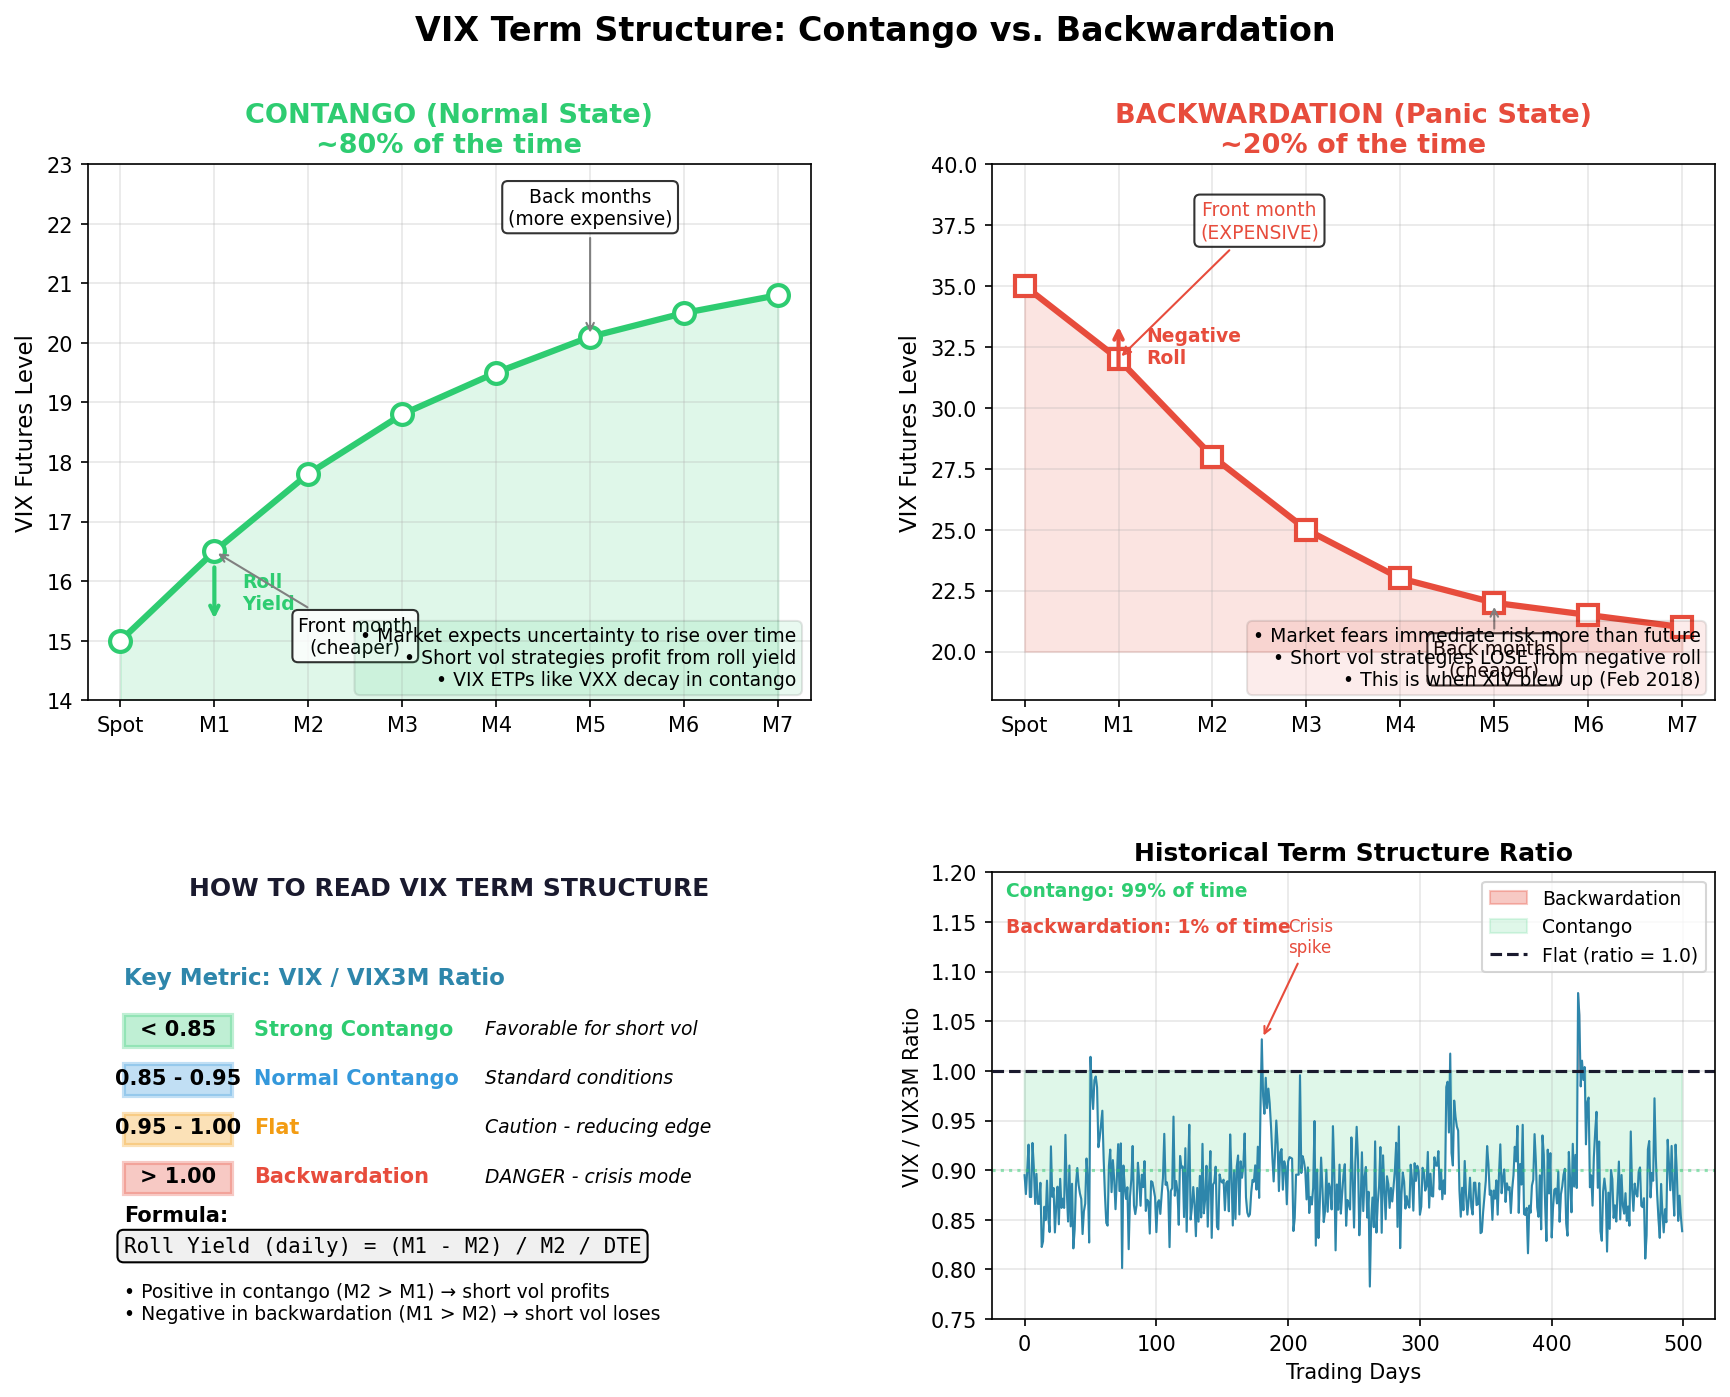
Term Structure    │ Condition        │ Implication
──────────────────┼──────────────────┼──────────────────────────
Steep contango    │ M2 - M1 > 2      │ Calendars attractive
Normal contango   │ M2 - M1 = 0.5-2  │ Standard strategies
Flat              │ M2 - M1 < 0.5    │ Reduced conviction
Backwardation     │ M2 < M1          │ Crisis — reduce or exit
Step 4: Event Calendar Check
Any binary events in the next 7-10 days? Earnings, FOMC, major economic releases?
Event present: Event-specific strategies (straddles for unknown direction, adjust strikes for expected move)
No events: Standard premium collection strategies
2. Position Sizing Model
Position sizing is where most vol traders blow up. Not in strategy selection — in betting too big.
Remember: Position sizing is like managing your health bar in a boss fight: if you face a raid boss with 10% mana and no potions, you don’t “go big or go home” — you die and respawn broke.
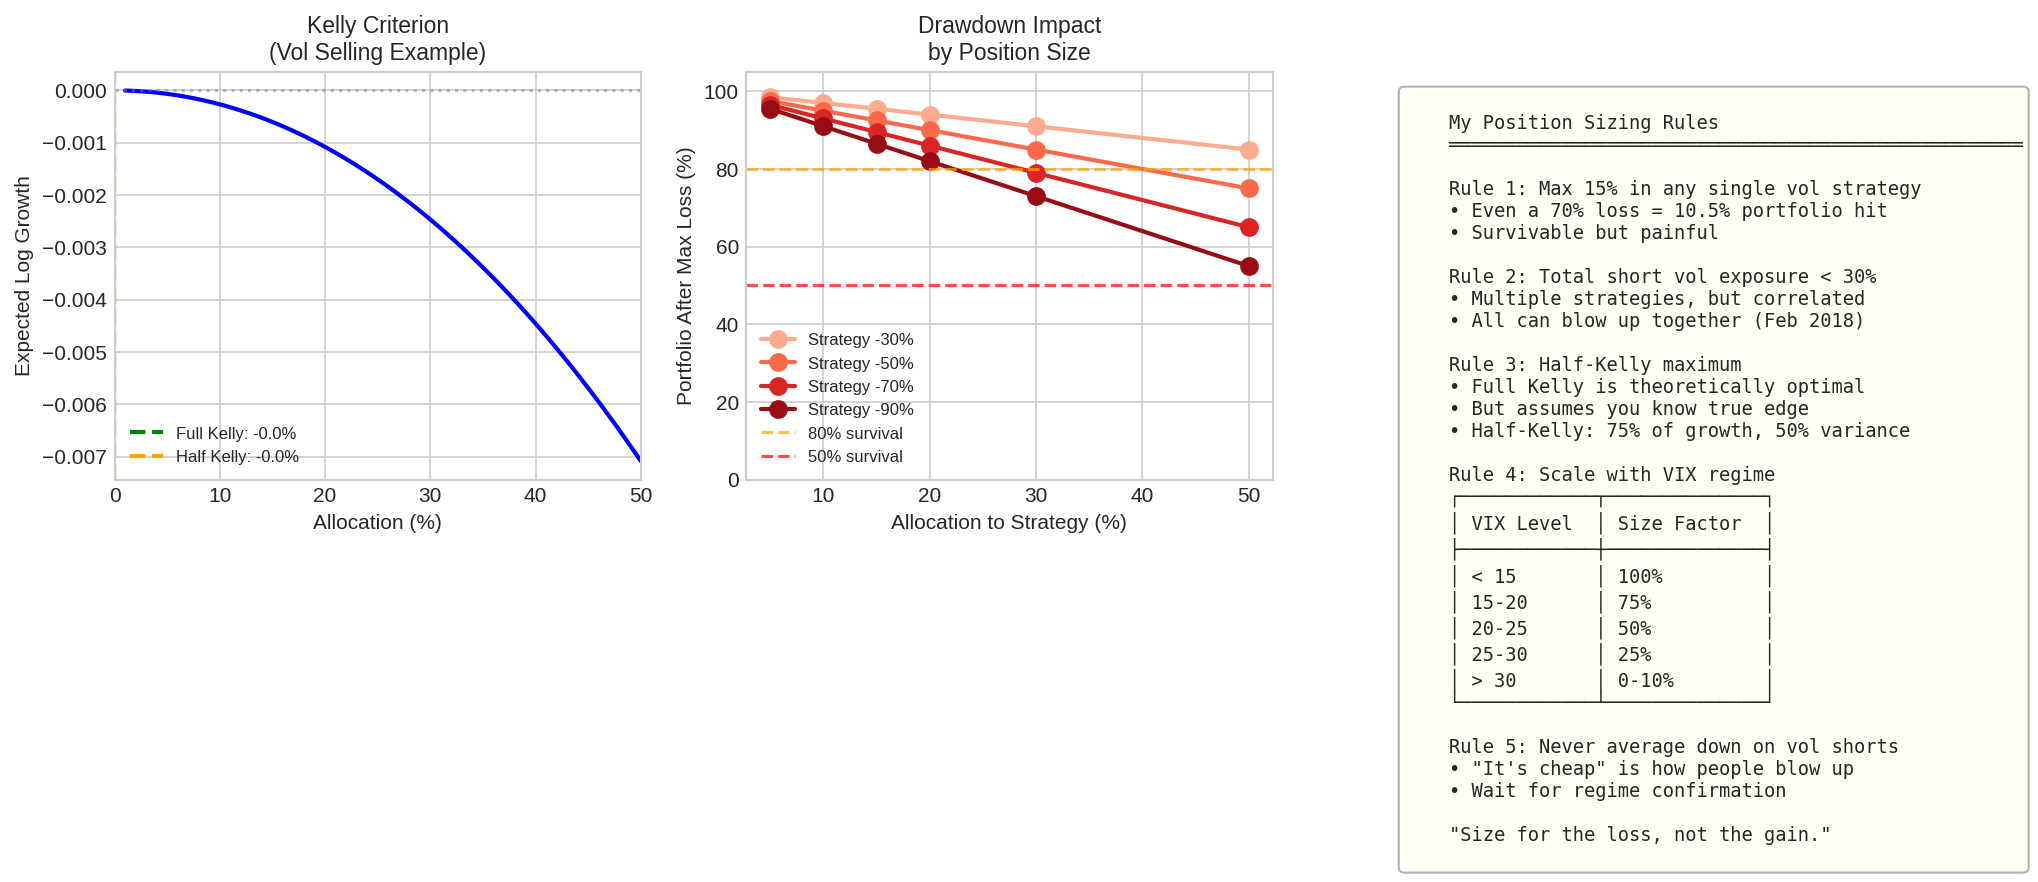
The Kelly Criterion (Theoretical Baseline)
I highly recommend that you read my Kelly Criterion series here: The Mathematics of Position Sizing: The Kelly Criterion from First Principles
Kelly provides the mathematically optimal bet size:
f* = (p × b - q) / b

Where:
  f* = fraction of capital to risk
  p  = probability of winning
  q  = 1 - p = probability of losing
  b  = win/loss ratio (average win / average loss)
For a typical iron condor with 70% win rate and 15% avg win / 35% avg loss:
f* = (0.70 × 0.43 - 0.30) / 0.43 = 0.70 - 0.70 = ~0.20Kelly suggests ~20% allocation.
But Kelly assumes known probabilities. In practice, use fractional Kelly (½ or ⅓) to account for estimation error.
Proposed Position Sizing Rules
RULE 1: Single Position Limit
  Maximum 15% of portfolio in any single vol strategy

RULE 2: Aggregate Short Vol Limit
  Total short vol exposure < 30% (correlation spikes in crisis)

RULE 3: VIX-Adjusted Sizing
  ┌─────────────┬─────────────────┐
  │ VIX Level   │ Size Multiplier │
  ├─────────────┼─────────────────┤
  │ < 15        │ 100%            │
  │ 15-20       │ 75%             │
  │ 20-25       │ 50%             │
  │ 25-30       │ 25%             │
  │ > 30        │ 0-10%           │
  └─────────────┴─────────────────┘

RULE 4: No Averaging Down
  Never add to losing vol positions
Why This Matters: The Survival Math
Consider an 80% drawdown event (like XIV on Feb 5, 2018):
Allocation    │ Portfolio After   │ Outcome
──────────────┼───────────────────┼─────────────────
100%          │ 20%               │ Wipeout
50%           │ 60%               │ Brutal, survivable
25%           │ 80%               │ Bad quarter
15%           │ 88%               │ Bad month
The strategy that survives is the strategy that can compound.
3. Entry and Exit Rules
Explicit rules eliminate emotional decision-making. The framework proposes the following:
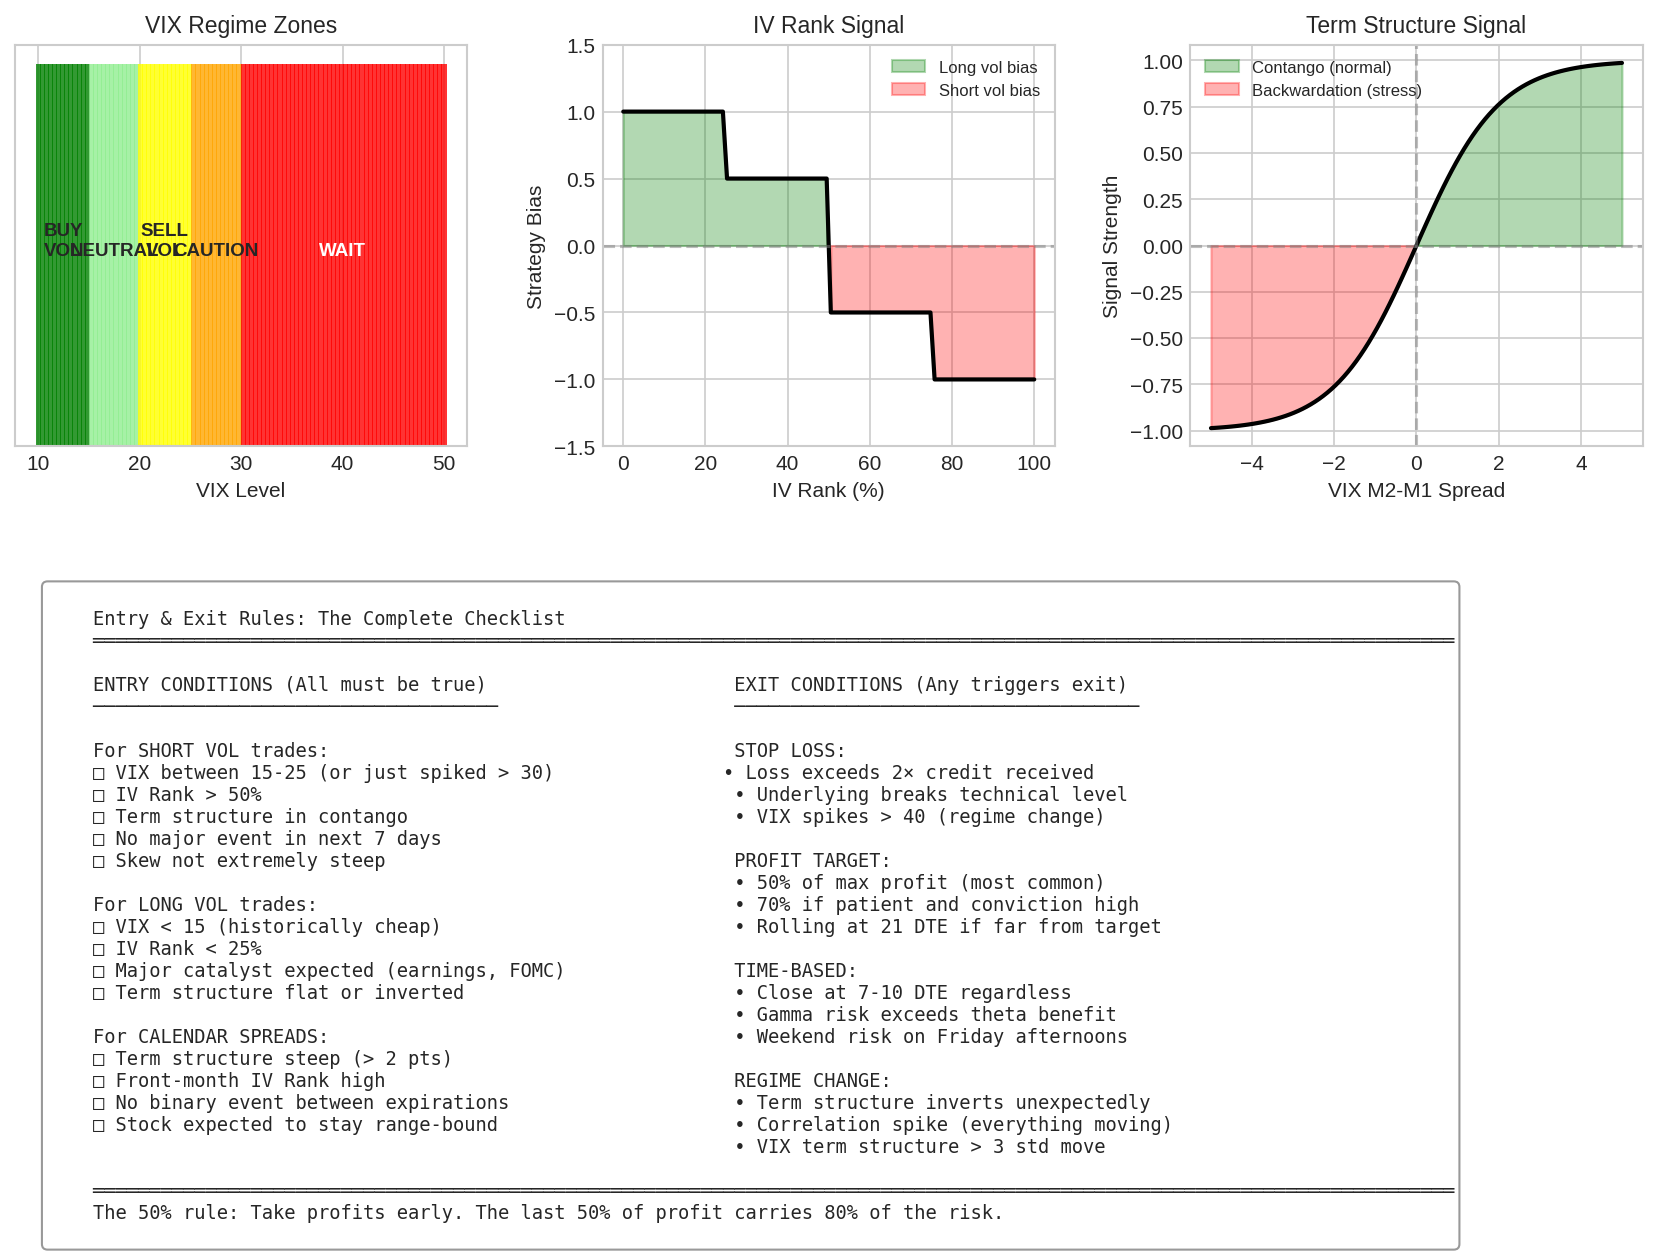
Entry Conditions (Short Vol Trades)
All conditions must be true:
□ VIX between 15-30 (or mean-reverting from spike)
□ IV Rank > 50%
□ Term structure in contango (M2 > M1)
□ No major binary event in next 7 days
□ Skew within 2σ of historical norm
□ Position size within framework limits
Exit Conditions (Any Trigger = Exit)
Profit Target: 50% of maximum profit
Rationale: The last 50% of profit carries ~80% of the risk.
           Gamma explosion near expiration creates whipsaw.
           Early profit-taking improves risk-adjusted returns.

Example:   Sold iron condor for $3.00 credit
           Target exit at $1.50 credit remaining
           Capture $1.50 profit, release capital
Stop Loss: 2× credit received
Rationale: Limits damage while allowing room for normal fluctuation.
           Tighter stops get whipsawed; wider stops risk ruin.

Example:   Sold iron condor for $3.00 credit
           Max loss = $7.00, but stop at $6.00 loss (2× credit)
           Exit if position shows -$6.00
Time-Based Exit: Close at 7-10 DTE
Rationale: Gamma risk explodes in final week.
           Remaining theta doesn't compensate for gap risk.
           Pin risk and assignment risk increase.
Regime Change Exit: Immediate close
Triggers:  • Term structure inverts (backwardation)
           • VIX spikes > 40
           • Correlation regime shift detected
4. Example Scenarios
Let’s walk through how the framework handles different market conditions.
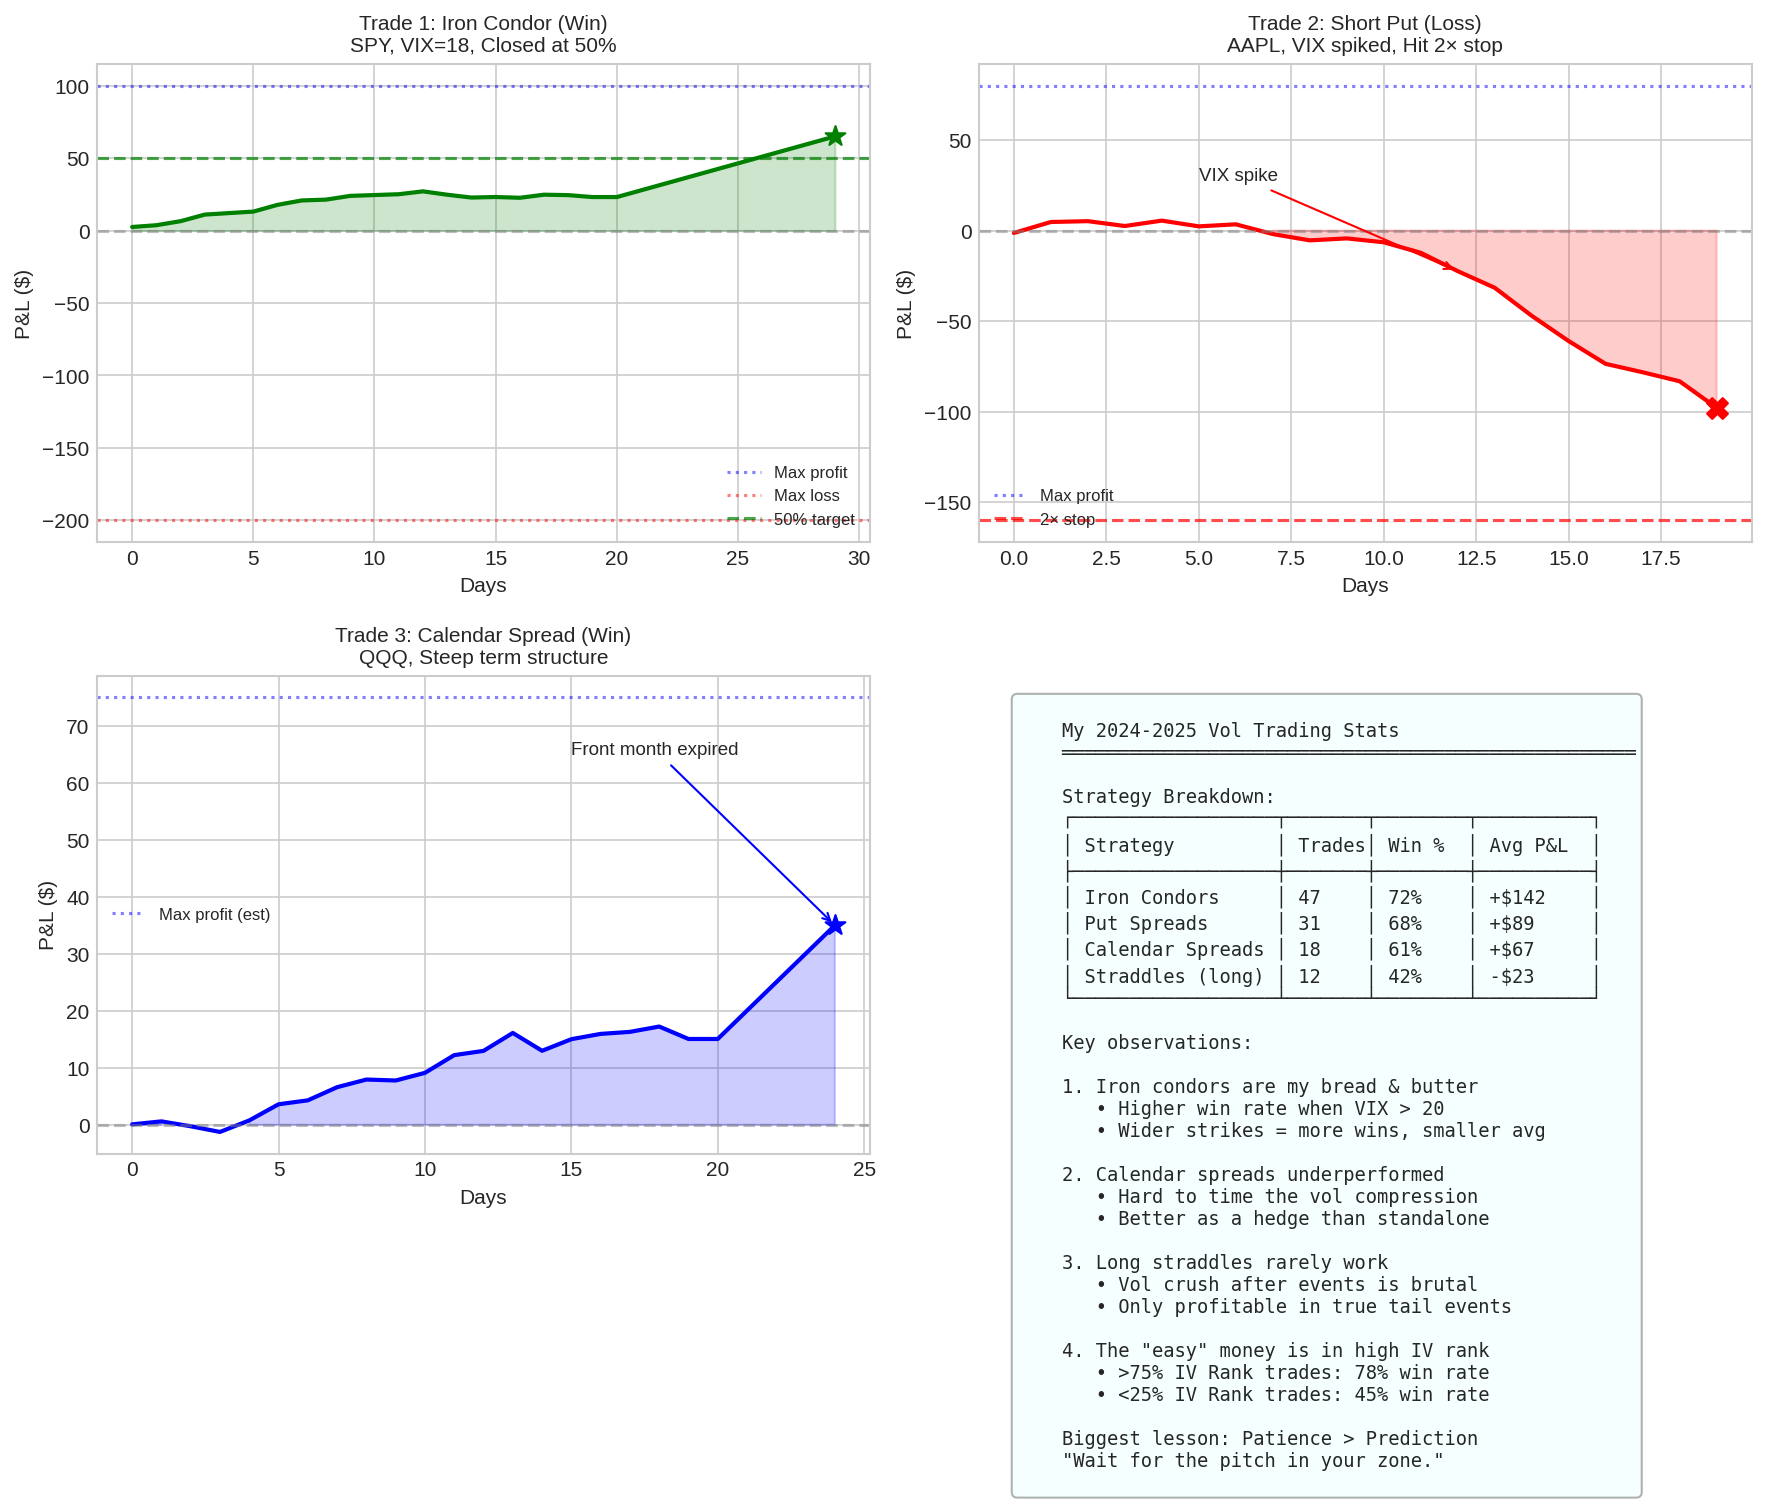
Scenario A: Normal Market Iron Condor
Conditions:
VIX: 18, IV Rank: 62%, Contango: normal
No events in next 10 days
Framework Decision:
✓ All entry conditions met
Position size: 75% of normal (VIX 15-20 regime)
Strategy: 45 DTE iron condor, 5-wide strikes
Management Path:
Day 0:   Enter for $1.42 credit
Day 15:  Profit at $0.60 (42% of max) — hold
Day 24:  Profit hits $0.71 (50% of max) — EXIT
Result:  +$71 per contract, capital freed for next trade
Scenario B: Pre-Earnings Mistake
Conditions:
VIX: 16, IV Rank: 55%, Contango: normal
AAPL earnings in 3 days
Framework Decision:
✗ Binary event within 7 days — NO ENTRY for standard premium selling
What Happens If Rule Ignored:
Day 0:   Enter put spread for $0.80 credit
Day 3:   Earnings miss, gap down 8%, VIX → 28
Day 4:   2× stop triggered, -$160 loss
Lesson : The framework prevents the trade entirely.
Scenario C: VIX Spike Opportunity
Conditions:
VIX: 32 (spiked from 18), IV Rank: 89%
Contango flattening but not inverted
Framework Decision:
VIX > 30: Size at 10-25% of normal
Wait for mean reversion confirmation (VIX turning down)
OR: Calendar spreads benefit from steep term structure
Risk Consideration:
At VIX 32, the framework caps exposure severely.
Better to miss some upside than get caught in continued spike.
If VIX hits 40+, framework goes to cash.
5. Risk Management Protocol
This is where the rubber meets the road.
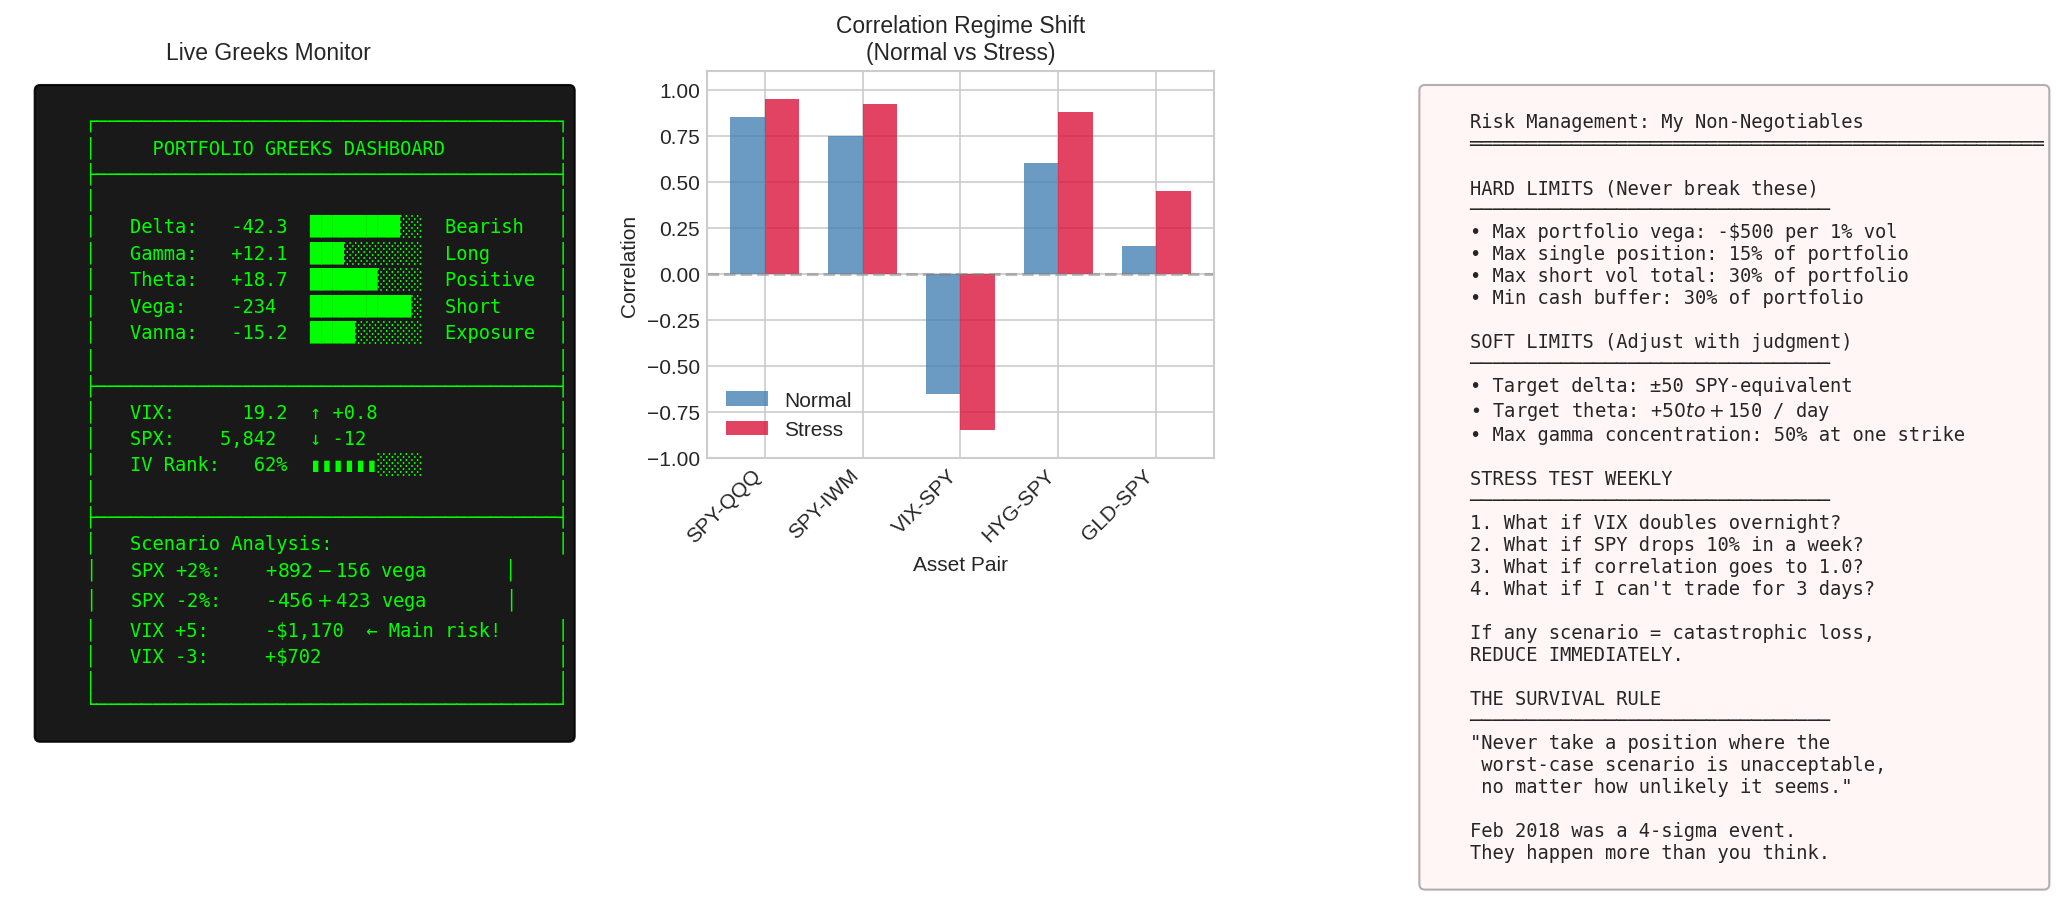
Portfolio Greeks Monitoring
Track aggregate portfolio Greeks daily:
Greek    │ Target Range            │ Action if Breached
─────────┼─────────────────────────┼─────────────────────────
Delta    │ ±50 SPY-equivalent      │ Hedge or reduce
Gamma    │ No concentration        │ Spread across strikes
Theta    │ +$50 to +$200/day*      │ Adjust position count
Vega     │ < -$500 per 1% vol      │ Critical — reduce now
─────────────────────────────────────────────────────────────
* Scale to account size
The Weekly Stress Test
Every week, run these scenarios:
SCENARIO 1: VIX Doubles Overnight
  • Calculate portfolio P&L if VIX goes 18 → 36
  • Acceptable threshold: -15% of portfolio

SCENARIO 2: SPX Drops 10% This Week
  • Calculate delta exposure under 10% move
  • Account for gamma acceleration

SCENARIO 3: Correlation → 1.0
  • Assume all positions move together
  • "Diversified" across SPY/QQQ/IWM? Not in crisis.

SCENARIO 4: Unable to Trade for 3 Days
  • Platform outage, personal emergency
  • Can positions survive without management?
Rule: If any scenario = unacceptable loss, reduce immediately.
Correlation Regime Awareness
The silent killer in vol trading:
                    │ Normal Market │ Crisis
────────────────────┼───────────────┼──────────
SPY-QQQ correlation │ ~0.85         │ ~0.95
SPY-IWM correlation │ ~0.75         │ ~0.92
VIX-SPY correlation │ -0.65         │ -0.85
A “diversified” short vol portfolio across multiple underlyings provides false comfort. During stress events (March 2020, Feb 2018), correlations spike to near 1.0. The diversification benefit disappears exactly when needed.
Framework Response: The 30% aggregate short vol limit assumes correlation spike.
I find it helpful to have a delta analogy, which is far easier to understand for most retail traders.
Delta version: You have 10 small short delta positions across different stocks. So you think: “I’m diversified, these are uncorrelated” — however, the market crashes and correlations spike to 1.0. Suddenly, all 10 positions move against you simultaneously.
Your “diversified” -5 delta × 10 positions = one big -50 delta position
Short vol version: You have short vol across SPY, QQQ, IWM, AAPL, NVDA, etc. You think, “I’m diversified across sectors and market caps!” but then VIX spikes and correlations spike to 1.0. Suddenly, all vol expands together.
Now your “diversified” short vega becomes one massive concentrated short vega. 💥
6. Framework Design Principles
These principles underpin the entire model.
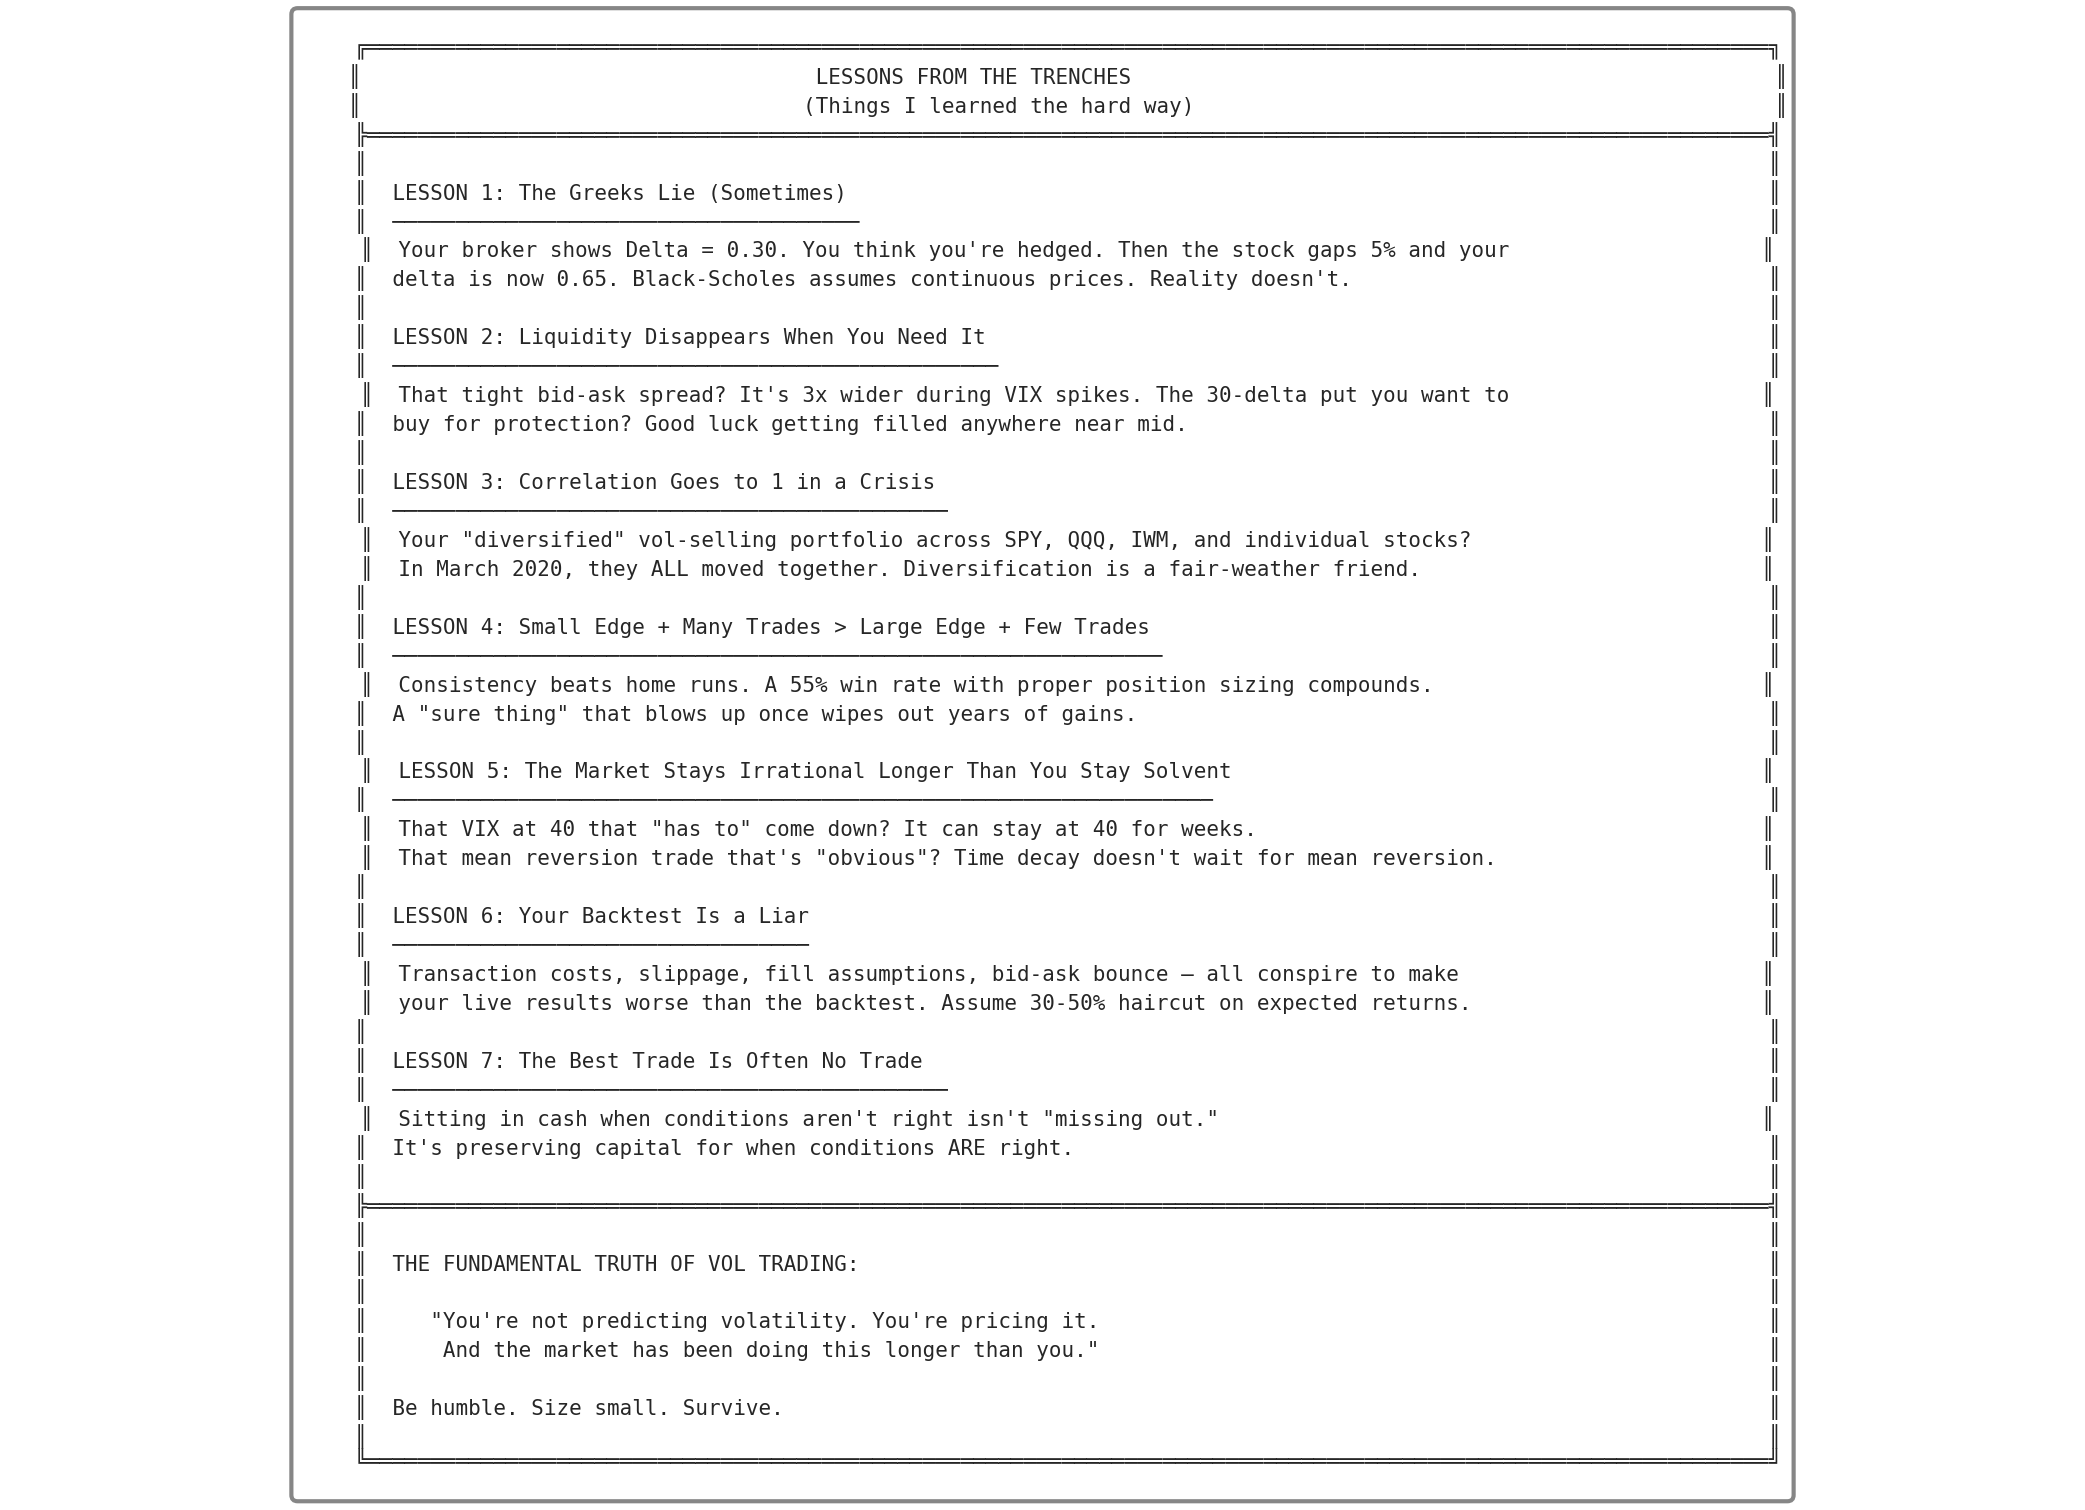
Principle 1: Greeks Are Estimates, Not Guarantees
Black-Scholes assumes continuous prices. Reality includes gaps.
Broker shows:    Delta = 0.30
Stock gaps 5%:   Delta now = 0.65
Your "hedged" position is no longer hedged.
Framework Response: Build in cushion. Don’t rely on Greeks alone.
Principle 2: Liquidity Disappears in Stress
That tight bid-ask spread widens 3× during VIX spikes. The protective put you need to buy? Good luck getting filled near mid.
Framework Response: Assume adverse fills. If your stop requires selling at mid-price, add buffer.
Principle 3: Small Edge × Many Trades > Large Edge × Few Trades
Approach A: 55% win rate, proper sizing, consistent
  → Compounds beautifully over 100+ trades

Approach B: "Sure thing" with 90% win rate
  → Single blowup wipes out years of gains
Framework Response: The model optimizes for consistency, not home runs.
Principle 4: The Market’s Irrationality Outlasts Your Solvency
That VIX at 40 that “has to” come down? It can stay elevated for weeks. Mean reversion is real, but timing is uncertain.
Framework Response: Time-based exits. Never rely purely on mean reversion.
Principle 5: Backtests Lie
Transaction costs, slippage, fill assumptions, bid-ask bounce — all conspire to make live results worse than backtests.
Framework Response: Haircut expected returns by 30-50%. If still attractive, proceed.
Principle 6: The Best Trade Is Often No Trade
Sitting in cash when conditions aren’t favorable isn’t “missing out.” It’s preserving capital for when conditions ARE favorable.
Framework Response: Explicit entry conditions. No trade if conditions not met.
7. Pre-Trade Checklist
A printable checklist for every trade:
┌────────────────────────────────────────────────────────────┐
│                    PRE-TRADE CHECKLIST                     │
├────────────────────────────────────────────────────────────┤
│                                                            │
│  ENVIRONMENT                                               │
│  □ VIX level: _______ (15-25 preferred for short vol)     │
│  □ IV Rank: _______ % (>50% for premium selling)          │
│  □ Term structure: _______ (contango for shorts)          │
│  □ Event calendar: _______ (clear for 7+ days)            │
│                                                            │
│  POSITION SIZING                                           │
│  □ Size within 15% single-position limit                  │
│  □ Total short vol < 30% after trade                      │
│  □ VIX-adjusted sizing applied                            │
│                                                            │
│  RISK CHECK                                                │
│  □ Portfolio Greeks acceptable after trade                │
│  □ Stress test passed (survives VIX doubling)             │
│  □ Stop loss defined: _______                             │
│  □ Profit target defined: _______                         │
│                                                            │
│  EXECUTION                                                 │
│  □ Bid-ask spread < 20% of credit                         │
│  □ Entry at or better than mid                            │
│  □ Exit rules documented                                  │
│                                                            │
│  DECISION: □ ENTER  □ PASS                                │
│                                                            │
└────────────────────────────────────────────────────────────┘
8. Framework Summary
The complete model in one view:
VOLATILITY TRADING FRAMEWORK v1.0
═══════════════════════════════════════════════════════════════

DECISION TREE
─────────────
1. VIX Level → Sets strategy universe
2. IV Rank → Confirms premium levels
3. Term Structure → Confirms market state
4. Events → Identifies binary risk

POSITION SIZING
───────────────
• Max 15% per position
• Max 30% aggregate short vol
• Scale down as VIX rises
• Never average down

ENTRY RULES (ALL MUST BE TRUE)
──────────────────────────────
• VIX 15-30 (or mean-reverting)
• IV Rank > 50%
• Contango intact
• No events in 7 days
• Skew normal

EXIT RULES (ANY TRIGGERS EXIT)
──────────────────────────────
• 50% profit target
• 2× credit stop loss
• 7-10 DTE time exit
• Regime change (inversion, VIX > 40)

RISK PROTOCOL
─────────────
• Daily Greeks monitoring
• Weekly stress tests
• Correlation awareness
• Scenario planning

═══════════════════════════════════════════════════════════════
9. The Complete Volatility Series
Here’s the full series in one place:
Part 60: Understanding the Fear Gauge — What volatility actually is, why it clusters, and how the VIX works
Part 61: Trading Strategies — Straddles, iron condors, calendars, and when to use each
Part 62: VIX Term Structure Arbitrage — The math, the history, and why XIV blew up
Part 63: The Greeks Deep Dive — Vanna, Charm, Vomma, and higher-order sensitivities
Part 64: The Greeks Deep & Short Vol Strategy — Combining VIX Term Structure with Vanna, Charm, Vomma, and Veta for Better Risk-Adjusted Returns
Part 64: Building a Volatility Surface — From raw option prices to SABR and SVI
Part 65: A Practical Vol Trading Framework — Systematic model for entries, exits, and risk (this post)
This framework is a starting point, not gospel. Backtest it. Paper trade it. Adapt it to your risk tolerance and account size. The best framework is one you’ll actually follow.
But remember: Alpha is never guaranteed. And the backtest is a liar until proven otherwise.
Volatility trading involves substantial risk of loss. The strategies discussed here can result in losses exceeding your initial investment. Position size accordingly.
The material presented in Math & Markets is for informational purposes only. It does not constitute investment or financial advice.
But if you make millions, remember me in your will.