
The Volatility Series, Part 4: The Greeks Deep Dive
Part 63 — Volatility Series 4 of 7 — Beyond Delta: Vanna, Charm, Vomma, and the Higher-Order Sensitivities

This is part 63 of my series — Building & Scaling Algorithmic Trading Strategies
In Part 60, we covered what volatility is. Part 61 walked through trading strategies. Part 62 explored VIX term structure arbitrage as a sidequest.
Now we go deeper. Much deeper.
Most options traders know Delta, Gamma, Theta, and Vega. These are the “first-order” Greeks — the direct sensitivities of option price to spot, time, and volatility.
But there’s a whole world beyond these. The second and third-order Greeks tell you how the first-order Greeks themselves change. And if you’re trading any size, or holding positions through volatile periods, these become critically important.
1. The Greeks Family Tree
Let’s start with the big picture. If you remember your high-school calculus, The Greeks are basically derivatives.
You are speeding down the highway, and the first derivative would be your rate of change relative to a variable (e.g., your velocity, relative to time). The second derivative would be the rate of your rate of change (e.g., your acceleration, relative to time). And your third derivative would be the rate of change of your acceleration (e.g., your jerk, relative to time).
The Greeks form a hierarchy based on what they’re derivatives of:
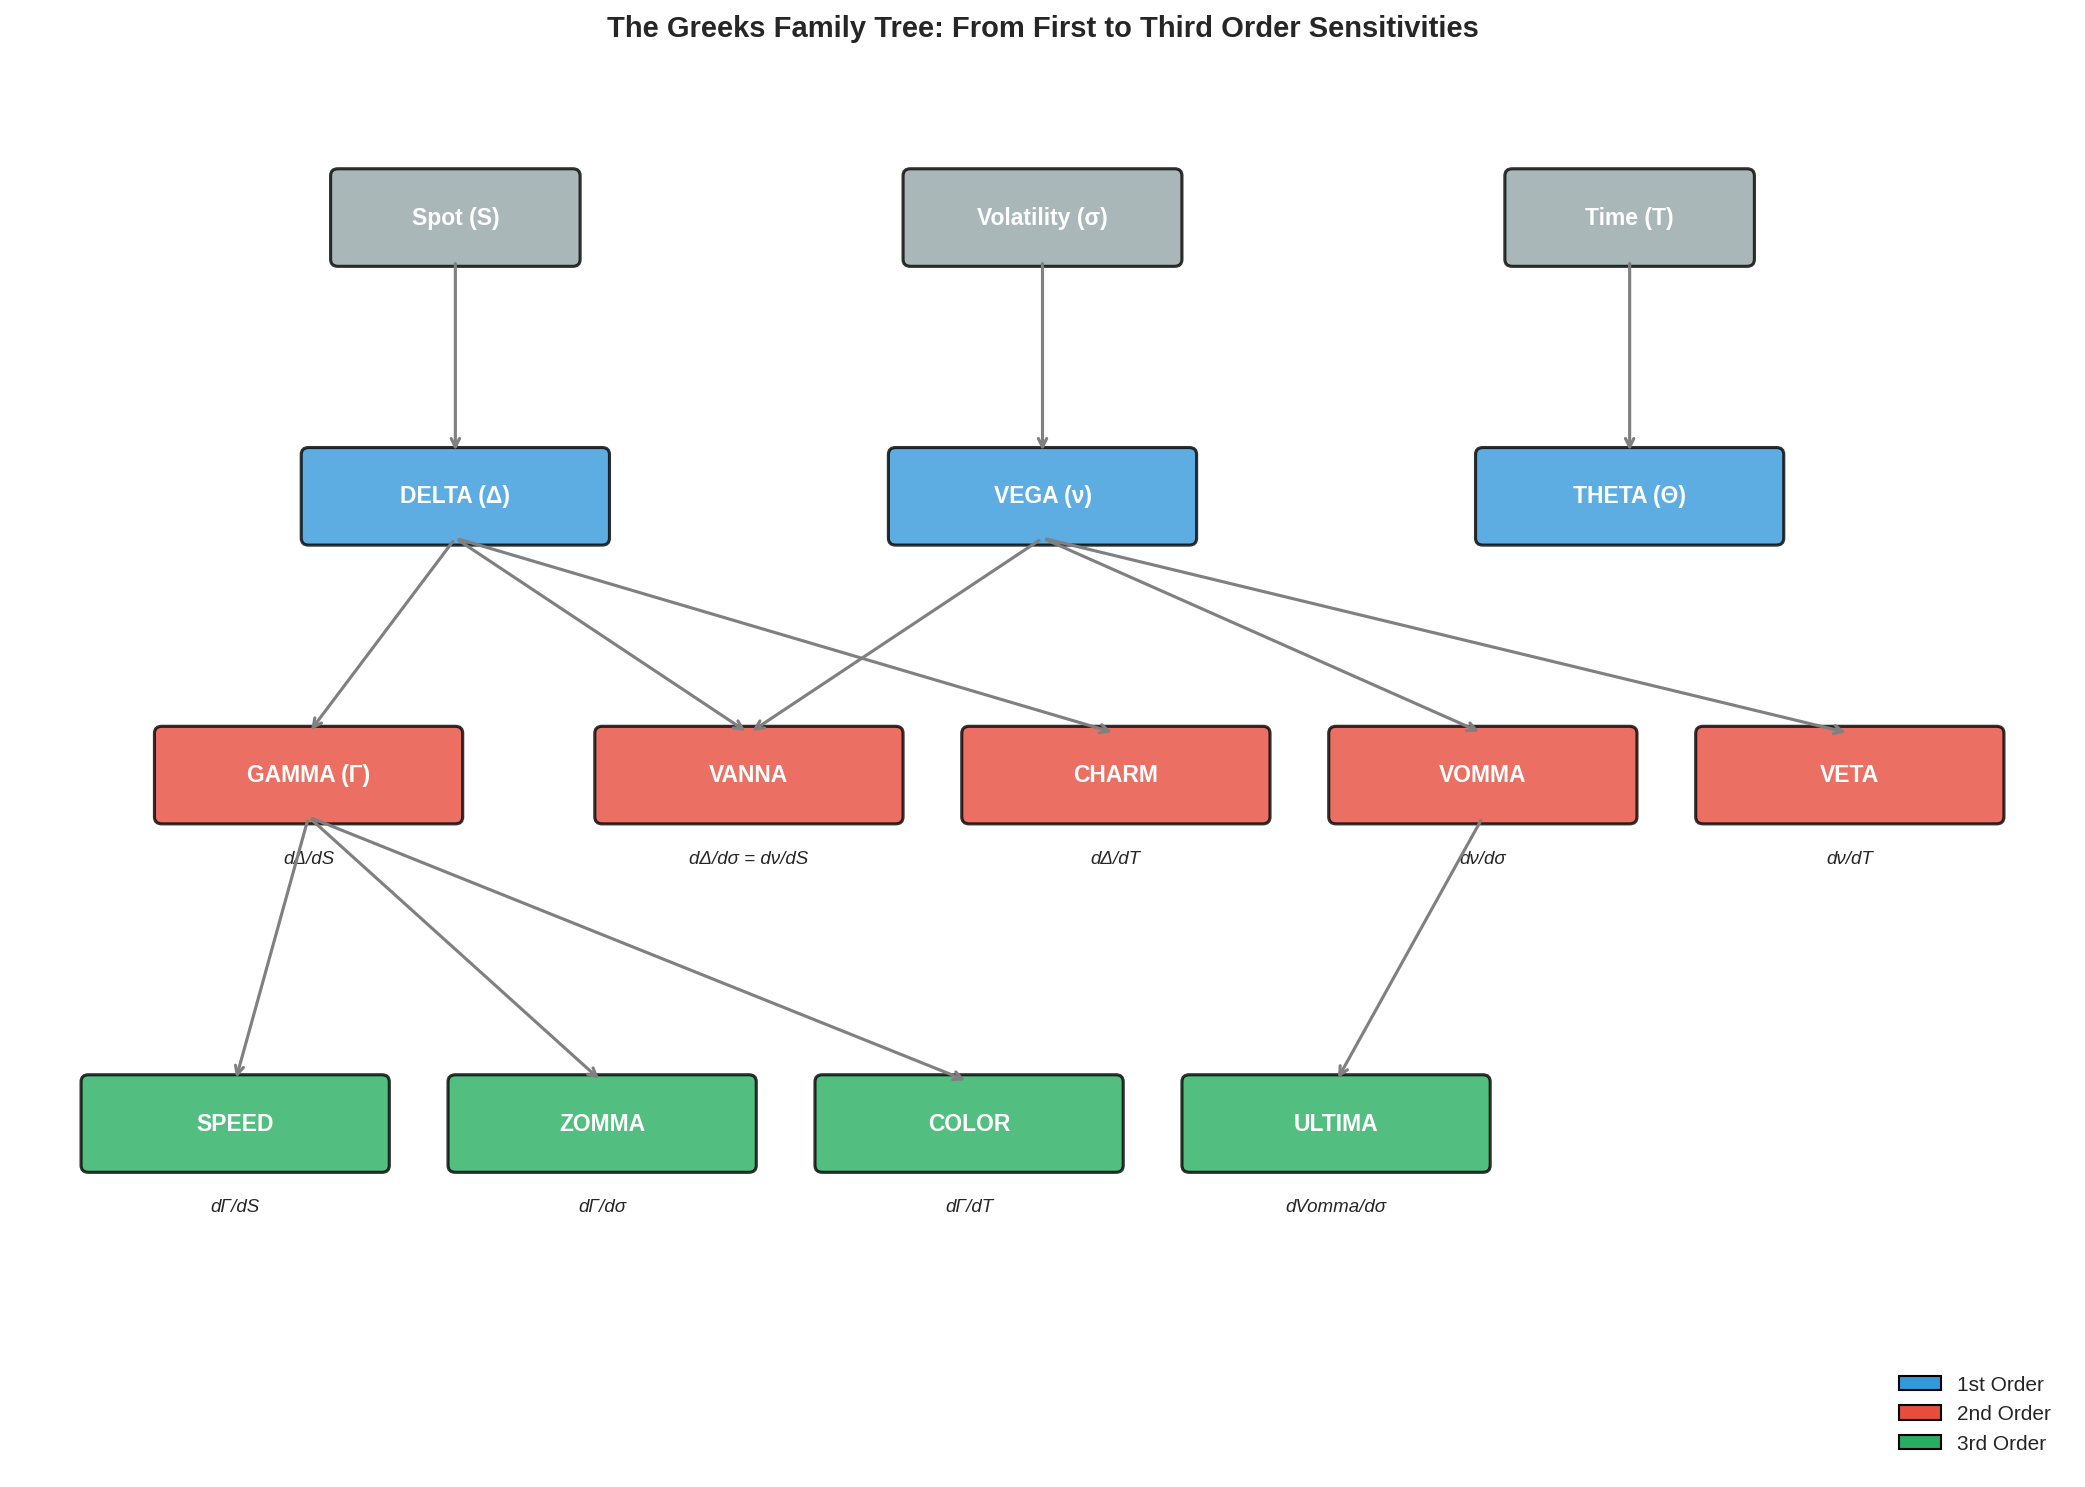
The first-order Greeks are partial derivatives of option price with respect to a single variable:
Delta (Δ): ∂V/∂S — sensitivity to spot price
Vega (ν): ∂V/∂σ — sensitivity to implied volatility
Theta (Θ): ∂V/∂T — sensitivity to time
The second-order Greeks are partial derivatives of first-order Greeks:
Gamma (Γ): ∂Δ/∂S = ∂²V/∂S² — convexity of delta
The non-linear relationship between an option’s price and the underlying asset’s price
Vanna: ∂Δ/∂σ = ∂Vega/∂S — the cross-derivative
Measures how much an option’s Delta (Δ) changes for a 1% move in the underlying asset’s implied volatility (σ), or alternatively, how much its Vega (ν) changes with the underlying price
Charm: ∂Δ/∂T — delta decay
Measures how much an option’s delta (directional sensitivity) changes as time passes, revealing that ITM/OTM options see their deltas move rapidly towards 1/0, while ATM options have weaker charm, making them less sensitive to time
Vomma: ∂Vega/∂σ — vega convexity
Measures how much an option’s vega (sensitivity to volatility) changes as volatility itself changes, revealing the curvature of the vega-volatility relationship
Veta: ∂Vega/∂T — vega decay
Similar to theta, this measures the rate of change in the vega with respect to the passage of time
And then there’s the third-order Greeks: Speed, Zomma, Color, Ultima. We’ll get to those.
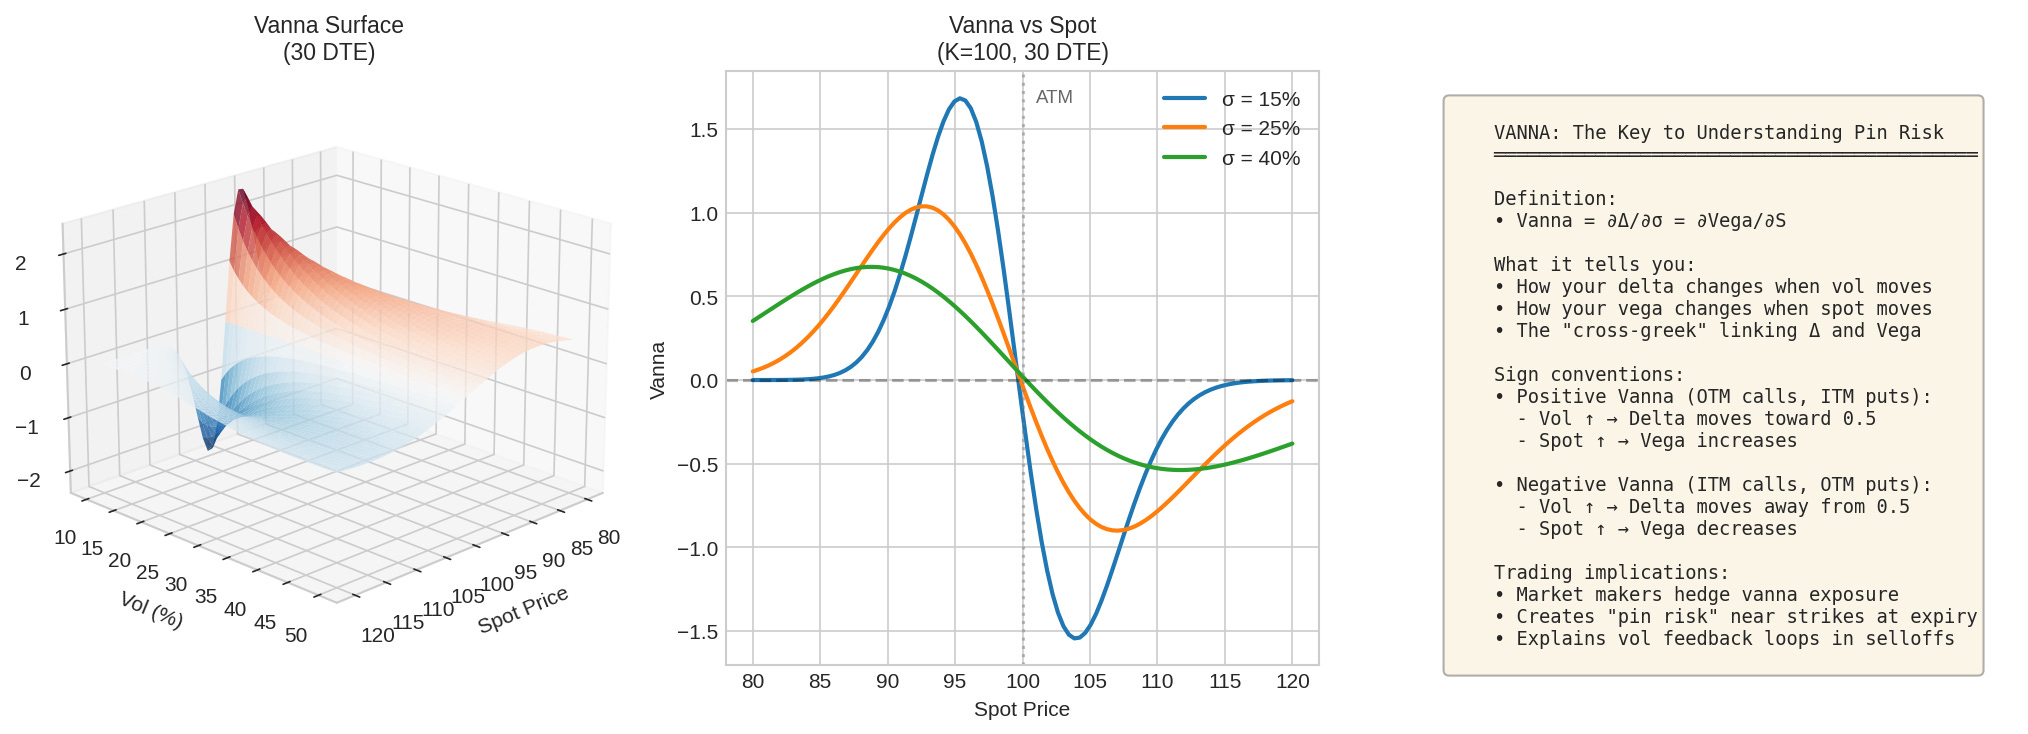
2. Vanna: The Cross-Greek
Vanna is arguably the most important second-order Greek for vol traders. It measures two equivalent things:
Vanna = ∂Δ/∂σ = ∂Vega/∂SRead that again. It’s the same number whether you think of it as:
How delta (sensitivity to spot price) changes when volatility moves, OR
How vega (sensitivity to IV) changes when spot moves
This symmetry comes from the equality of mixed partial derivatives (Schwarz’s theorem, for the math nerds).
Why Vanna Matters
Scenario 1: Market selloff with VIX spike
You’re long an OTM put spread. As the market drops:
Your put moves toward ATM (delta increases)
VIX spikes (volatility increases)
Vanna effect: The VIX spike also increases your delta
The delta move is amplified. Your hedge ratio changes faster than delta alone would predict.
Scenario 2: Pin risk at expiration
Market makers are short tons of options at a popular strike. As expiration approaches:
If stock is below strike: dealers are short delta, need to buy stock
If stock is above strike: dealers are long delta, need to sell stock
But vanna adds another layer: as IV collapses into expiry, delta moves toward 0 or 1 faster. This creates feedback loops that can “pin” the stock to the strike.
The Vanna Formula
For a vanilla option:
Vanna = -e^(-qT) × N'(d₁) × d₂ / σ

Where:
  N'(d₁) = (1/√2π) × e^(-d₁²/2)
  d₁, d₂ = standard Black-Scholes terms
Key properties:
Vanna is positive for OTM calls and ITM puts
Vanna is negative for ITM calls and OTM puts
Vanna = 0 exactly at ATM
Magnitude peaks around 25-delta options
3. Charm: Delta’s Time Decay
Charm measures how delta changes with time, holding everything else constant:
Charm = ∂Δ/∂T = -∂Θ/∂SThat second equality is important: charm and the spatial derivative of theta are the same thing (up to a sign).
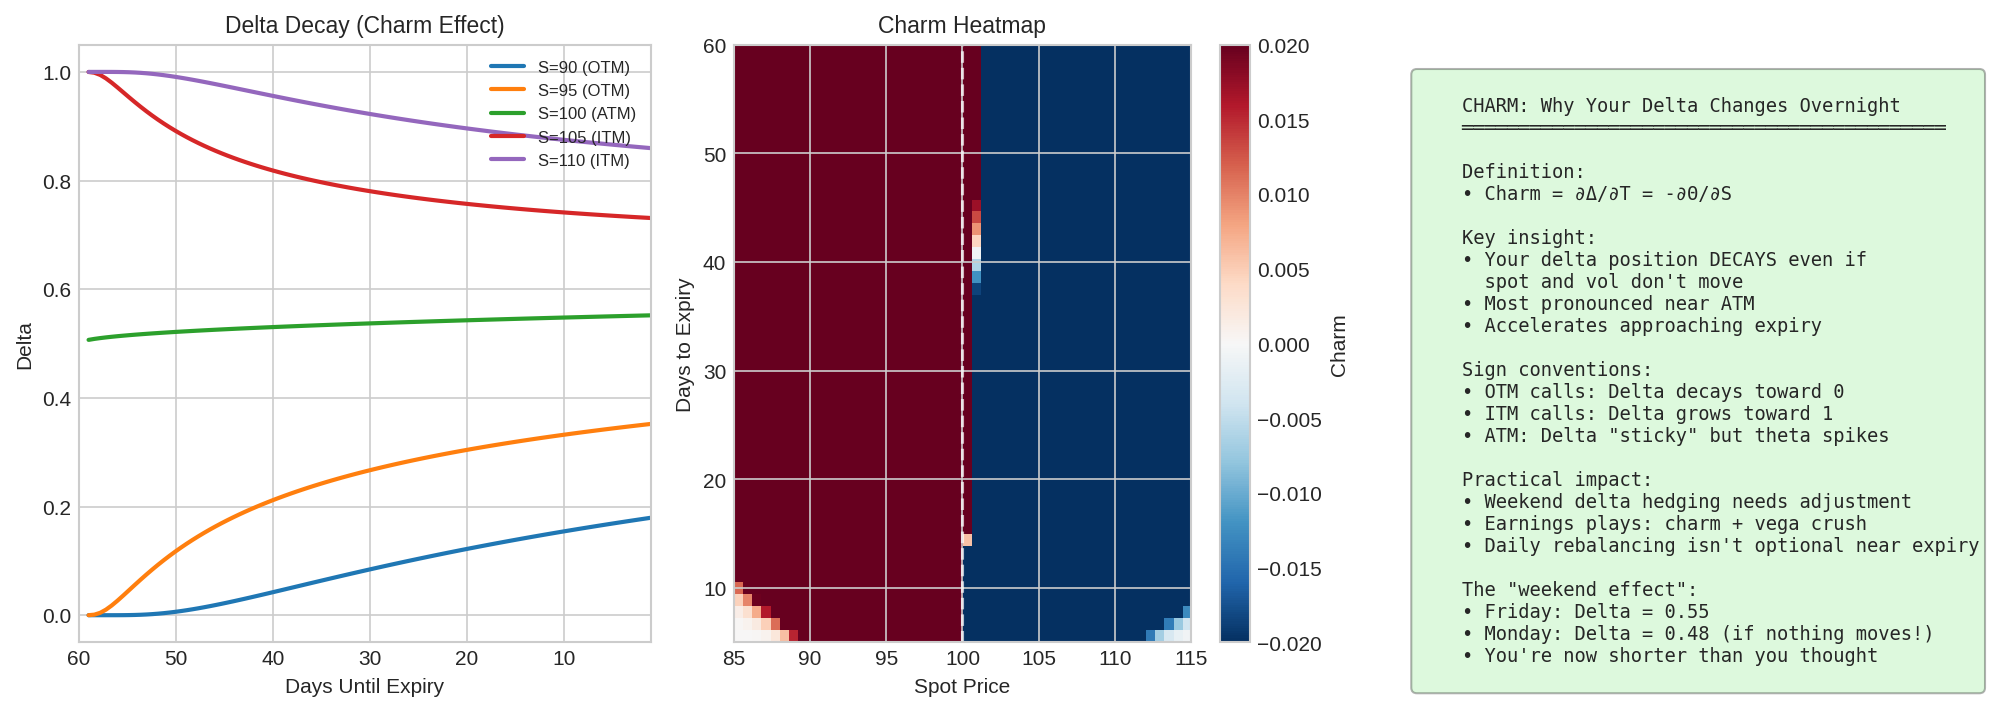
The Weekend Effect
Here’s why charm matters practically. You have an options position on Friday:
Delta = 0.55
Stock hasn’t moved over the weekend
Monday morning, you check your delta:
Delta = 0.48
Wait, what? Nothing moved!
That’s charm. As time passes, OTM options become more OTM (delta decays toward 0), and ITM options become more ITM (delta grows toward 1). ATM options stay roughly 0.50.
Charm Near Expiration
Charm accelerates approaching expiry. In the last few days:
OTM options: Delta collapses rapidly
ITM options: Delta snaps to 1.00
ATM options: Delta becomes unstable (small moves cause big delta swings)
This is why gamma scalping in the last week is dangerous. You’re not just managing gamma — you’re managing charm’s effect on your gamma position.
4. Vomma: Vega’s Convexity
Vomma (also called volga or vega convexity) measures how vega changes as volatility moves:
Vomma = ∂Vega/∂σ = ∂²V/∂σ²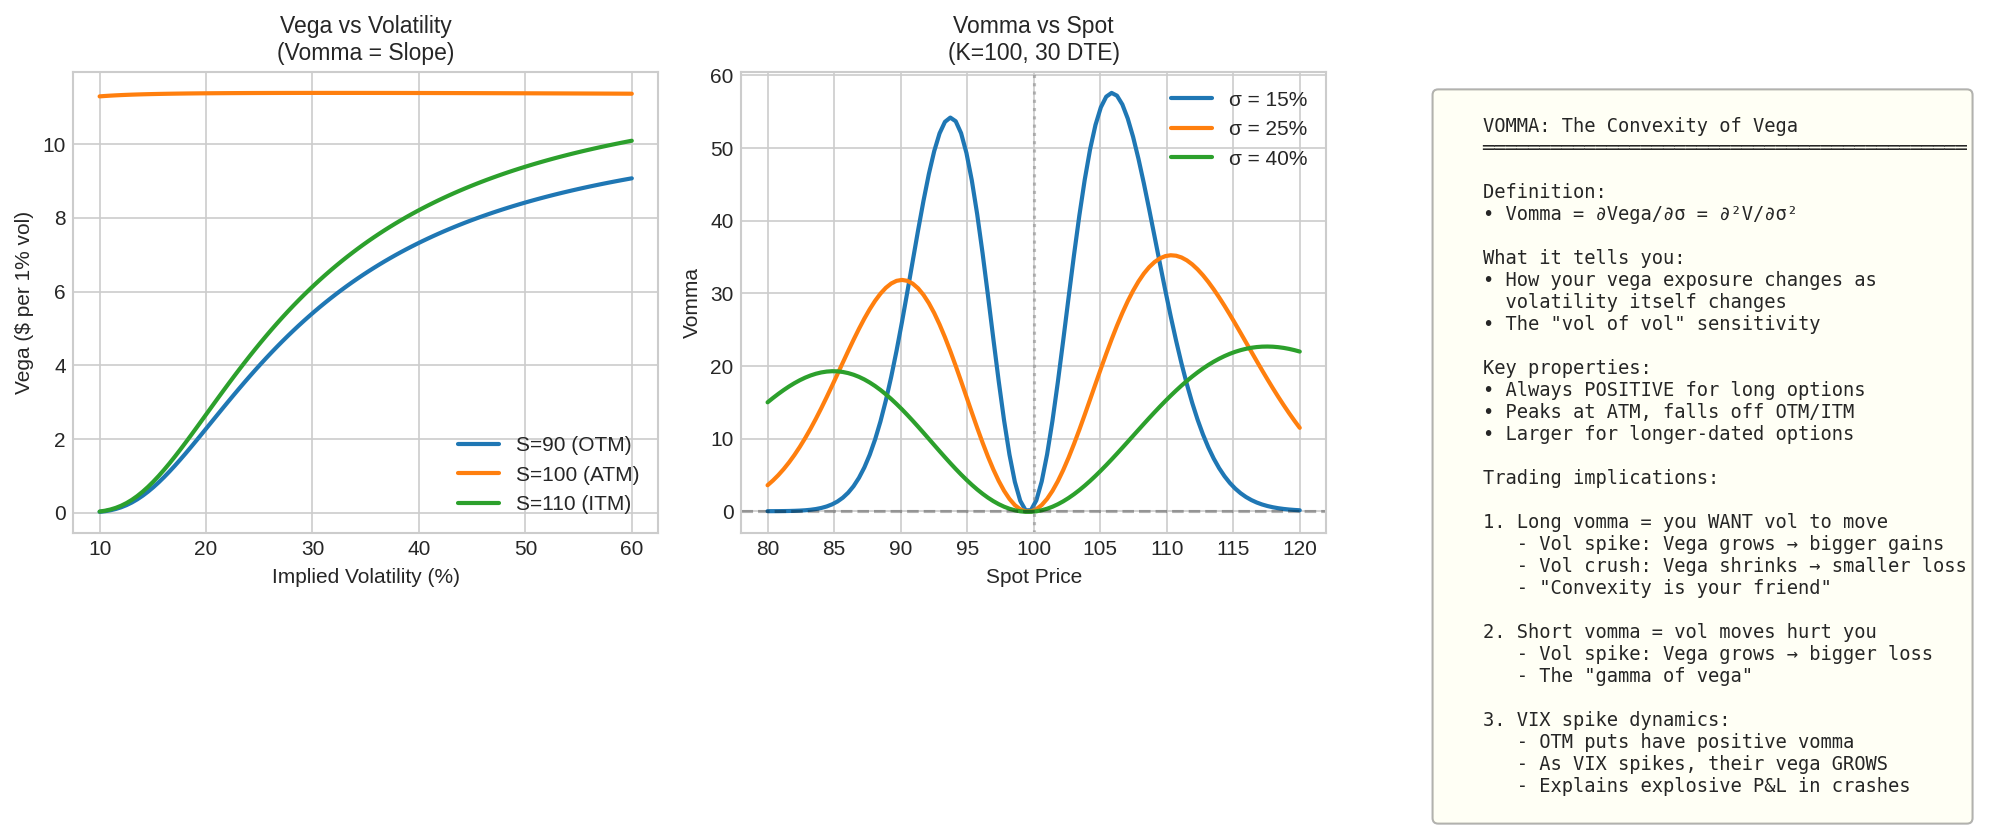
Why Vomma Matters
Long options have positive vomma. This is good:
If volatility rises: your vega increases → you make more money than vega alone predicts
If volatility falls: your vega decreases → you lose less than vega alone predicts
It’s convexity. Just like gamma gives you convexity in spot, vomma gives you convexity in vol.
Short options have negative vomma. This is bad:
Vol spike: your short vega gets even shorter → losses accelerate
This is why selling options into a rising VIX is painful — the position fights you harder the more VIX rises
The Vol Surface Connection
Vomma explains why the volatility smile exists. In a Black-Scholes world (constant vol), vomma would be priced at zero. But because vol itself is stochastic (it moves), options with high vomma (the wings) trade at a premium.
That premium is the smile.
5. Third-Order Greeks
Now we go a bit deeper. Third-order Greeks are the sensitivities of second-order Greeks.
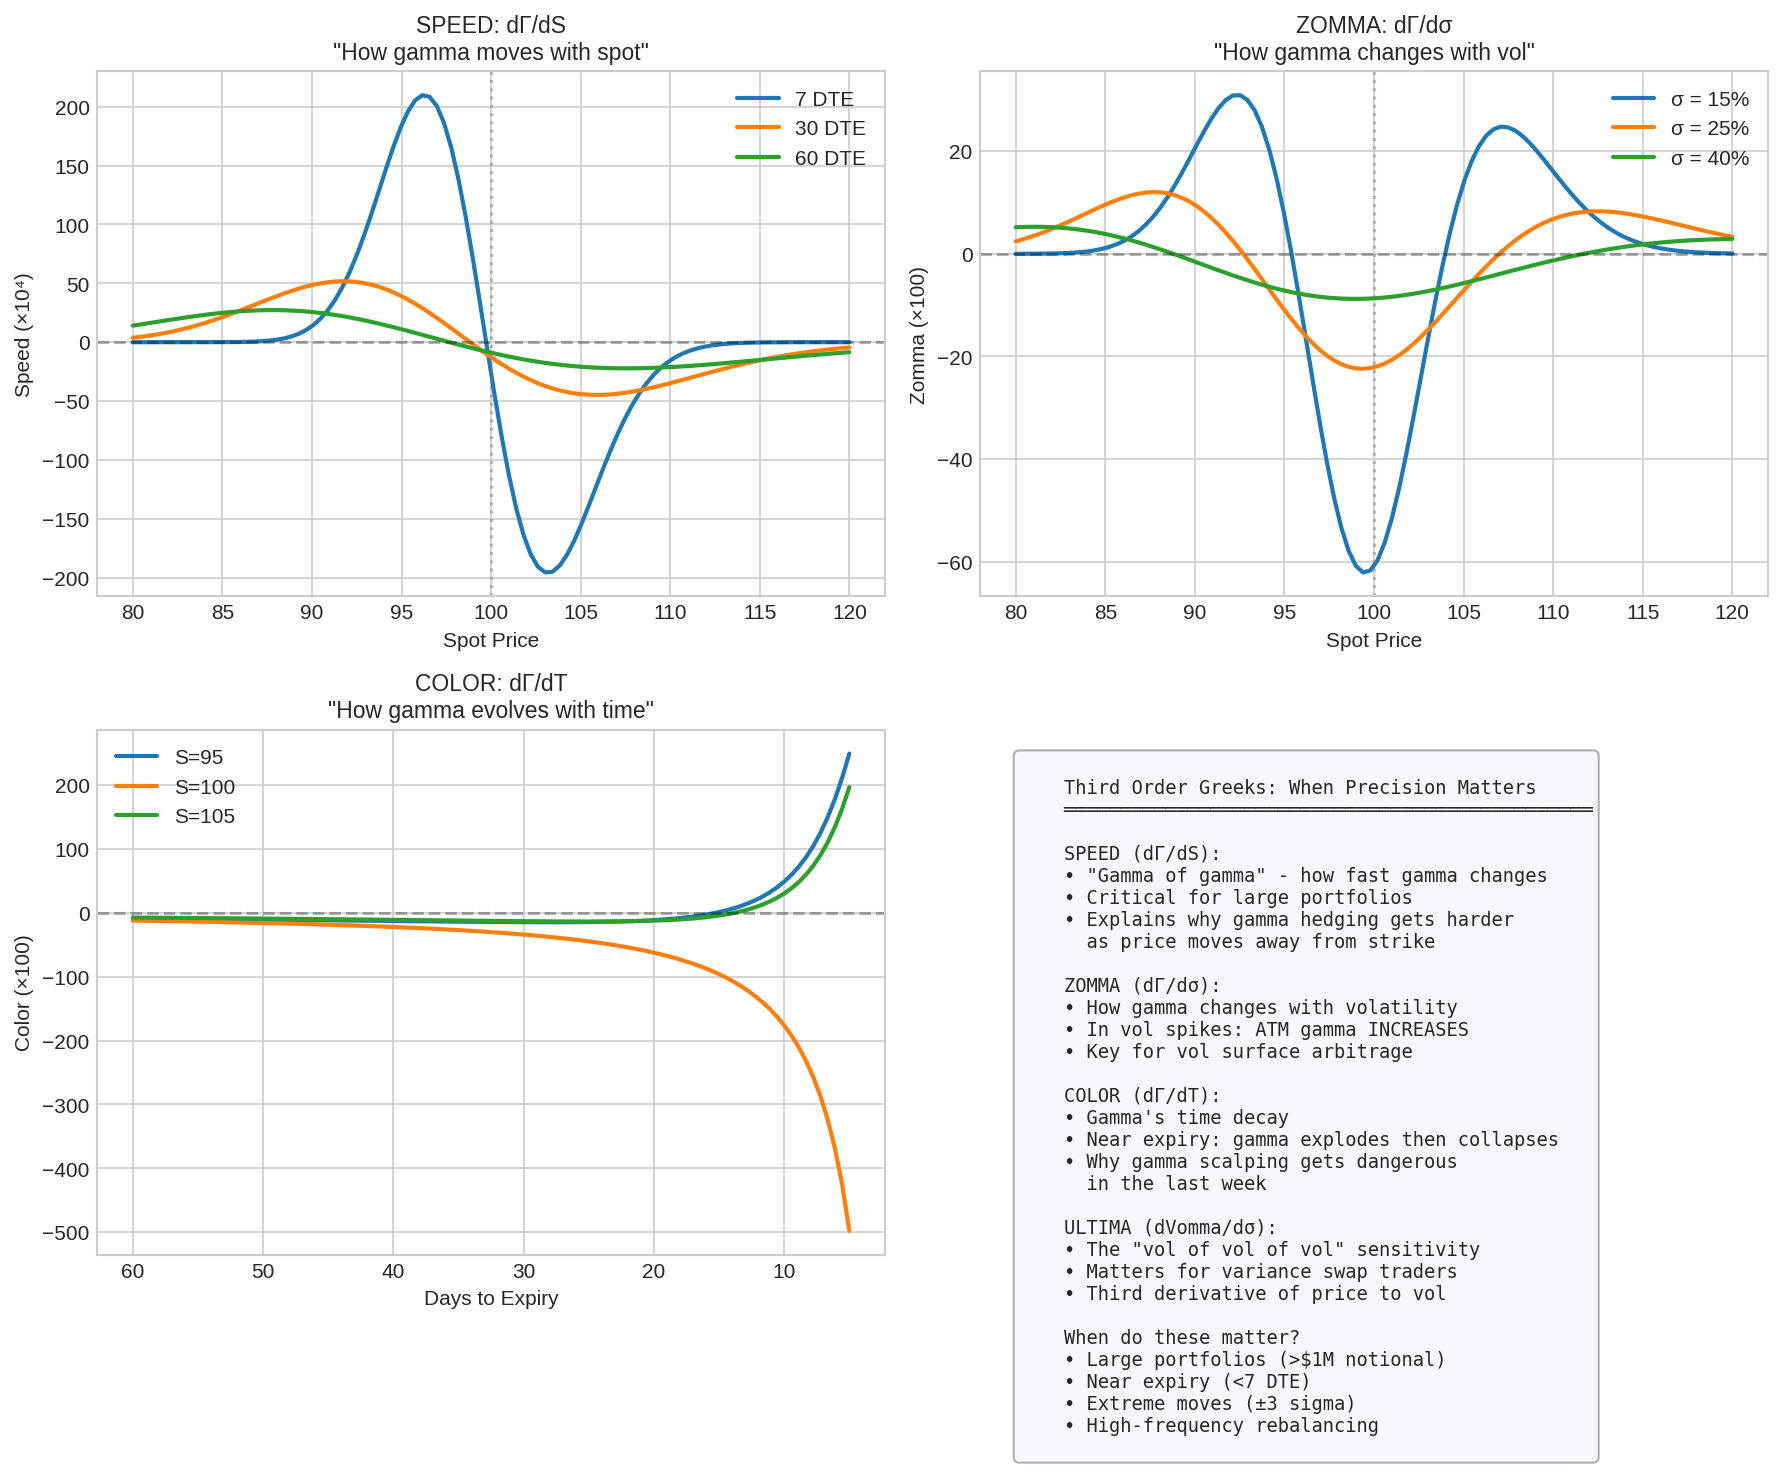
Speed: ∂Γ/∂S
Speed tells you how gamma changes as spot moves:
Speed = -Gamma × (1 + d₁/(σ√T)) / SWhy it matters:
Large portfolios need to know how their gamma will change if the market moves
Speed is highest just before expiration, at slightly OTM options
Explains why gamma hedging gets progressively harder during directional moves
Zomma: ∂Γ/∂σ
Zomma measures how gamma changes with volatility:
Zomma = Gamma × (d₁ × d₂ - 1) / σKey insight: In a vol spike, ATM gamma increases. Your short gamma position gets even shorter.
This creates a double-whammy in selloffs:
Delta moves against you (gamma effect)
Your gamma exposure increases (zomma effect)
Your vega exposure increases (vanna effect)
Everything compounds. This is why short vol positions can unravel so quickly.
Color: ∂Γ/∂T
Color measures gamma’s time decay:
Color = -Gamma / (2T) × [1 + d₁ × (2rT - d₂σ√T)/(σ√T)]As expiration approaches:
ATM gamma explodes (approaching infinity at T=0)
OTM gamma collapses to zero
The transition is violent in the last few days
Color tells you how fast this transition is happening.
Ultima: ∂Vomma/∂σ
Ultima is the third derivative of price with respect to volatility:
Ultima = ∂³V/∂σ³This matters for variance swap traders and anyone with large vomma exposure. It tells you how your vega convexity itself changes as vol moves.
For most retail traders? Honestly, you can ignore this one.
6. Greek Interactions in Practice
The Greeks don’t exist in isolation. They interact, creating complex dynamics:
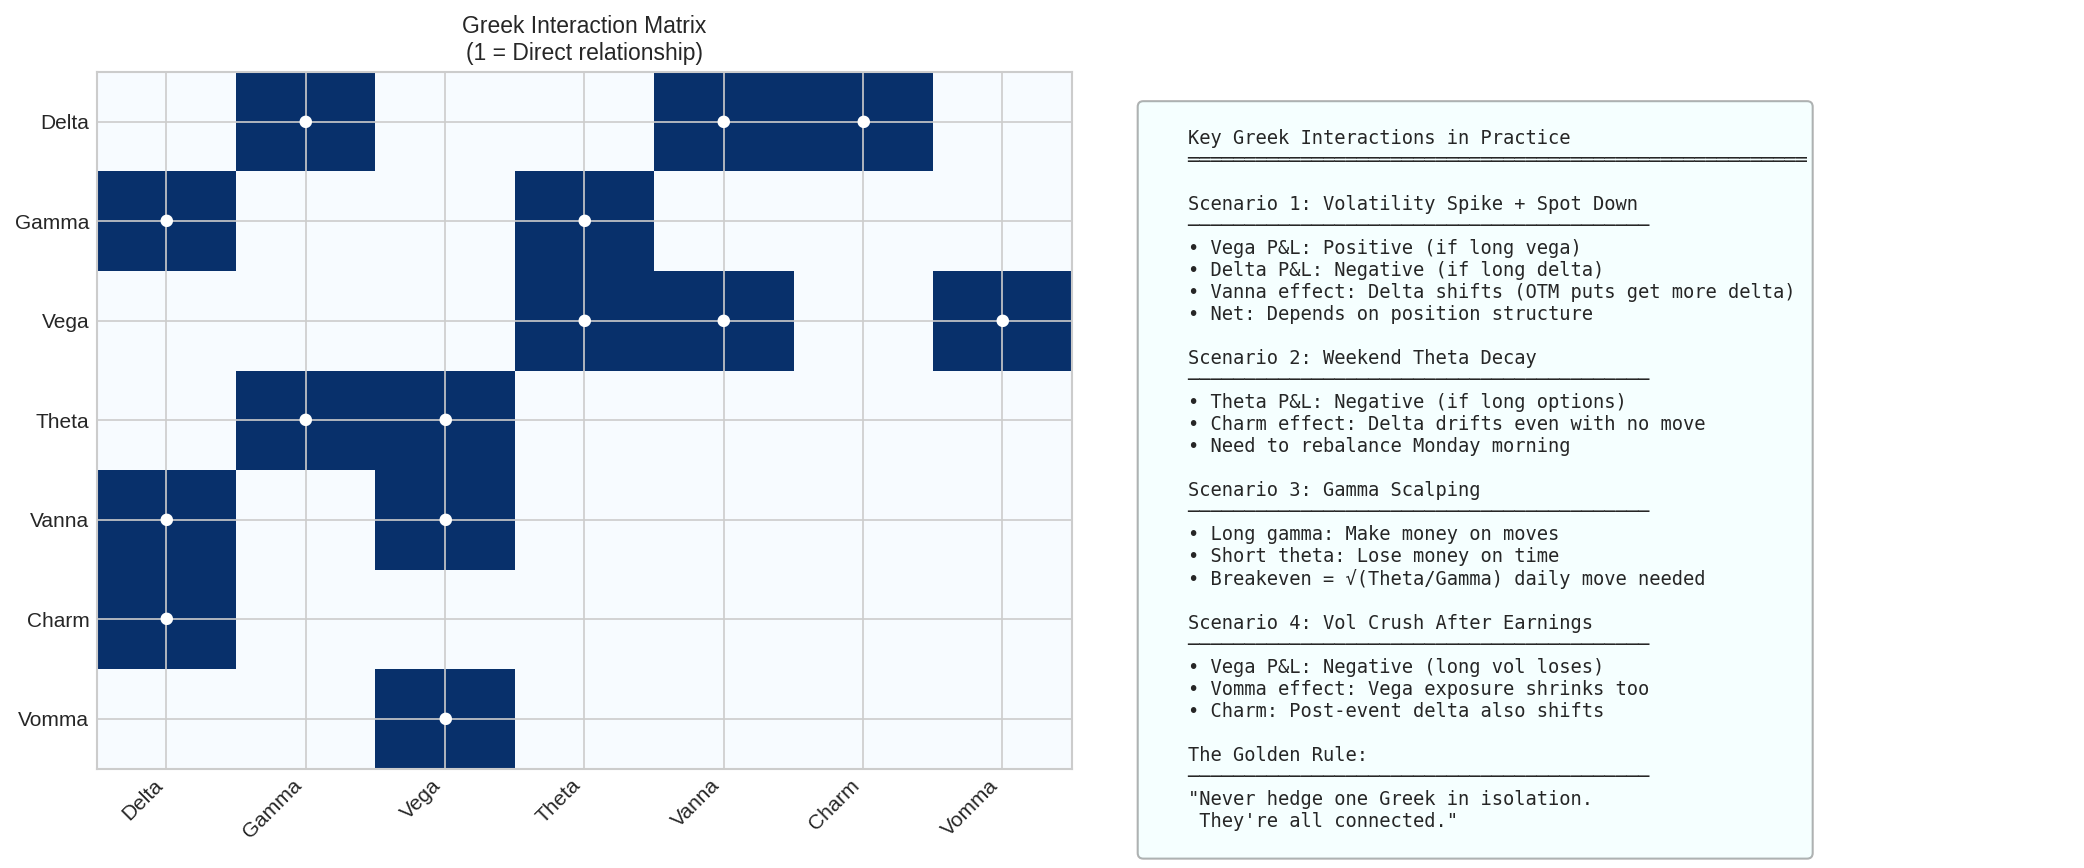
Scenario Analysis
Let’s walk through a realistic scenario: You’re short an iron condor on SPY.
Day 1: Quiet market
Delta ≈ 0 (balanced position)
Theta: +$15/day
Vega: -$50 per 1% vol
Gamma: -0.02
Day 2: Market drops 2%, VIX spikes from 15 to 22
The obvious effects:
Delta P&L: Negative (you were short, became net long as put strikes approach)
Vega P&L: -$50 × 7 = -$350 (big loss from vol spike)
The second-order effects:
Vanna: As VIX rose, your delta shifted further (the put side delta moved more than gamma alone predicts)
Vomma: Your vega exposure increased from -$50 to -$65 per 1% vol
Zomma: Your gamma exposure got worse (more negative)
Day 3: Market rebounds, VIX drops to 18
Partial recovery, but the vomma effect means your vega recovered some of the loss automatically. This is the “convexity benefit” of being short options with positive vomma in the wings... wait, we’re short, so it’s negative vomma. The recovery is actually less than vega alone predicts.
This is why short vol positions are said to have “negative convexity” — they hurt more going against you than they help when coming back.
7. Practical Implications
For Position Management
Don’t hedge just delta. Your delta is going to change. Estimate the second-order effects (gamma, vanna, charm) before sizing your hedge.
Weekends matter. Charm means your Monday position is different from your Friday position, even if nothing moves. For short-dated options, consider reducing exposure Friday afternoon.
Vol spikes are non-linear. Vomma and zomma mean that a VIX spike from 15→25 is much worse than two spikes from 15→20 and 20→25. The damage accelerates.
For Strategy Selection
Long gamma, short vanna positions (like straddles on individual stocks) benefit from moves but suffer if vol spikes without a move.
Short gamma, long vomma positions (like selling wing options) actually want vol to spike, because their short vega shrinks. But they’re hurt by any actual moves.
Calendar spreads have positive vanna (unusual for premium-selling strategies). This gives them some natural protection in vol spikes.
For Risk Management
Monitor your vanna and vomma exposure, not just delta and vega. A position that looks “delta neutral, vega neutral” can still blow up if it has large vanna exposure going into a volatile period.
8. The Formulas (Reference)
First Order Greeks
──────────────────
Delta (call) = e^(-qT) × N(d₁)
Vega = S × e^(-qT) × N'(d₁) × √T
Theta = -S × e^(-qT) × N'(d₁) × σ/(2√T) - rKe^(-rT)N(d₂)


Second Order Greeks
───────────────────
Gamma = e^(-qT) × N'(d₁) / (S × σ × √T)

Vanna = -e^(-qT) × N'(d₁) × d₂ / σ
      = Vega × (1 - d₁/(σ√T)) / S

Charm = -e^(-qT) × N'(d₁) × [2(r-q)T - d₂σ√T] / (2T × σ√T)

Vomma = Vega × d₁ × d₂ / σ

Veta  = -Vega × [r + d₁ × (r-q)/(σ√T) - (1 + d₁d₂)/(2T)]


Third Order Greeks
──────────────────
Speed = -Gamma × (1 + d₁/(σ√T)) / S

Zomma = Gamma × (d₁ × d₂ - 1) / σ

Color = -Gamma / (2T) × [1 + d₁ × (2rT - d₂σ√T)/(σ√T)]

Ultima = -Vomma / σ × [d₁d₂ - d₁/d₂ - d₂/d₁ - 1]


Where:
  N(x) = standard normal CDF
  N'(x) = standard normal PDF = (1/√2π) × e^(-x²/2)
  d₁ = [ln(S/K) + (r - q + σ²/2)T] / (σ√T)
  d₂ = d₁ - σ√T
  q = dividend yield
9. Coming Up
Part 64: Building a Volatility Surface — extracting and interpolating IV from market data
Part 65: Practical Vol Trading — my actual approach
Remember: Alpha is never guaranteed. And the backtest is a liar until proven otherwise.
The Greeks are theoretical sensitivities based on Black-Scholes assumptions. Reality is messier: jumps, discrete hedging, transaction costs, and liquidity all create deviations from these formulas.
The material presented in Math & Markets is for informational purposes only. It does not constitute investment or financial advice.