
The Volatility Series, Part 2: Trading Strategies
Part 61 — Volatility Series 2 of 7 — Straddles, iron condors, calendars, and when to use each

This is part 61 of my series — Building & Scaling Algorithmic Trading Strategies
In Part 60, we covered what volatility is — mathematically and intuitively. Now we get to the good part: how to trade it!
Volatility trading strategies fall into two camps:
Long volatility: Profit when realized vol exceeds implied (or when IV itself rises)
Short volatility: Profit when realized vol stays below implied (collect the VIX premium)
Each has its place. The key is matching the strategy to your market view (and your risk appetite).
1. Long Volatility Strategies
Long vol strategies profit from big moves. You’re paying premium (theta decay works against you) but you benefit when the underlying moves more than the market expected.
1.1 The Long Straddle
Buy an ATM call and an ATM put at the same strike and expiry.
Long Straddle Structure
───────────────────────
+ 1 ATM Call (K = 100)
+ 1 ATM Put  (K = 100)

Cost: Call premium + Put premium
Max loss: Total premium paid
Max gain: Unlimited (either direction)
Breakevens: K ± total premium
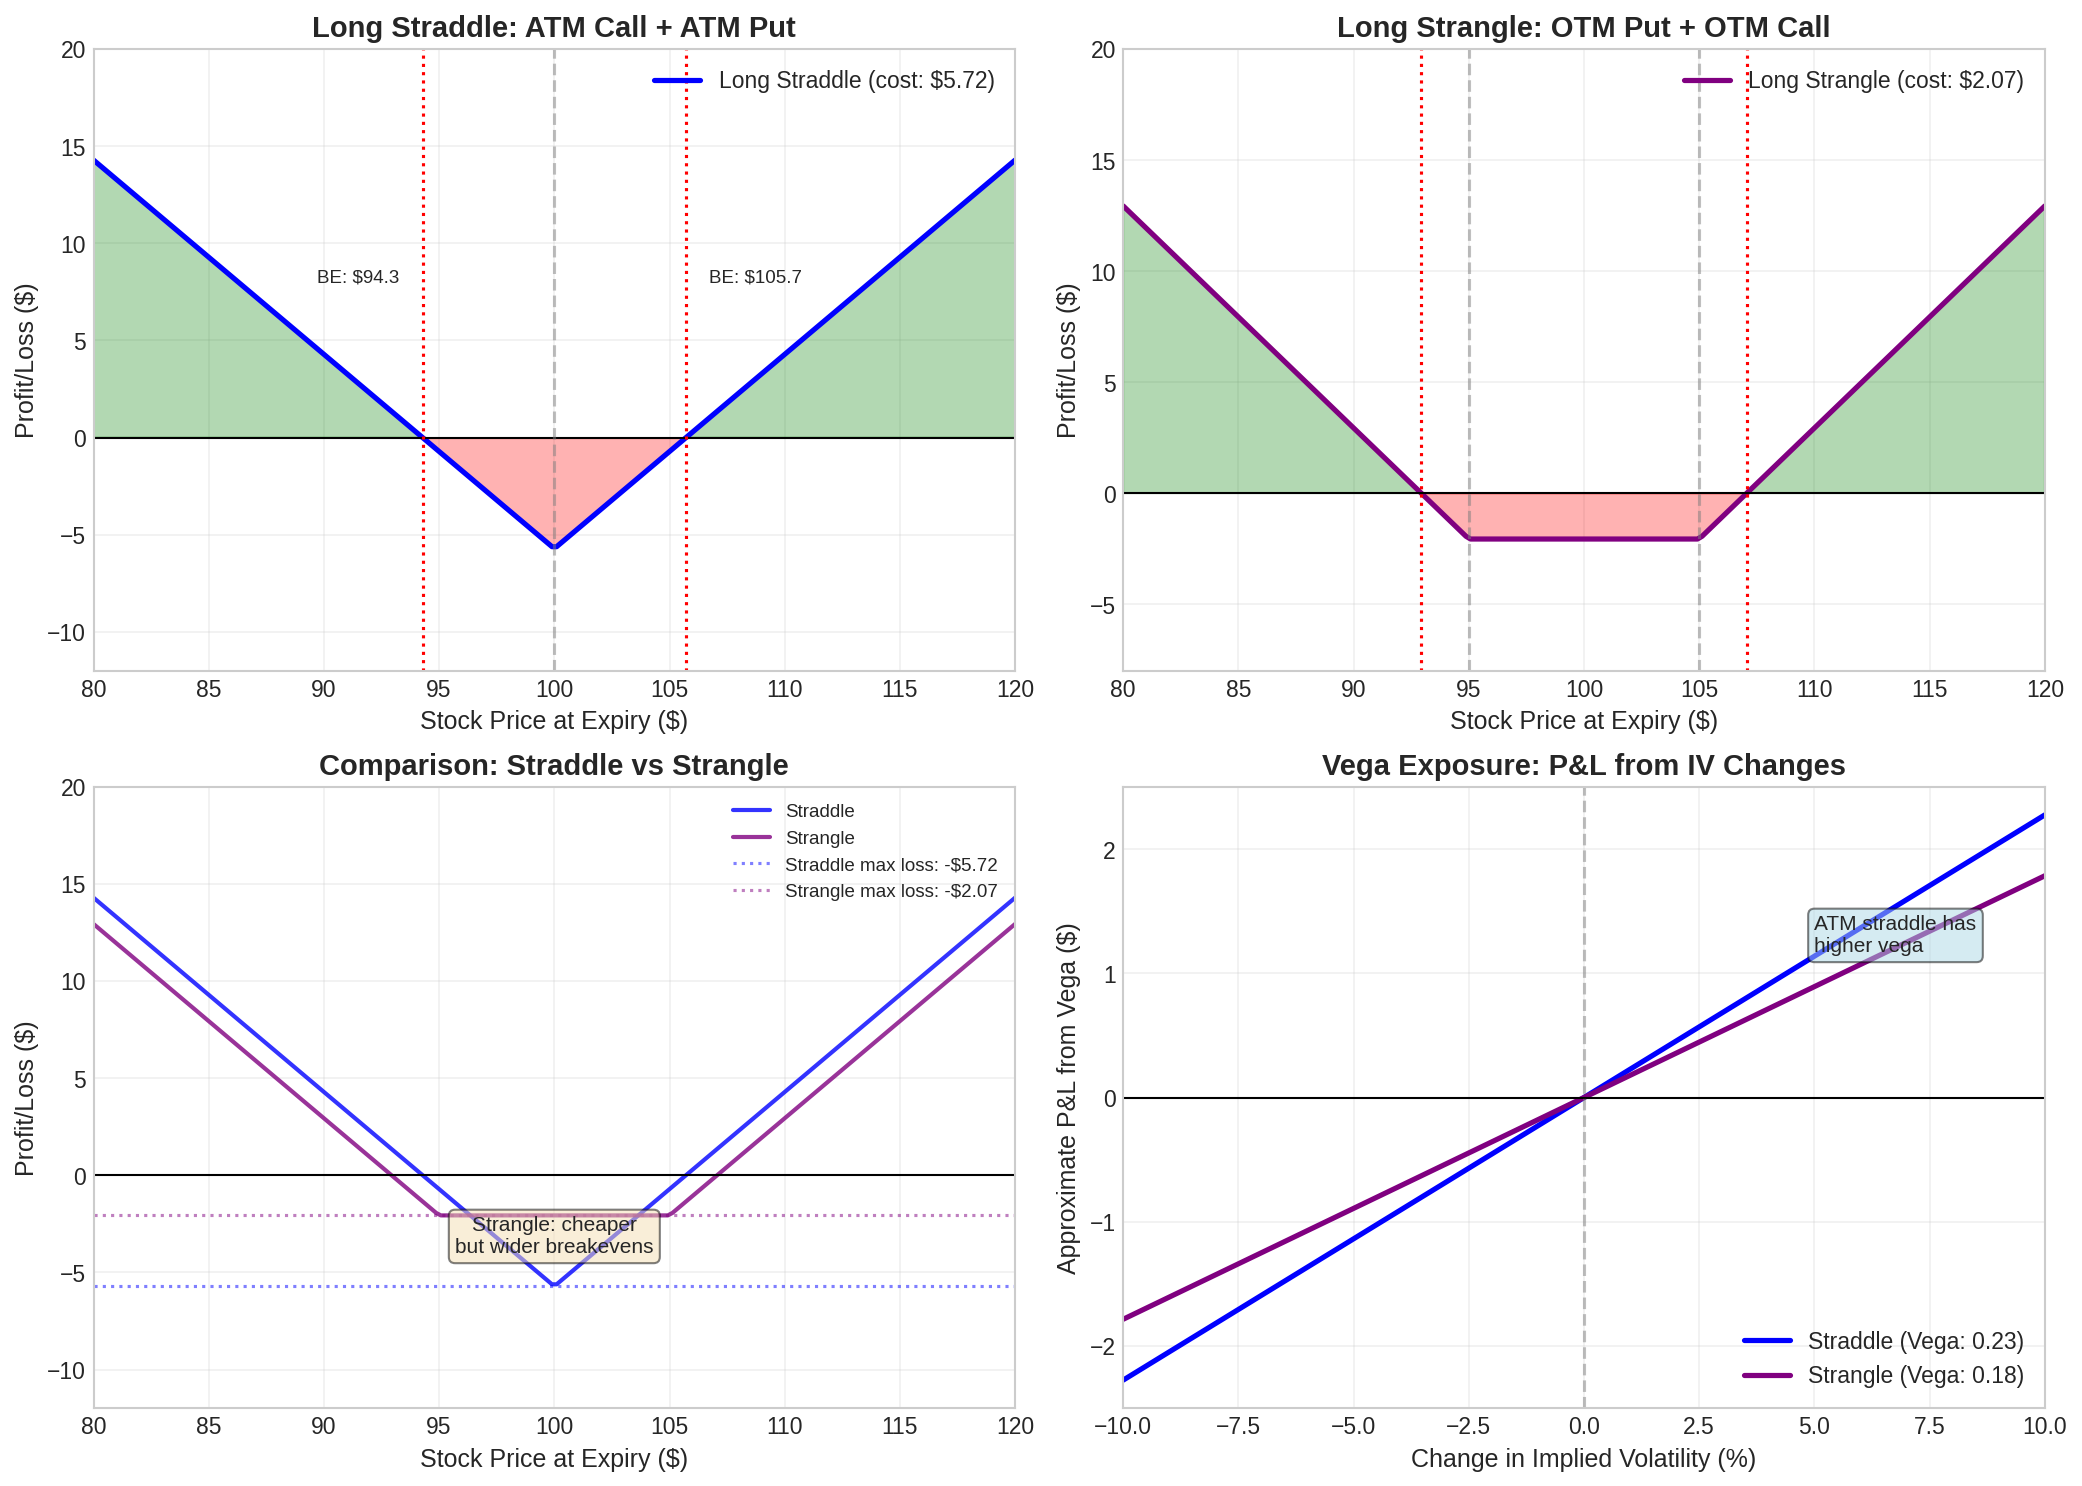
The math is straightforward. With a $100 stock and 30-day 25% IV:
Call premium ≈ $4.50
Put premium  ≈ $4.00
Total cost   = $8.50

Breakevens:
  Downside: $100 - $8.50 = $91.50
  Upside:   $100 + $8.50 = $108.50

Required move: ±8.5% to break even
The stock needs to move 8.5% in either direction just to cover your premium. Imagine that — it’s such a high bar and that is why straddles are expensive when IV is elevated.
1.2 The Long Strangle
Buy an OTM call and an OTM put at different strikes.
Long Strangle Structure
───────────────────────
+ 1 OTM Put  (K = 95)
+ 1 OTM Call (K = 105)

Cost: Lower than straddle (OTM options cheaper)
Max loss: Total premium paid
Max gain: Unlimited
Breakevens: Put strike - premium, Call strike + premium
The strangle costs less but requires a bigger move:
Put premium (K=95)   ≈ $1.80
Call premium (K=105) ≈ $1.50
Total cost           = $3.30

Breakevens:
  Downside: $95 - $3.30 = $91.70
  Upside:   $105 + $3.30 = $108.30
Cheaper entry, but now you need the stock outside the $91.70-$108.30 range to profit—a wider zone of max loss.
1.3 Straddle vs Strangle: The Tradeoff
                    Straddle    Strangle
────────────────────────────────────────
Premium paid         $8.50       $3.30
Max loss             $8.50       $3.30
Breakeven range      ±8.5%       ~±8.5%
Vega exposure        Higher      Lower
Theta decay          Faster      Slower
Use straddles when:
You expect a large move but don’t know direction
IV is relatively low (cheaper entry)
You want maximum vega exposure
Use strangles when:
You want cheaper exposure to big moves
You’re okay with a wider loss zone
Capital efficiency matters
1.4 The Vega Play
Long vol positions profit from IV increases even without underlying movement:
Vega P&L = Vega × ΔIV × 100

Example (long straddle):
  Vega = $0.15 per 1% IV
  If IV rises from 25% to 30%: P&L = $0.15 × 5 × 100 = $7.50

This can offset theta decay if IV expansion happens quickly.
2. Short Volatility Strategies
Short vol strategies collect premium and profit when the underlying stays range-bound. You’re betting that realized volatility will be lower than implied—harvesting the VIX premium.
2.1 The Short Straddle
Sell an ATM call and put. Mirror image of long straddle.
Short Straddle Structure
────────────────────────
- 1 ATM Call (K = 100)
- 1 ATM Put  (K = 100)

Credit: Call premium + Put premium
Max gain: Total premium received
Max loss: Unlimited (both directions)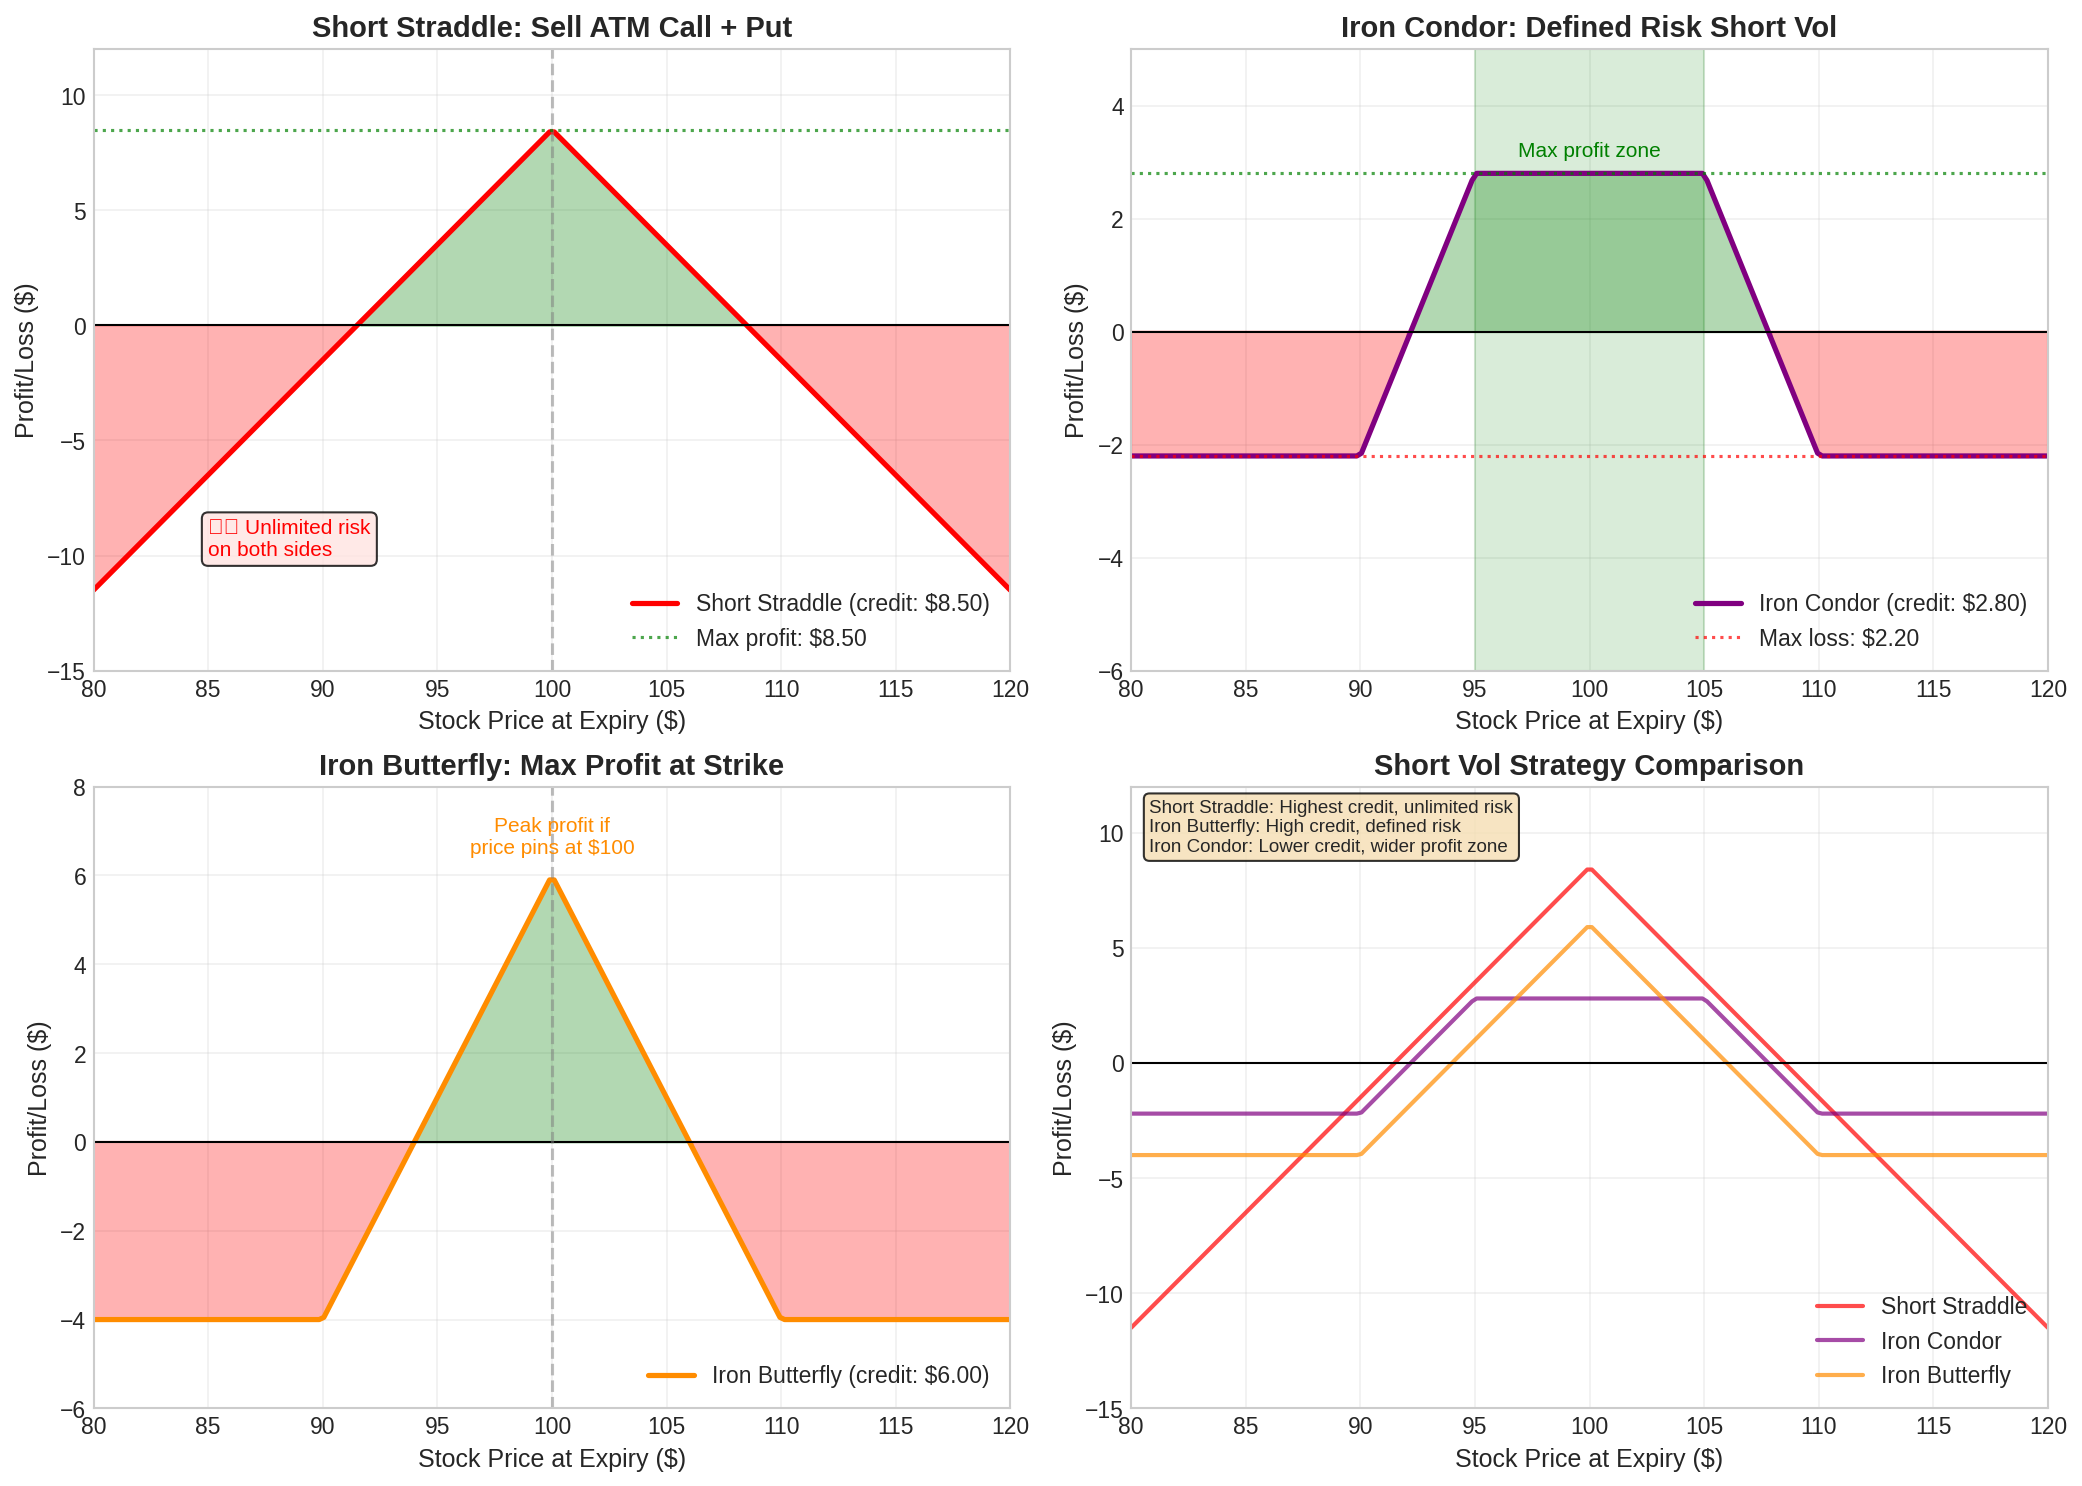
The economics:
Premium collected = $8.50
Max profit = $8.50 (if stock pins at $100)
Max loss = Unlimited

P(profit) ≈ 65% (stock stays within breakevens)
Risk/reward = Asymmetric (small wins, potential large losses)
The catch: Unlimited risk on both sides. One tail event can wipe out months of collected premium.
2.2 The Iron Condor
A defined-risk short vol structure. Sell an OTM put spread and an OTM call spread.
Iron Condor Structure
─────────────────────
+ 1 Put  (K = 90)   — long wing
- 1 Put  (K = 95)   — short
- 1 Call (K = 105)  — short
+ 1 Call (K = 110)  — long wing

Credit: ~$2.80 (net of all four legs)
Max gain: Premium received
Max loss: Wing width - premium = $5 - $2.80 = $2.20
The iron condor caps your risk:
Max profit zone: $95 - $105 (stock stays between short strikes)
Max loss: $2.20 per spread
Risk/reward: 2.20 risk / 2.80 reward = 0.79:1
P(max profit): ~40%
P(any profit): ~70%
Why it works: You’re selling volatility with insurance. The long wings cost you some premium but turn unlimited risk into defined risk.
As an aside, this is one of my favorite trading strategies. I’m at-heart a fairly conservative investor and trader, and I will happily lose some upside to capture defined risk.
2.3 The Iron Butterfly
Like an iron condor, but with both short strikes at the same price (ATM).
Iron Butterfly Structure
────────────────────────
+ 1 Put  (K = 90)
- 1 Put  (K = 100)
- 1 Call (K = 100)
+ 1 Put  (K = 110)

Credit: ~$6.00 (higher than IC because ATM options are pricier)
Max gain: $6.00 (only if stock pins exactly at $100)
Max loss: Wing width - premium = $10 - $6 = $4
The butterfly has a peaked profit profile:
Sweet spot: Stock at exactly $100 at expiry
Breakevens: $94 and $106
Risk/reward: 4.00 risk / 6.00 reward = 0.67:1
P(max profit): Very low (need exact pin)
P(any profit): ~55%
Iron butterfly vs iron condor:
Butterfly: Higher credit, narrower profit zone, peaks at center
Condor: Lower credit, wider profit zone, flat max profit region
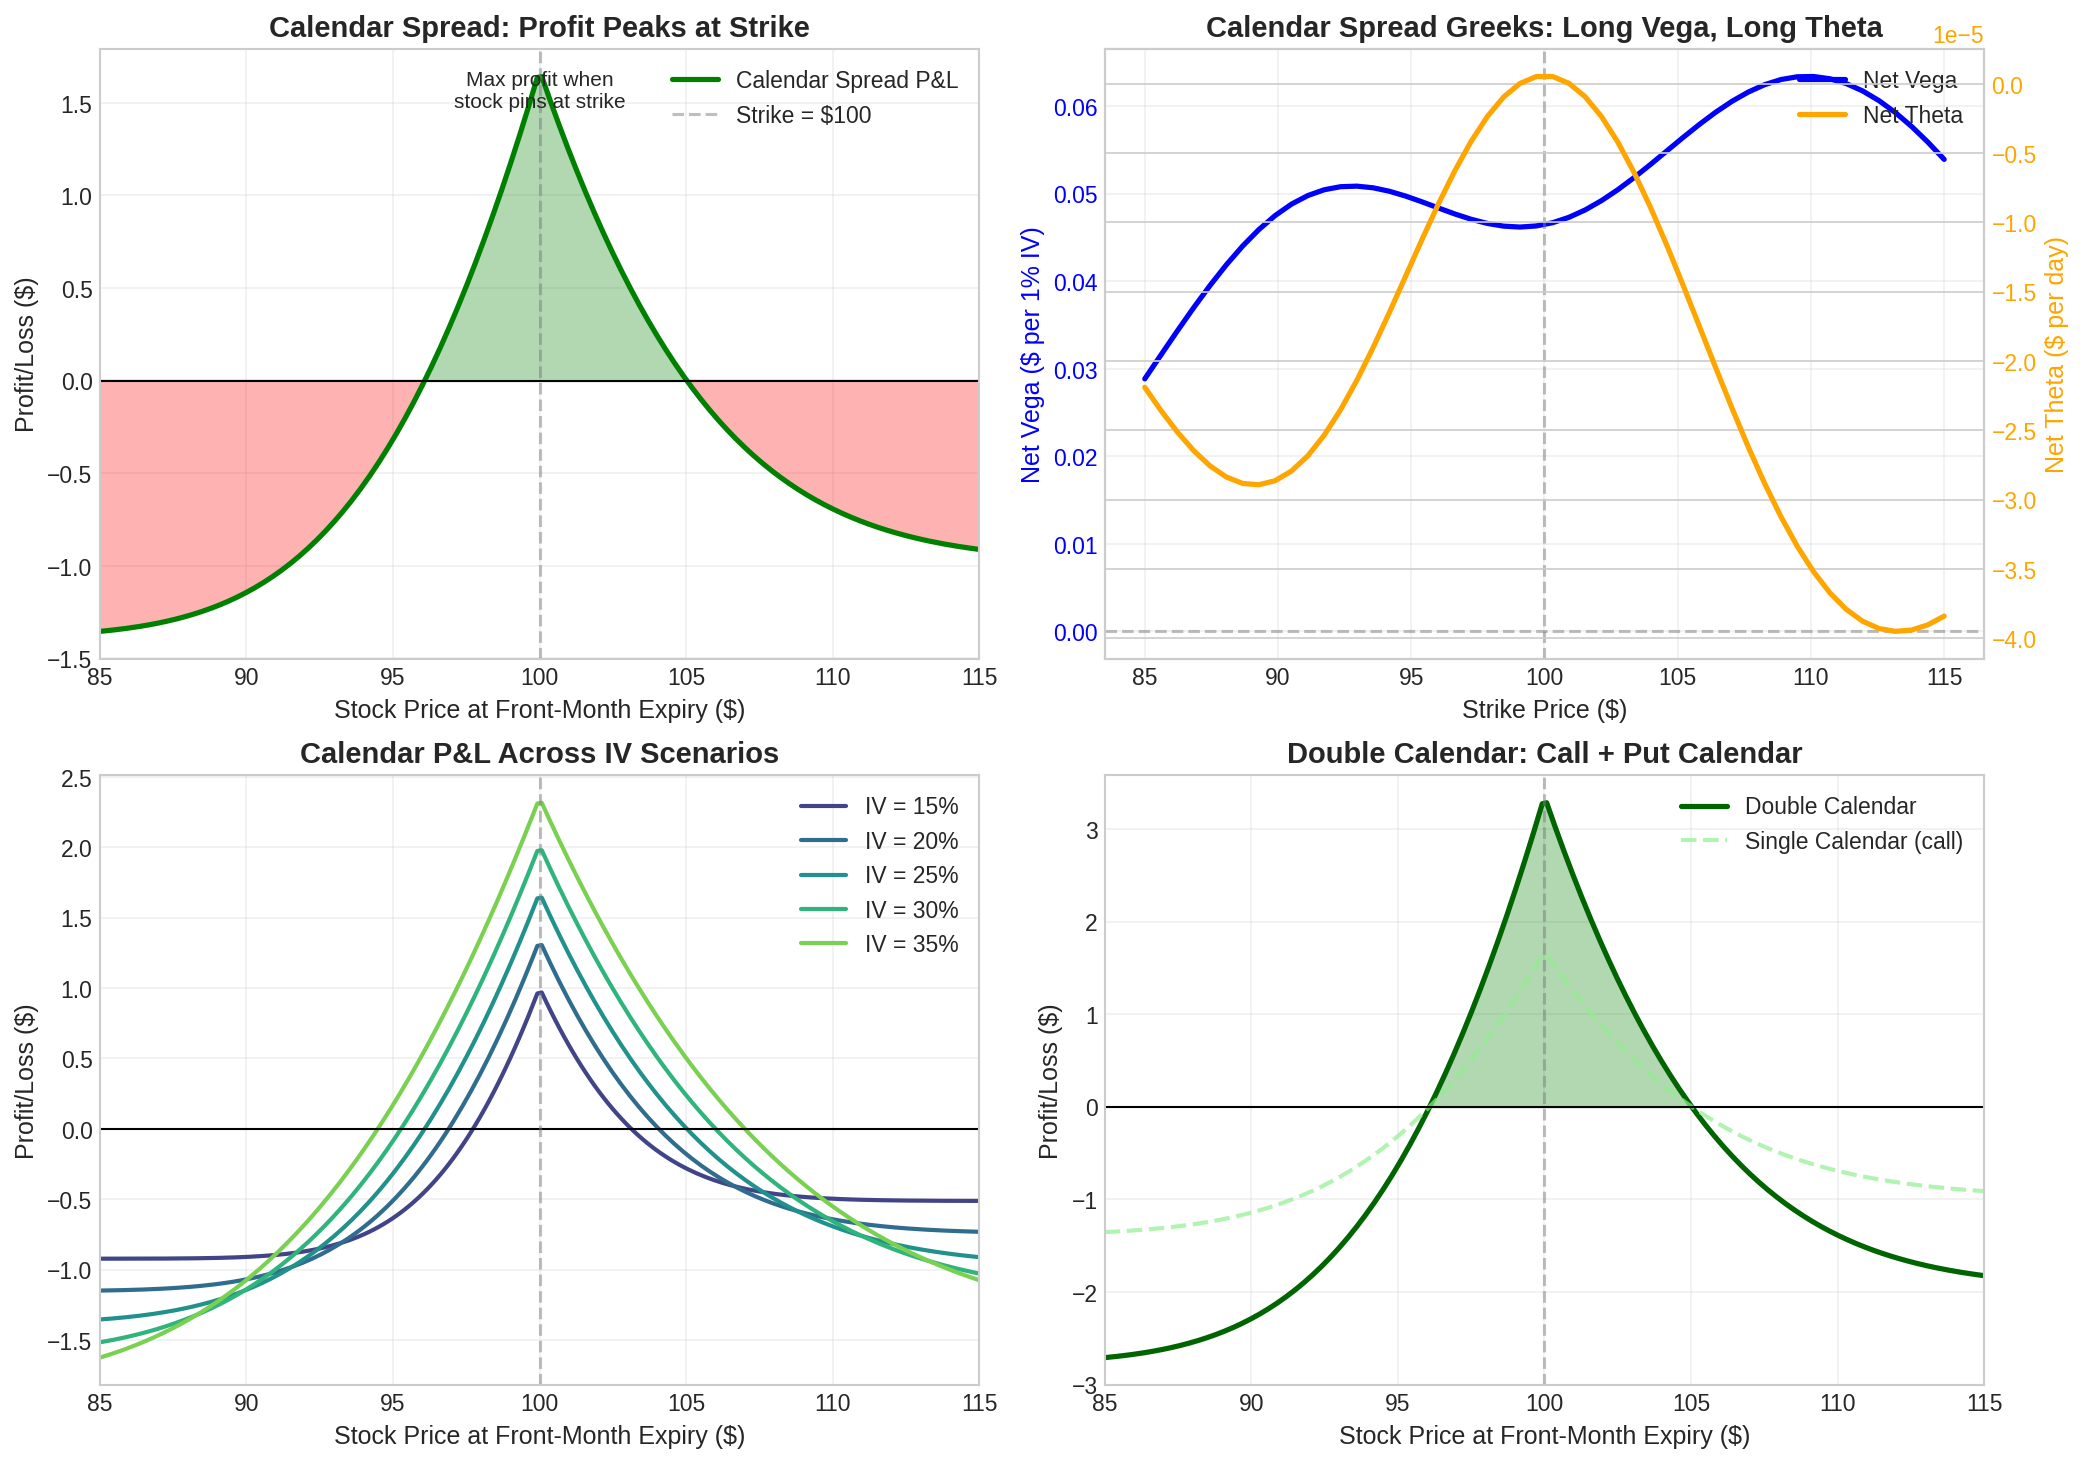
3. Calendar Spreads
Calendars exploit the term structure of volatility—the fact that options with different expirations have different IVs and decay rates.
3.1 The Long Calendar
Sell a near-term option, buy a longer-term option at the same strike.
Long Calendar Structure
───────────────────────
- 1 Call, 30 DTE (K = 100)  — short front month
+ 1 Call, 60 DTE (K = 100)  — long back month

Net debit: Back premium - Front premium ≈ $1.50
Max gain: When stock at strike at front expiry
Max loss: Net debit paid
The mechanics:
At front-month expiry:
  - Short call expires (worthless if OTM, assigned if ITM)
  - Long call still has 30 days of time value

Ideal scenario: Stock at $100 at front expiry
  - Short call expires worthless
  - Long call has maximum extrinsic value
  - P&L ≈ Long call value - initial debit
3.2 Calendar Greeks
Calendars have a unique Greek profile:
Net Vega: POSITIVE (long back-month vega > short front-month vega)
Net Theta: POSITIVE (short front-month decays faster)
Net Delta: Near zero (if ATM)
Net Gamma: Negative (short gamma from front month dominates near expiry)
This makes calendars long vega, long theta—a rare combination. You profit from:
Time passing (theta)
IV increasing (vega)
Stock staying near strike (gamma)
3.3 Double Calendar
A double calendar combines a call calendar and put calendar at the same strike:
Double Calendar Structure
─────────────────────────
- 1 Put,  30 DTE (K = 100)
+ 1 Put,  60 DTE (K = 100)
- 1 Call, 30 DTE (K = 100)
+ 1 Call, 60 DTE (K = 100)

Effect: 2x the vega, 2x the theta, higher cost
Profit zone: Wider than single calendar
Use double calendars when you have high conviction that the stock will stay near a specific price through front-month expiry.
4. Strategy Selection Framework
Choosing the right strategy depends on two inputs:
IV Rank: Is current IV high or low relative to its historical range?
Directional View: Bullish, bearish, or neutral?
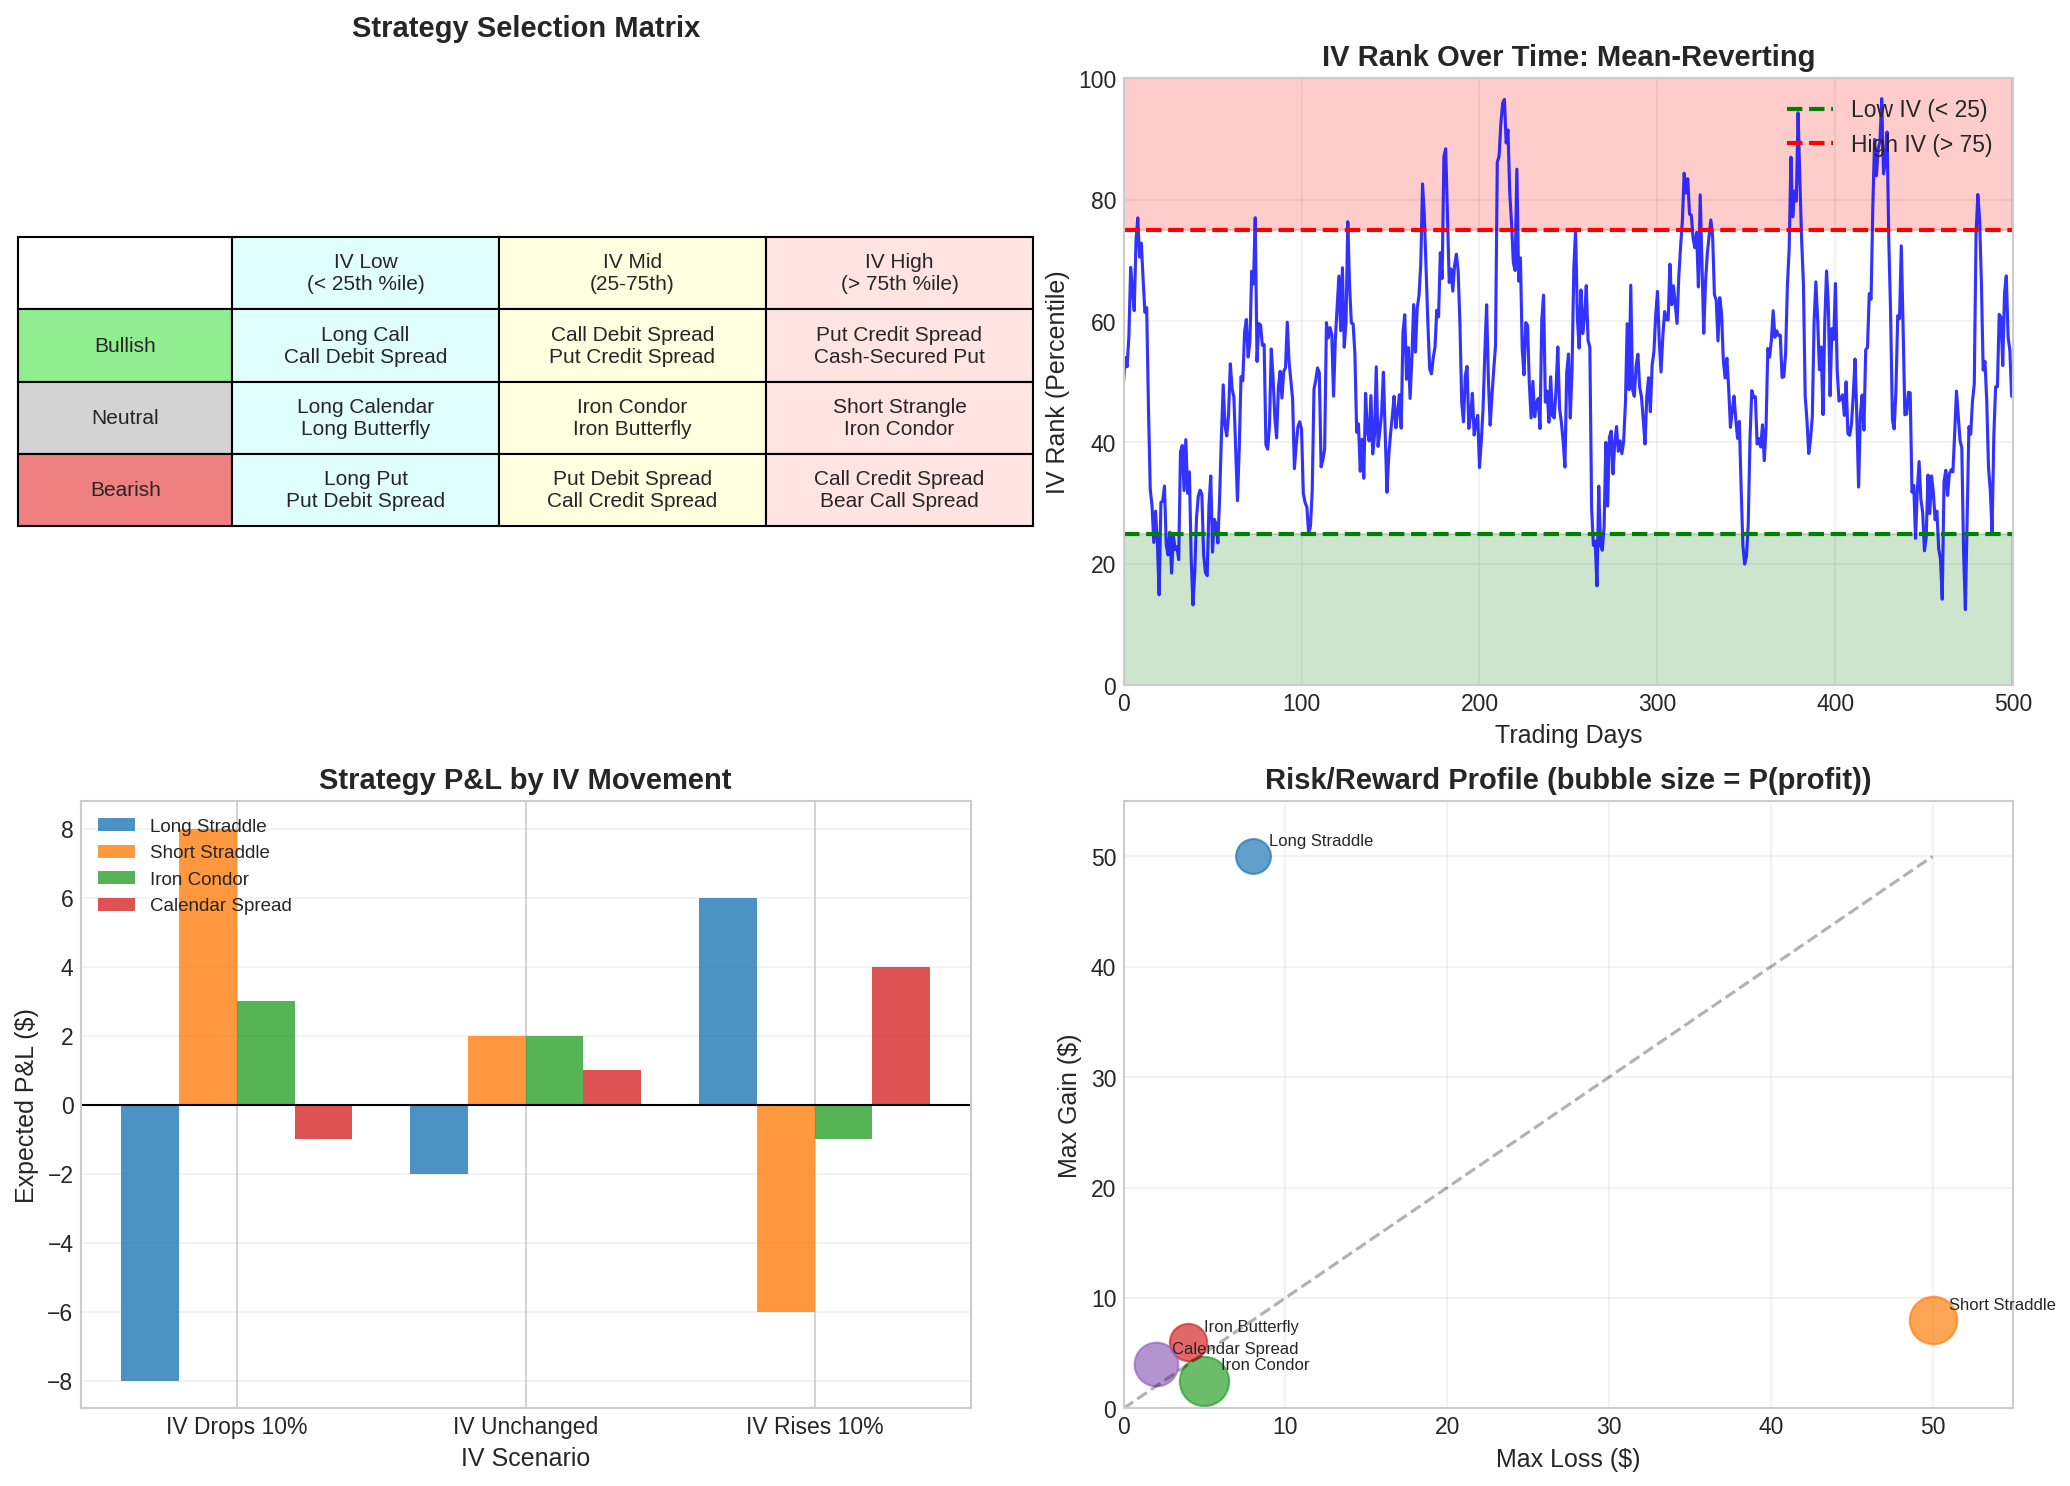
4.1 IV Rank
IV Rank measures where current IV sits in its 52-week range:
IV Rank = (Current IV - 52w Low) / (52w High - 52w Low) × 100

Example:
  Current IV = 25%
  52-week low = 15%
  52-week high = 45%

  IV Rank = (25 - 15) / (45 - 15) × 100 = 33%
High IV Rank (> 75%): Favor selling premium
Iron condors, credit spreads, short strangles
IV likely to mean-revert lower
Low IV Rank (< 25%): Favor buying premium
Long straddles, calendars, debit spreads
IV likely to expand
4.2 The Selection Matrix
                IV Low (<25%)       IV Mid (25-75%)      IV High (>75%)
────────────────────────────────────────────────────────────────────────
Bullish         Long Call           Call Debit Sp.    Put Credit Sp.
                Call Debit Spread   Put Credit Sp.    Cash-Secured Put

Neutral         Long Calendar       Iron Condor          Short Strangle
                Long Butterfly      Iron Butterfly       Iron Condor

Bearish         Long Put            Put Debit Sp.     Call Credit Sp.
                Put Debit Sp.    Call Credit Sp.   Bear Call Sp.

** Sp. = Spread
4.3 P&L by IV Scenario
Different strategies respond differently to IV changes:
Strategy         IV Drops    IV Unchanged    IV Rises
─────────────────────────────────────────────────────
Long Straddle      -$8          -$2            +$6
Short Straddle     +$8          +$2            -$6
Iron Condor        +$3          +$2            -$1
Calendar Spread    -$1          +$1            +$4
Calendars are interesting: they profit from IV rising (long vega) AND from time passing (long theta). This makes them attractive in low-IV environments where you expect volatility to expand.
5. VIX Term Structure Trading
Beyond options on individual stocks, you can trade volatility directly through VIX futures and ETPs.
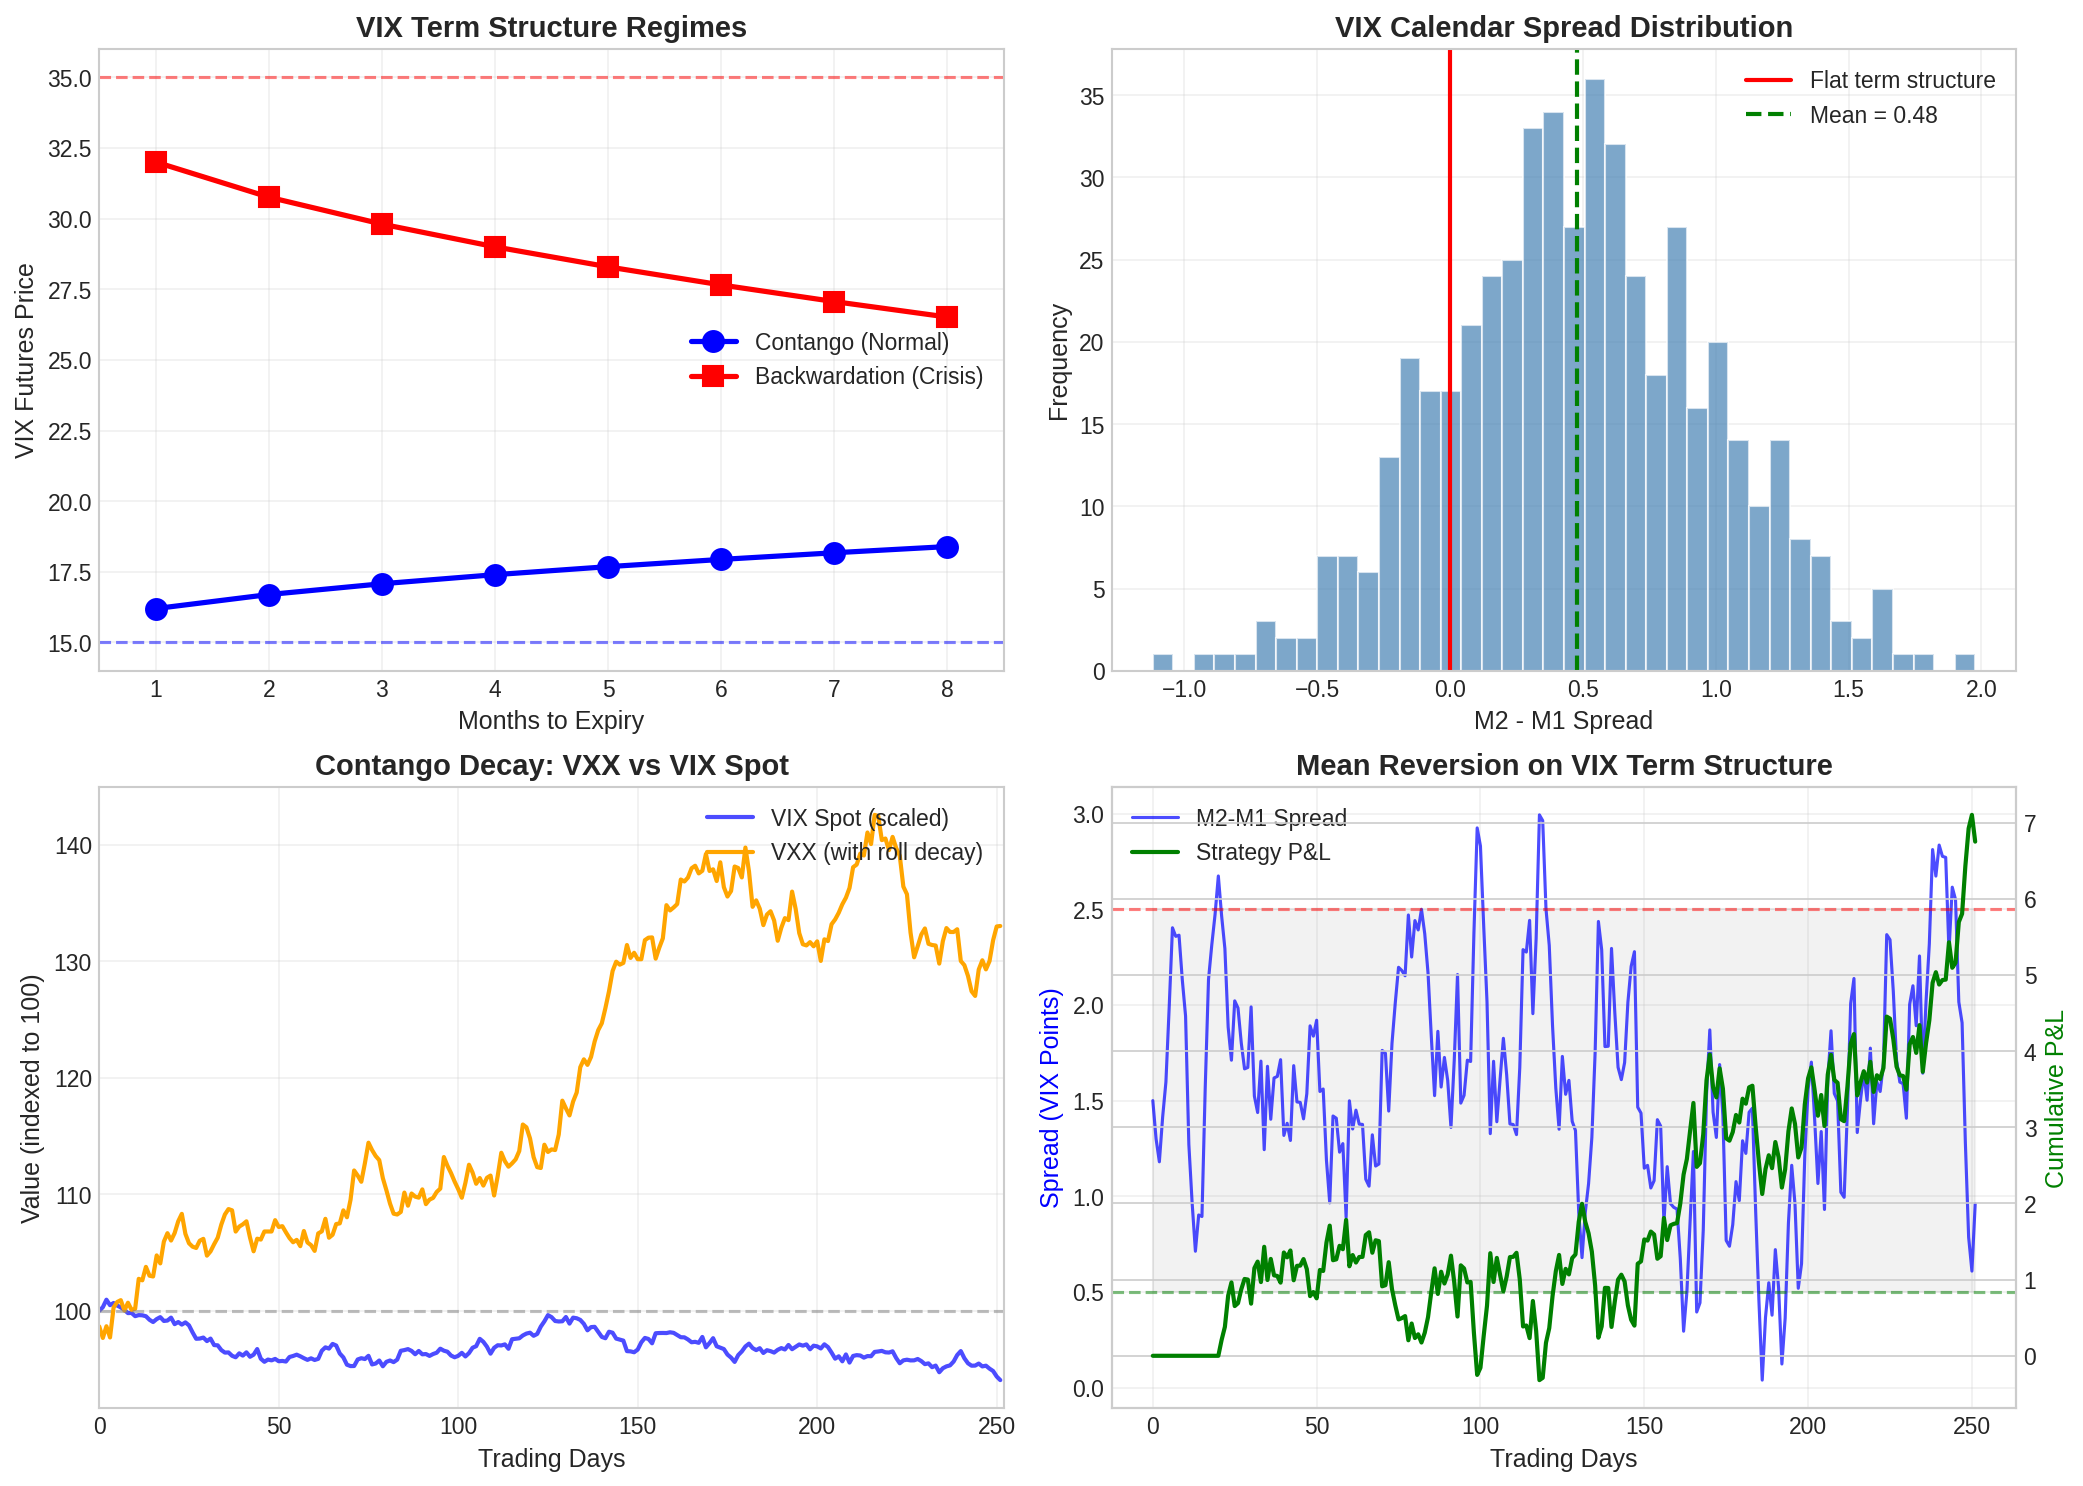
5.1 Contango and Backwardation
The VIX term structure describes the relationship between VIX futures prices across expirations:
Contango (Normal): Front month < Back month
  - Futures curve slopes upward
  - Market expects volatility to rise from current low levels
  - ~80% of the time historically

Backwardation (Crisis): Front month > Back month
  - Futures curve slopes downward (inverted)
  - Market expects current high volatility to subside
  - ~20% of the time, usually during market stress
5.2 Roll Yield
VIX ETPs like VXX hold constant-maturity VIX futures (~30 days). They achieve this by daily rolling:
Daily Roll Process:
  1. Sell some front-month futures
  2. Buy some second-month futures

In Contango:
  - Sell low (front), buy high (back)
  - Negative roll yield: ~7-10% annual decay

In Backwardation:
  - Sell high (front), buy low (back)
  - Positive roll yield
This is why VXX and similar products decay over time in normal markets—they’re constantly selling low and buying high.
5.3 Trading the Spread
The M2-M1 spread (second month minus front month) mean-reverts:
Mean spread: ~1.5 VIX points (in contango)
Standard deviation: ~1.5 points

Trading rules:
  - Spread > 2.5: Short spread (expect narrowing)
  - Spread < 0.5: Long spread (expect widening)
  - Spread inverts (< 0): Crisis mode, different rules apply
This is a form of volatility arbitrage — betting that the term structure will normalize.
6. Some Formula References
Long Straddle Breakevens
────────────────────────
BE_lower = Strike - Total Premium
BE_upper = Strike + Total Premium


Iron Condor Max Loss
────────────────────
Max Loss = Wing Width - Net Credit


Calendar Spread Vega
────────────────────
Net Vega = Vega_back - Vega_front
(Positive because back-month vega > front-month vega)


IV Rank
───────
IV Rank = (IV_current - IV_52w_low) / (IV_52w_high - IV_52w_low) × 100


VIX Roll Yield (approximate)
────────────────────────────
Annual Roll Yield ≈ (M2 - M1) / M1 × 12 × 100%
7. Coming Up
My next post was originally going to focus on The Greeks, but I got into a bit of a rabbit hole with trading the VIX spread.
So my next post will focus on that instead!
Stay tuned. Same bat time, same bat channel! 🦇
Remember: Alpha is never guaranteed. And the backtest is a liar until proven otherwise.
Options involve risk and are not suitable for all investors. The strategies discussed here can result in significant losses. My analyses probably contain mistakes — please let me know if you find any!
The material presented in Math & Markets is for informational purposes only. It does not constitute investment or financial advice.
The "Selection Matrix" (#4.2) is badly jumbled as displayed. Perhaps you can fix it.