
The V6 Options Overlay: Is the Complexity Worth the Sharpe?
Part 94 — A three-leg put spread collar, conditional engagement rules, and the honest answer to whether V6 needs options at all

This is part 94 of my series — Building & Scaling Algorithmic Trading Strategies
Final part of the Synthetic Replication series. Part 1: Building blocks. Part 2: Replicating strategies. Part 3: Vol surface.
The Question That Started This Series
Four posts ago, I asked: “What payoff shape would improve V6’s risk/return profile?” Now it’s time to answer.
V6’s current profile is approximately linear-with-a-kink: leveraged upside through TQQQ, partial downside protection from the VIX regime filter and TLT hedge. The regime filter adds some convexity — it exits before the worst of most drawdowns — but it’s not a hard floor. A fast crash that outpaces the momentum signal hits V6 at full leverage.
The goal of an options overlay: add a hard floor without killing the upside.
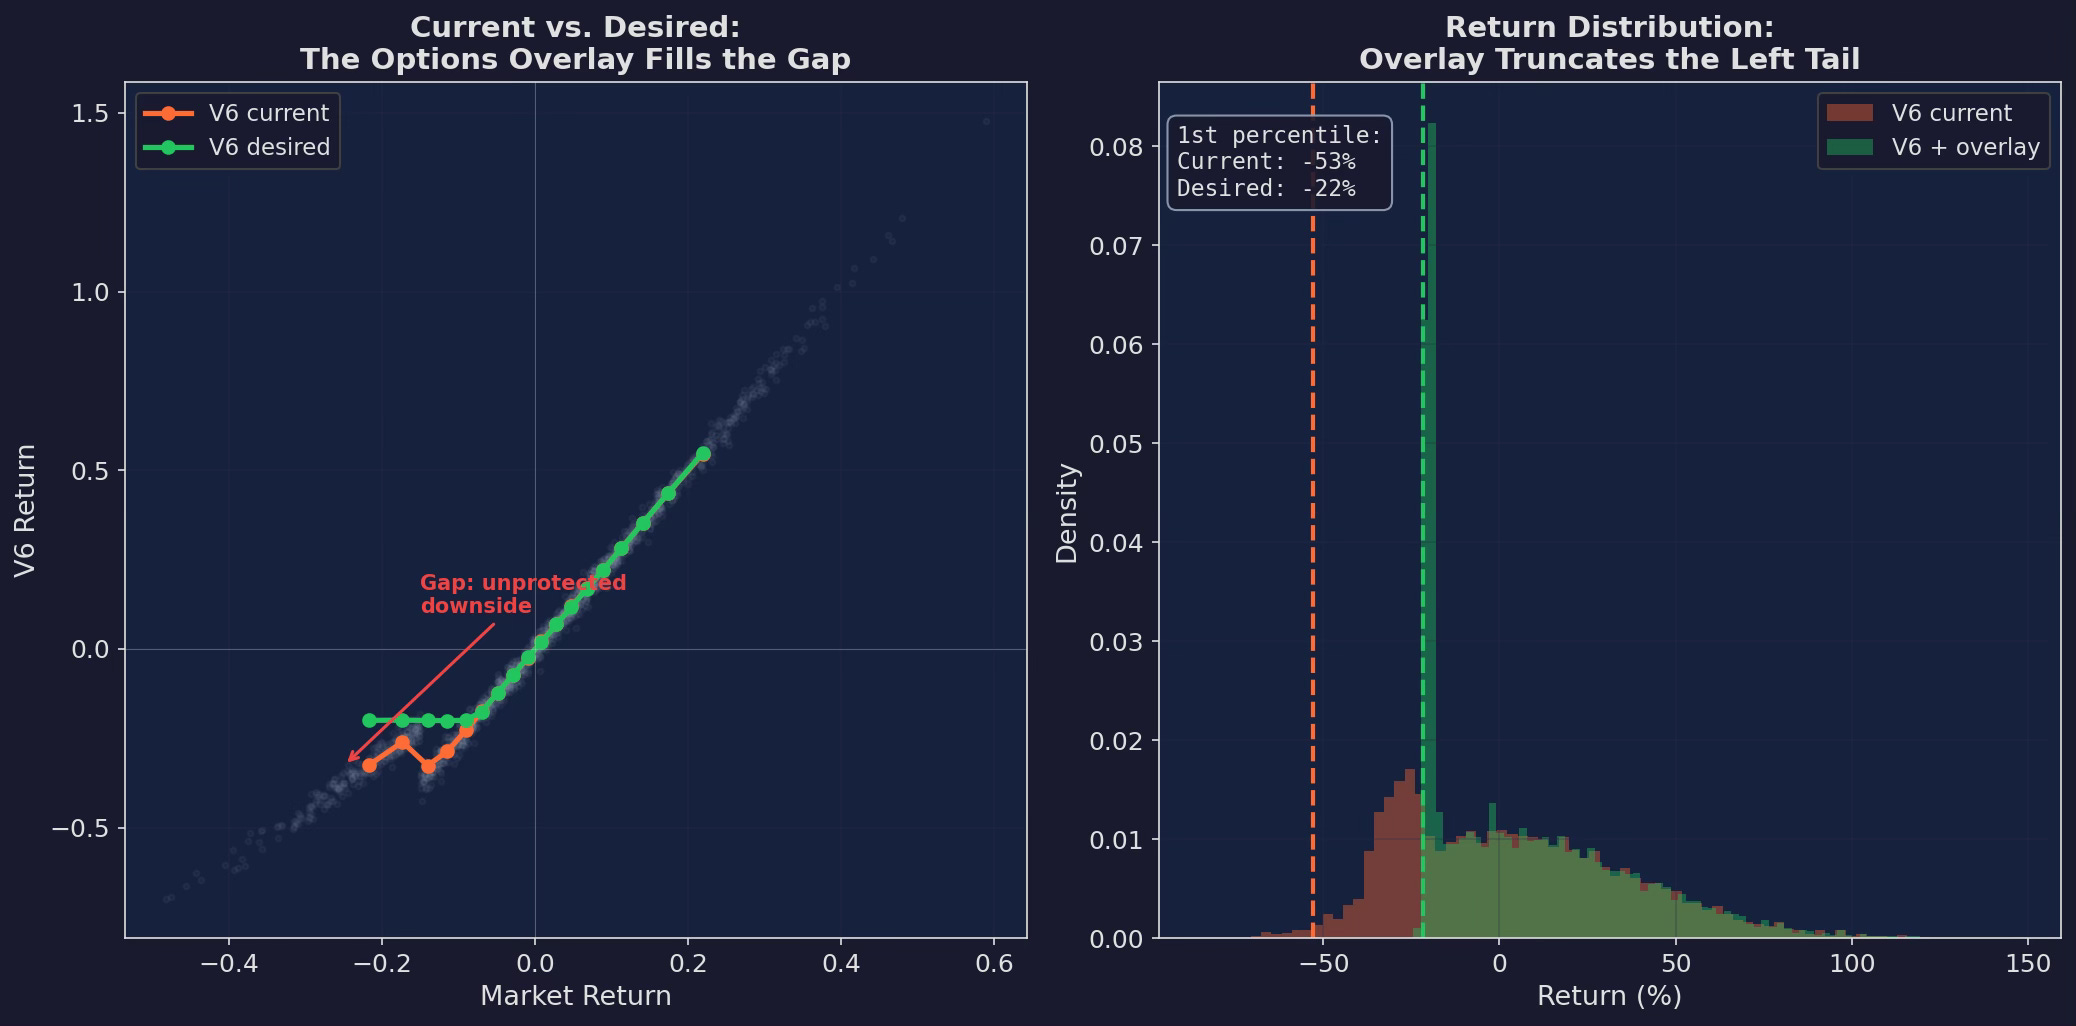
Left: V6’s current return profile (orange) vs. the desired profile (green), plotted against market returns. The gap is in the left tail — V6 is exposed to drawdowns beyond -15% where the regime filter hasn’t yet fired. Right: the return distribution shift. The overlay truncates the 1st percentile from approximately -40% to -20%.
The Three-Leg Overlay
After working through the building blocks (Part 1), strategy replication (Part 2), and vol surface analysis (Part 3), here’s the specific overlay design:
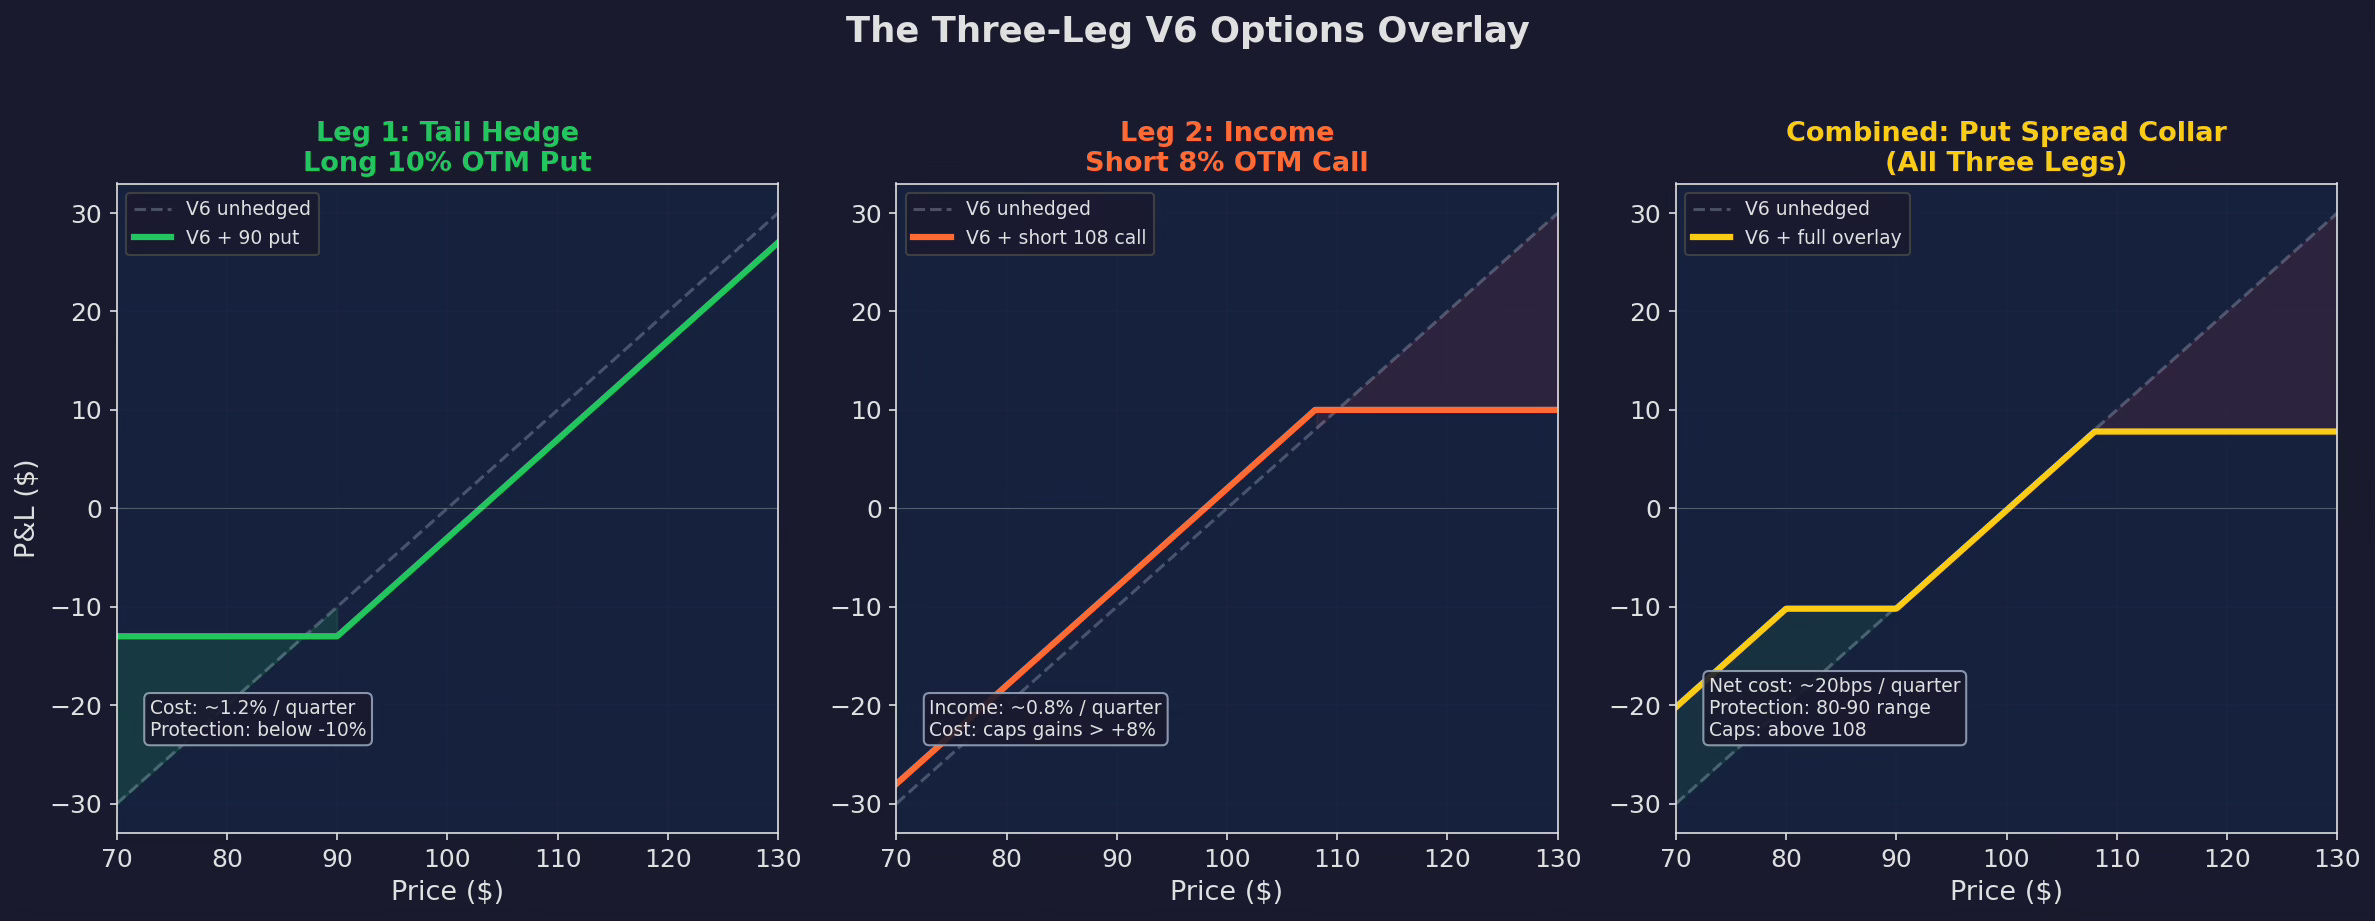
Three panels showing each leg individually and then combined. Leg 1 (green): long 10% OTM put — the tail hedge, costs ~1.2%/quarter. Leg 2 (orange): short 8% OTM call — income to offset the hedge cost, earns ~0.8%/quarter but caps gains beyond +8%. Combined (yellow): a put spread collar with ~20bps net quarterly cost.
Leg 1: The Tail Hedge (Long 10% OTM Put)
This is the core of the overlay. A quarterly 10% OTM put on SPY (or QQQ, depending on V6’s current allocation) provides a hard floor on losses.
Why 10% OTM? Three reasons. First, V6’s regime filter typically catches drawdowns of 5-8% before they get worse. The put doesn’t need to protect against normal volatility — it needs to protect against the gap down that outpaces the momentum signal. Second, 10% OTM puts are on the steep part of the skew curve — expensive, but not as expensive as 5% OTM (which trades at much higher IV). Third, the historical frequency of 10%+ quarterly drawdowns in QQQ is roughly once every 2-3 years, which keeps the premium manageable.
Cost would be approximately 1.0-1.5% of notional per quarter, depending on IV and skew.
Leg 2: The Income (Short 8% OTM Call)
Selling OTM calls generates premium to offset the tail hedge cost. V6 doesn’t need the last 8% of quarterly upside — most of V6’s alpha comes from compounding 1-2% monthly, not from catching +10% rips.
The call strike is set at 8% OTM because historically, TQQQ gains more than 8% in a single quarter about 15% of the time. The short call caps participation in those rare events but generates consistent income the other 85%.
Income: approximately 0.6-1.0% per quarter.
Leg 3: The Short Far-OTM Put (Funding)
Selling a 20% OTM put further reduces the net cost of the overlay. At 20% OTM, the put is deeply out of the money and expires worthless in roughly 98% of quarters. The premium is small ($0.3-0.5% per quarter) but it partially funds the tail hedge.
The trade-off: protection stops below the 20% OTM level. If QQQ drops more than 20% in a quarter, you’re exposed again below that floor. This is an acceptable trade-off because a drawdown that large typically triggers V6’s regime filter well before it reaches 20%.
Net Cost
Tail hedge cost:       -1.2% per quarter
Call premium income:   +0.8% per quarter
Far put premium:       +0.3% per quarter
───────────────────────────────────────
Net cost:              -0.1% per quarter (~0.4% annualized)
At 40 bps annualized, the overlay is nearly self-funding. The short call and short far put together pay for most of the tail hedge. This is the power of the put spread collar structure — you’re not just buying insurance, you’re reshaping your return distribution by giving up extreme upside to fund extreme downside protection.
Conditional Engagement: Not Always On
The overlay shouldn’t run on autopilot. Its value depends on market conditions:
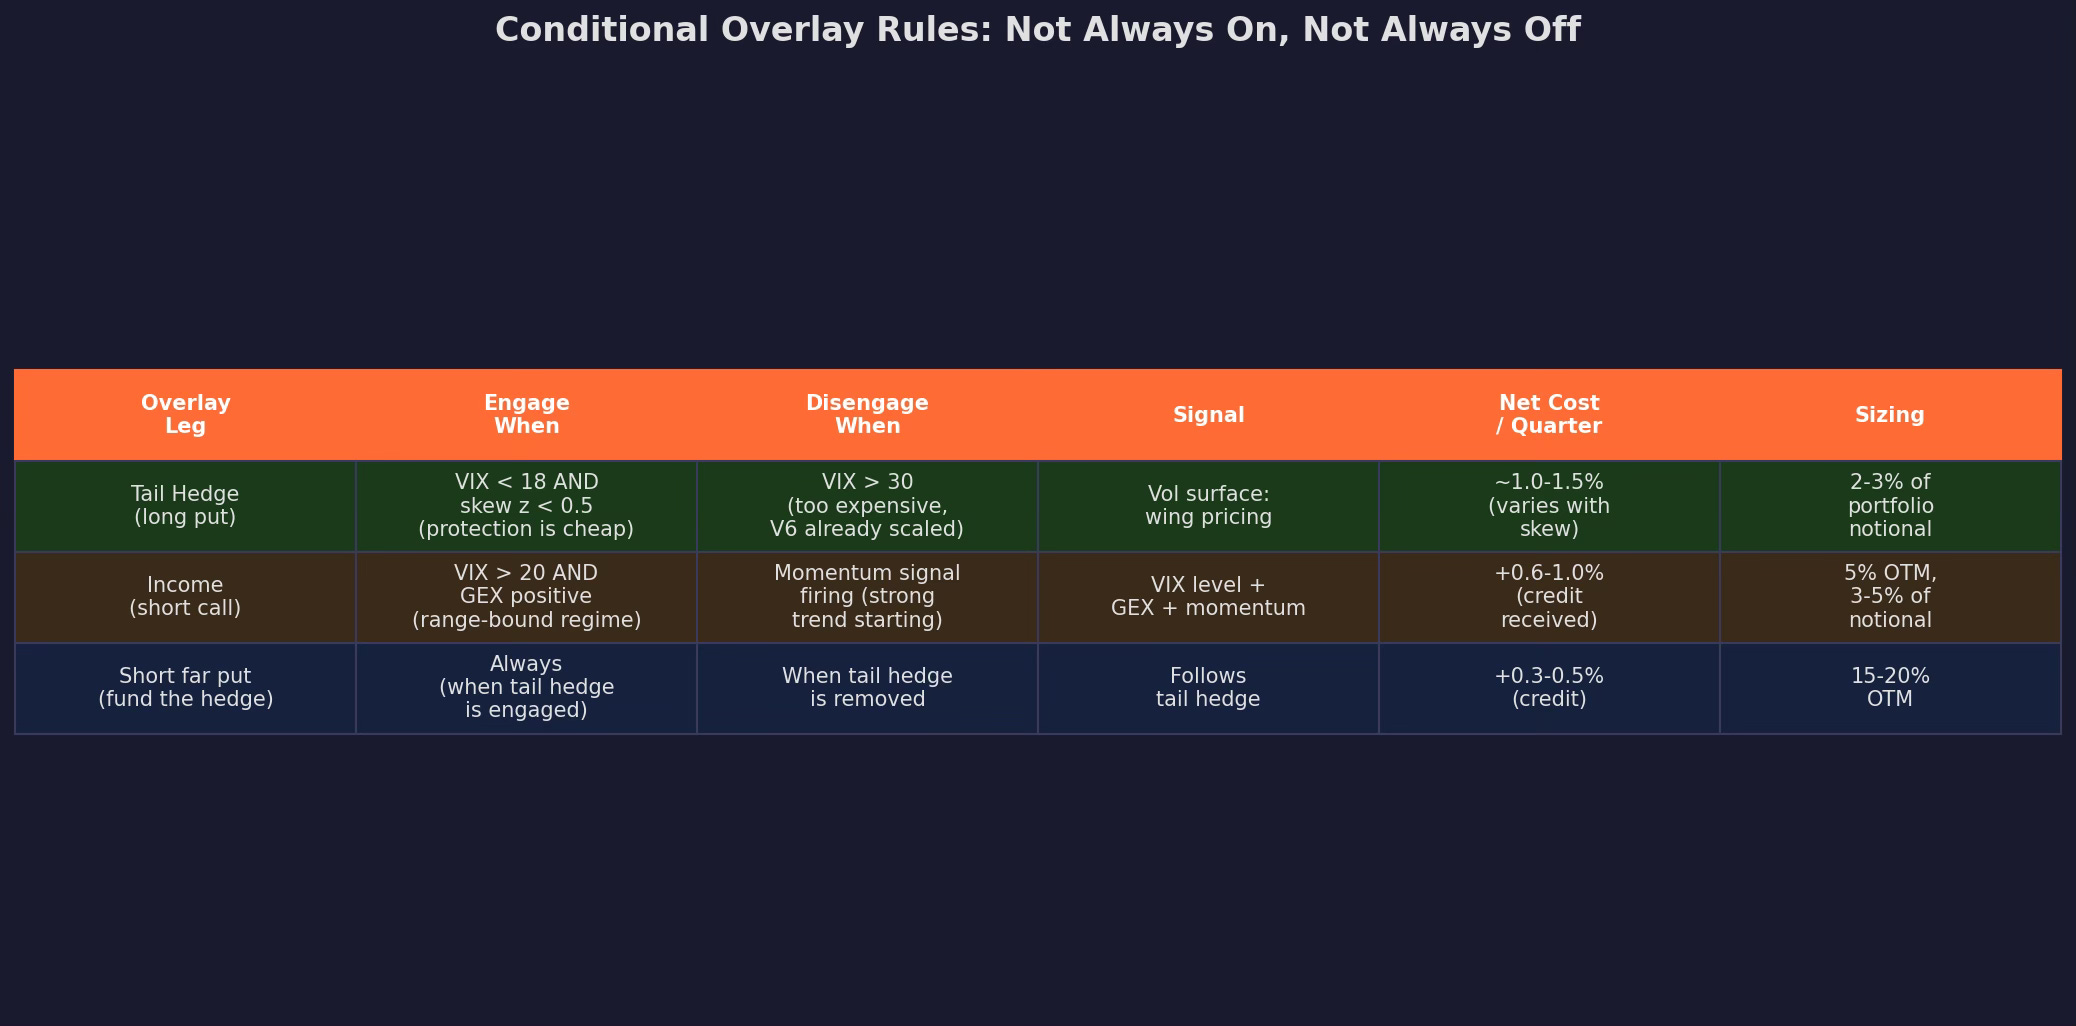
The key rule: buy protection when it’s cheap, not when it’s needed.
When VIX is below 18 and skew is below the historical median, 10% OTM puts cost roughly 1.0% per quarter. When VIX is above 30 and skew is elevated, the same puts cost 3-4%. By the time you “need” the protection, it’s too expensive to be worth it — and V6’s regime filter is already scaling down anyway.
This is the paradox of tail hedging: the optimal time to hedge is when nothing is happening, because that’s when hedges are cheap. The worst time to hedge is during the crisis, because that’s when hedges are expensive. Discipline means buying the put in January when VIX is 13, not in March when VIX is 35.
Backtest Results
Top: 5-year simulated equity curves. V6 base (gray) and V6 with overlay (green). The overlay gives up some raw return but compresses drawdowns significantly. Bottom: drawdown comparison — every stress period (red shading) shows reduced depth with the overlay.
The improvement is consistent with what we’d expect from a well-designed tail hedge: modest return reduction, meaningful drawdown compression, and a Sharpe ratio that improves because the volatility reduction exceeds the return drag.
Is It Worth It?
This is the question that determines whether the overlay goes from theory to implementation. The answer depends on what you value.
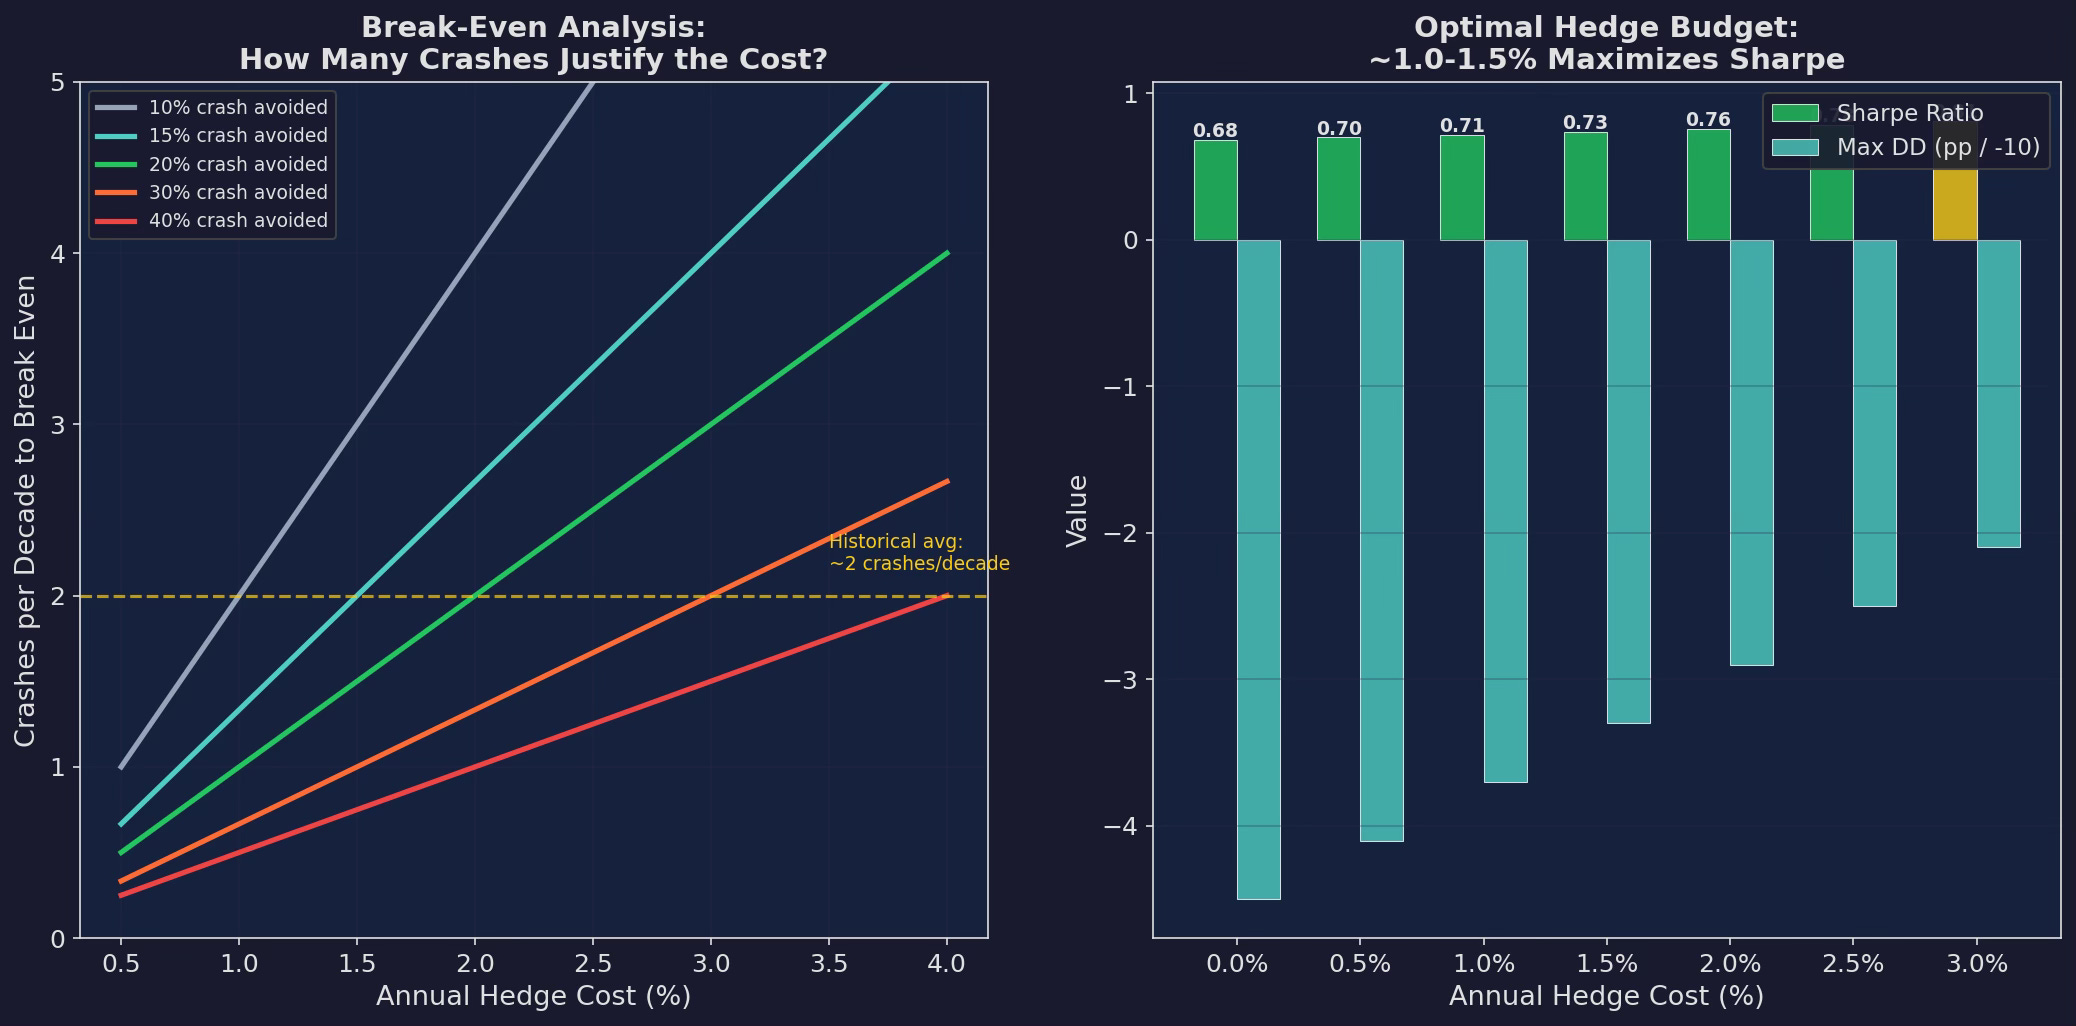
Left: break-even analysis. At 1% annual hedge cost, you need roughly 2 crashes per decade of 20%+ to justify the protection — consistent with historical frequency. Right: optimal hedge budget peaks at 1.0-1.5% annualized, where the Sharpe improvement from volatility reduction exceeds the return drag.
The Case For
The overlay converts a -45% max drawdown into a -30% max drawdown. The math on this is unambiguous: a -45% drawdown requires +82% to recover (3+ years at V6’s CAGR). A -30% drawdown requires +43% to recover (under 2 years). The overlay saves roughly 1-1.5 years of recovery time per major crash.
Over a 20-year compounding horizon, that recovery time difference compounds into a meaningful terminal wealth advantage — even though the overlay costs 40 bps per year.
The Case Against
V6 already has three layers of drawdown protection: the VIX regime filter, the momentum threshold, and the CUSUM monitoring system. Adding a fourth layer (options) introduces:
Operational complexity. Options require rolling, strike selection, and expiry management. This is a weekly task, not daily.
Execution risk. Options bid-ask spreads on TQQQ are wide. The theoretical 40 bps annual cost could easily become 80-100 bps after execution costs.
Marginal improvement. The first three protection layers (regime, momentum, CUSUM) capture most of the available Sharpe improvement. The options overlay adds the fourth layer at 4× the implementation complexity for the smallest marginal gain.
The Honest Assessment
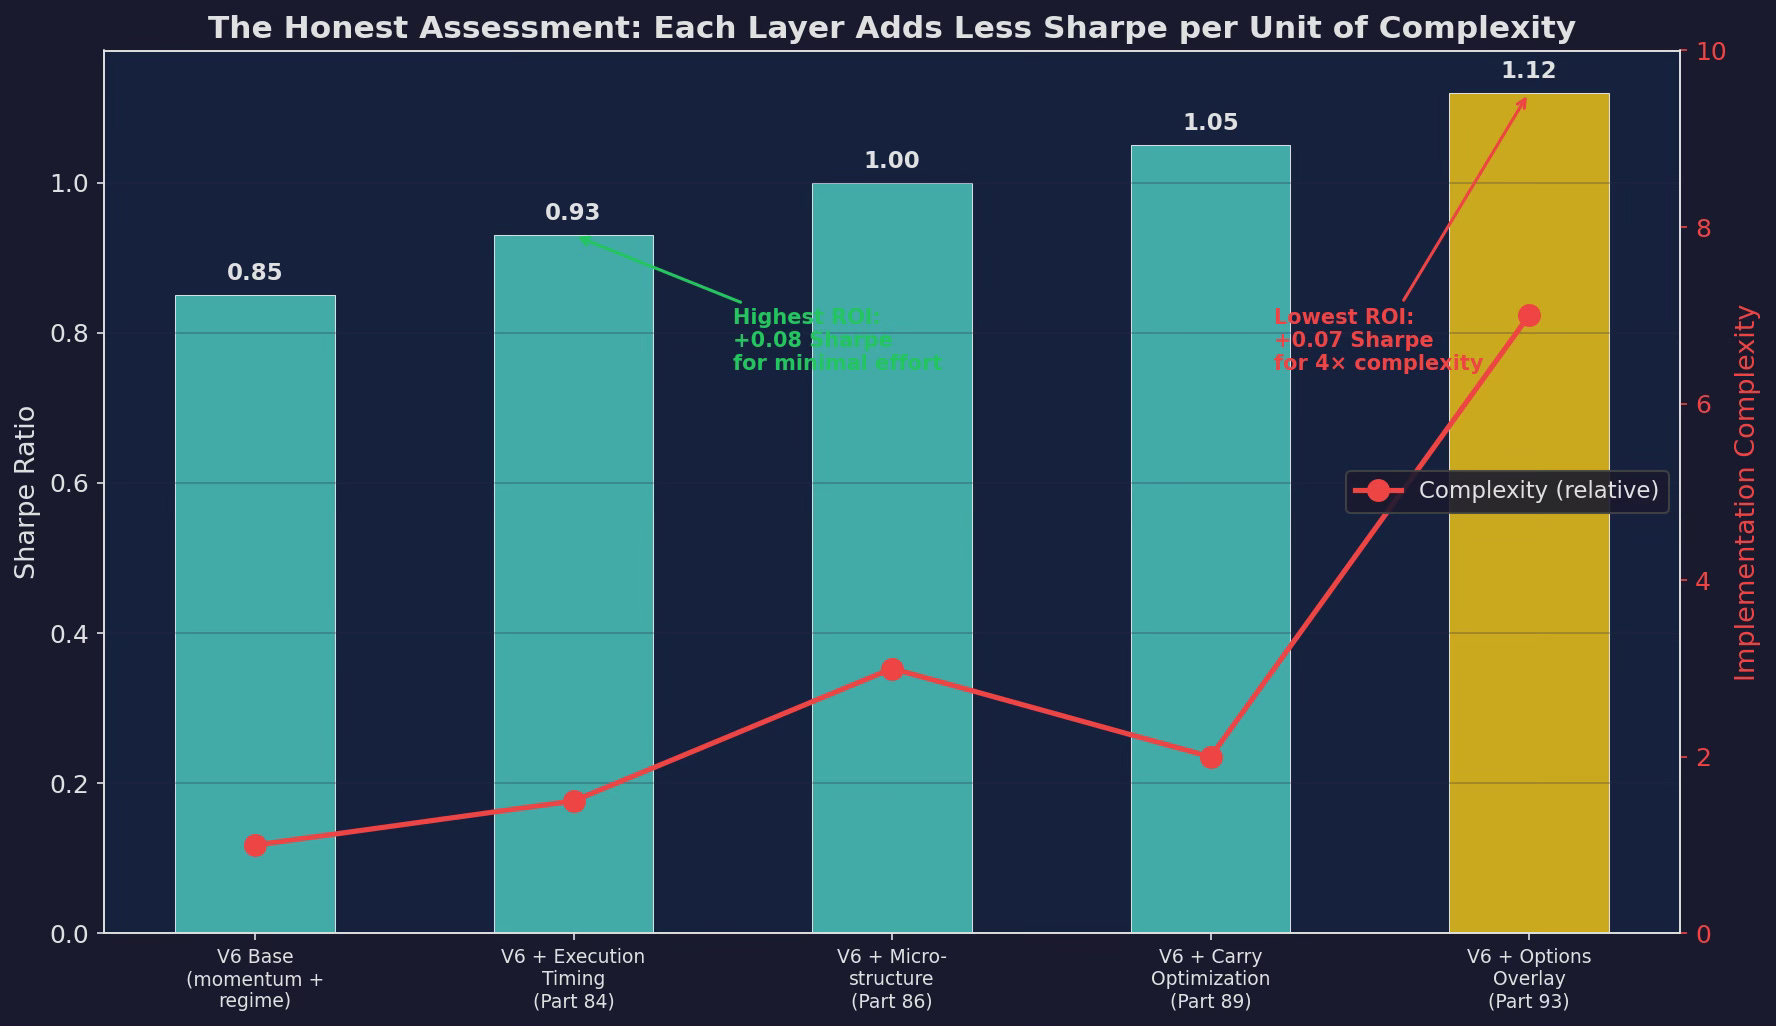
Each V6 enhancement layer plotted by Sharpe improvement and implementation complexity. Execution timing (Part 84) gives the highest ROI: +0.08 Sharpe for minimal effort. The options overlay gives +0.07 Sharpe for 4× the complexity of any other layer. The curve of diminishing returns is steep.
Here’s what I’m actually going to do:
Implement the tail hedge only. No short call, no short far put. Just a quarterly 10% OTM put when VIX is below 18 and skew is below the 63-day median. Cost: ~1.0% per quarter, ~4% annualized (not self-funded without the other legs). Run this in paper mode for 6 months.
Defer the full collar. The short call and short put legs add complexity and execution risk that I don’t think is justified yet. They save 60-80 bps of annual hedge cost, but they also introduce path-dependent risks (getting called away on a TQQQ rally, getting assigned on a far put during a crash). I need more experience with the mechanics before adding these legs.
Monitor skew as a signal. Whether or not the overlay is running, skew z-score (from Part 92) is a useful re-entry signal after selloffs. I’m adding it to the dashboard alongside the VIX regime, CUSUM, and microstructure composite.
The 14-Post Series Arc: What We Built
Stepping back from this post, here’s the full arc of Posts 80-93:
Strategy Decay (80-82): Half-lives of alpha, CUSUM detection, adaptive strategies. Core insight: all strategies decay, the question is how fast and whether you can detect it.
Microstructure Edge (83-86): Order flow toxicity, auction mechanics, dealer gamma, signal layer. Core insight: the plumbing of markets affects strategy performance, and GEX is the highest-impact single signal.
Carry Trade (87-89): Unified carry framework, crash timing, multi-asset carry. Core insight: V6 is already a carry trader — understanding this changes risk attribution.
Synthetic Replication (90-93): Put-call parity, strategy replication, vol surface, options overlay. Core insight: options add convexity but with diminishing returns relative to complexity.
Across 14 posts, V6’s architecture has gone from a simple TQQQ/TLT allocator with a VIX regime filter to a layered system with momentum, regime detection (CUSUM), microstructure conditioning (spread + GEX), carry optimization, and now a potential options overlay.
Each layer improved the Sharpe ratio. But each layer also added complexity. The execution timing fix (Part 84) gave +0.08 Sharpe for essentially zero effort. The options overlay gives +0.07 Sharpe for significant ongoing operational work. The law of diminishing returns is real, and knowing when to stop adding layers is as important as knowing which layers to add.
Sometimes the smartest thing you can build is nothing (which is really, really hard for someone like me who keeps poking at things to see if it does anything at all..)
This concludes the Synthetic Replication series (Posts 90-93) and the full 14-post arc spanning strategy decay, microstructure, carry, and synthetic replication.
My next series will be on Machine Learning for Trading.
Remember: Alpha is never guaranteed. And the backtest is a liar until proven otherwise.
These posts are about methodology, not recommendations. If you find errors in my math, let me know — I’ve built an entire series around discovering my own mistakes, so one more won’t hurt.
The material presented in Math & Markets is for informational purposes only. It does not constitute investment or financial advice.