
The Options Tail Wagging the Stock Market Dog: How Dealer Gamma Exposure Moves Prices
Part 85 — GEX, the delta-hedging feedback loop, the gamma flip, and why options market makers are quietly setting your support and resistance levels

This is part 85 of my series — Building & Scaling Algorithmic Trading Strategies
Part 3 of the Microstructure Edge series. Part 1: Order flow toxicity. Part 2: Auction mechanics of open and close.
The Equity & Options Market Myth
Here’s the uncomfortable reality about modern equity markets: options market makers — not fundamental investors, not momentum traders, not retail — are often the largest marginal buyers and sellers of stock on any given day.
They don’t want to be but they’re forced to be — by math.
When you buy a call option, the market maker on the other side sells it to you. That creates directional exposure the dealer doesn’t want. To neutralize it, they buy shares of the underlying stock. When the stock moves, their hedge is wrong, so they must adjust — buying more shares if the stock rises (for a short call), selling if it falls.
This forced, mechanical hedging flow is large enough to move prices. And it creates a feedback loop that either suppresses or amplifies volatility depending on the sign of the dealers’ aggregate gamma exposure.
The Feedback Loop
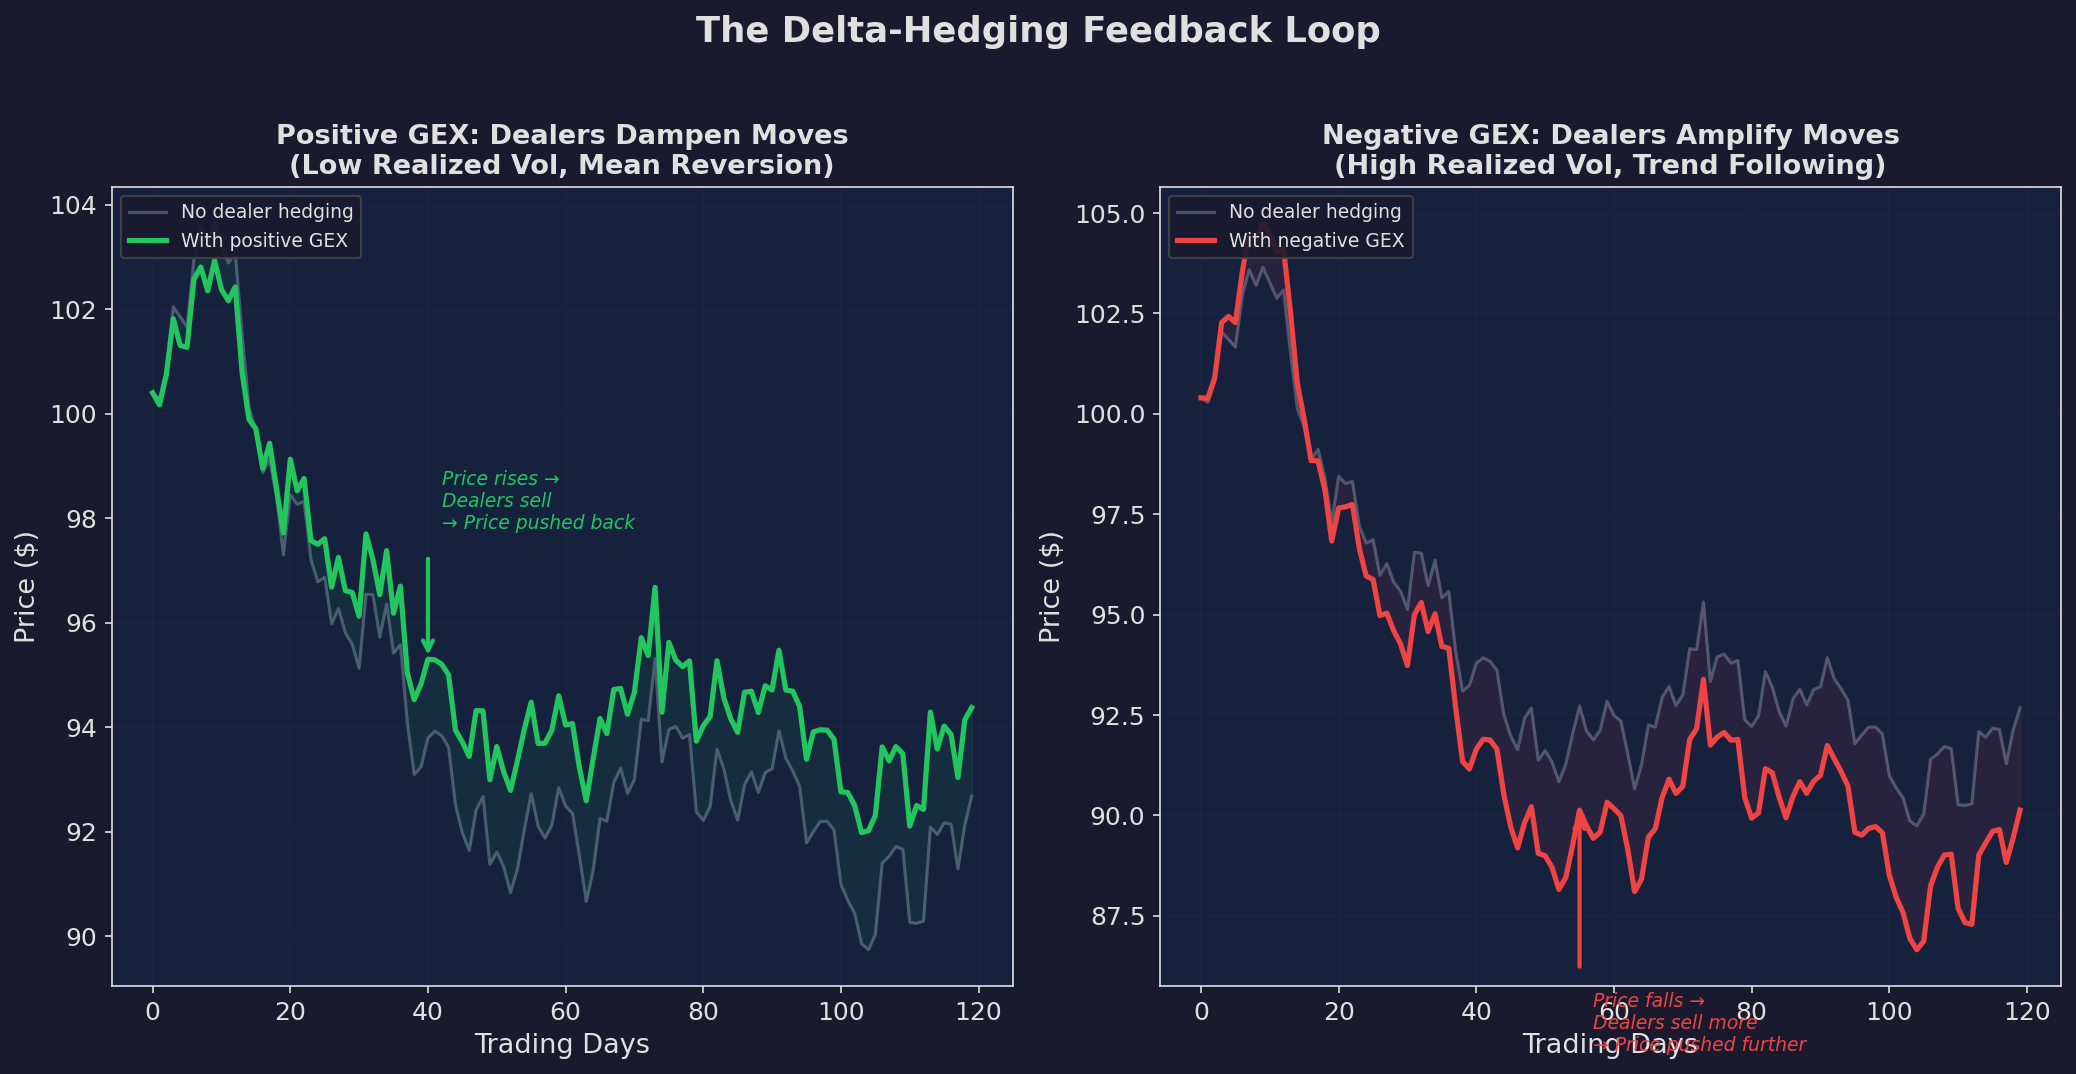
Left: when aggregate dealer gamma is positive, hedging dampens price moves. The stock ticks up → dealers sell to rehedge → selling pressure pushes price back. The result: lower realized volatility, mean reversion, and prices pinned near high-gamma strikes. Right: when gamma is negative, hedging amplifies moves. The stock drops → dealers sell to rehedge → selling pressure pushes price further down. The result: higher realized volatility, momentum, and gap-prone markets.
This isn’t theoretical hand-waving — in fact, the mechanism is mechanical:
Dealer sells you a call option at strike K
  → Dealer is short Γ contracts of gamma
  → When stock rises $1, dealer's delta changes by Γ
  → Dealer must buy Γ shares to stay hedged
  → This buying pushes the stock up slightly more
  → Which changes delta again... (feedback loop)
When dealers are long gamma (positive GEX), the loop is stabilizing — they buy dips and sell rips. When they’re short gamma (negative GEX), the loop is destabilizing — they sell into declines and buy into rallies, amplifying both.
Greeks Refresher: Why Gamma Matters
If you need a refresher on option Greeks, here’s the 60-second version:
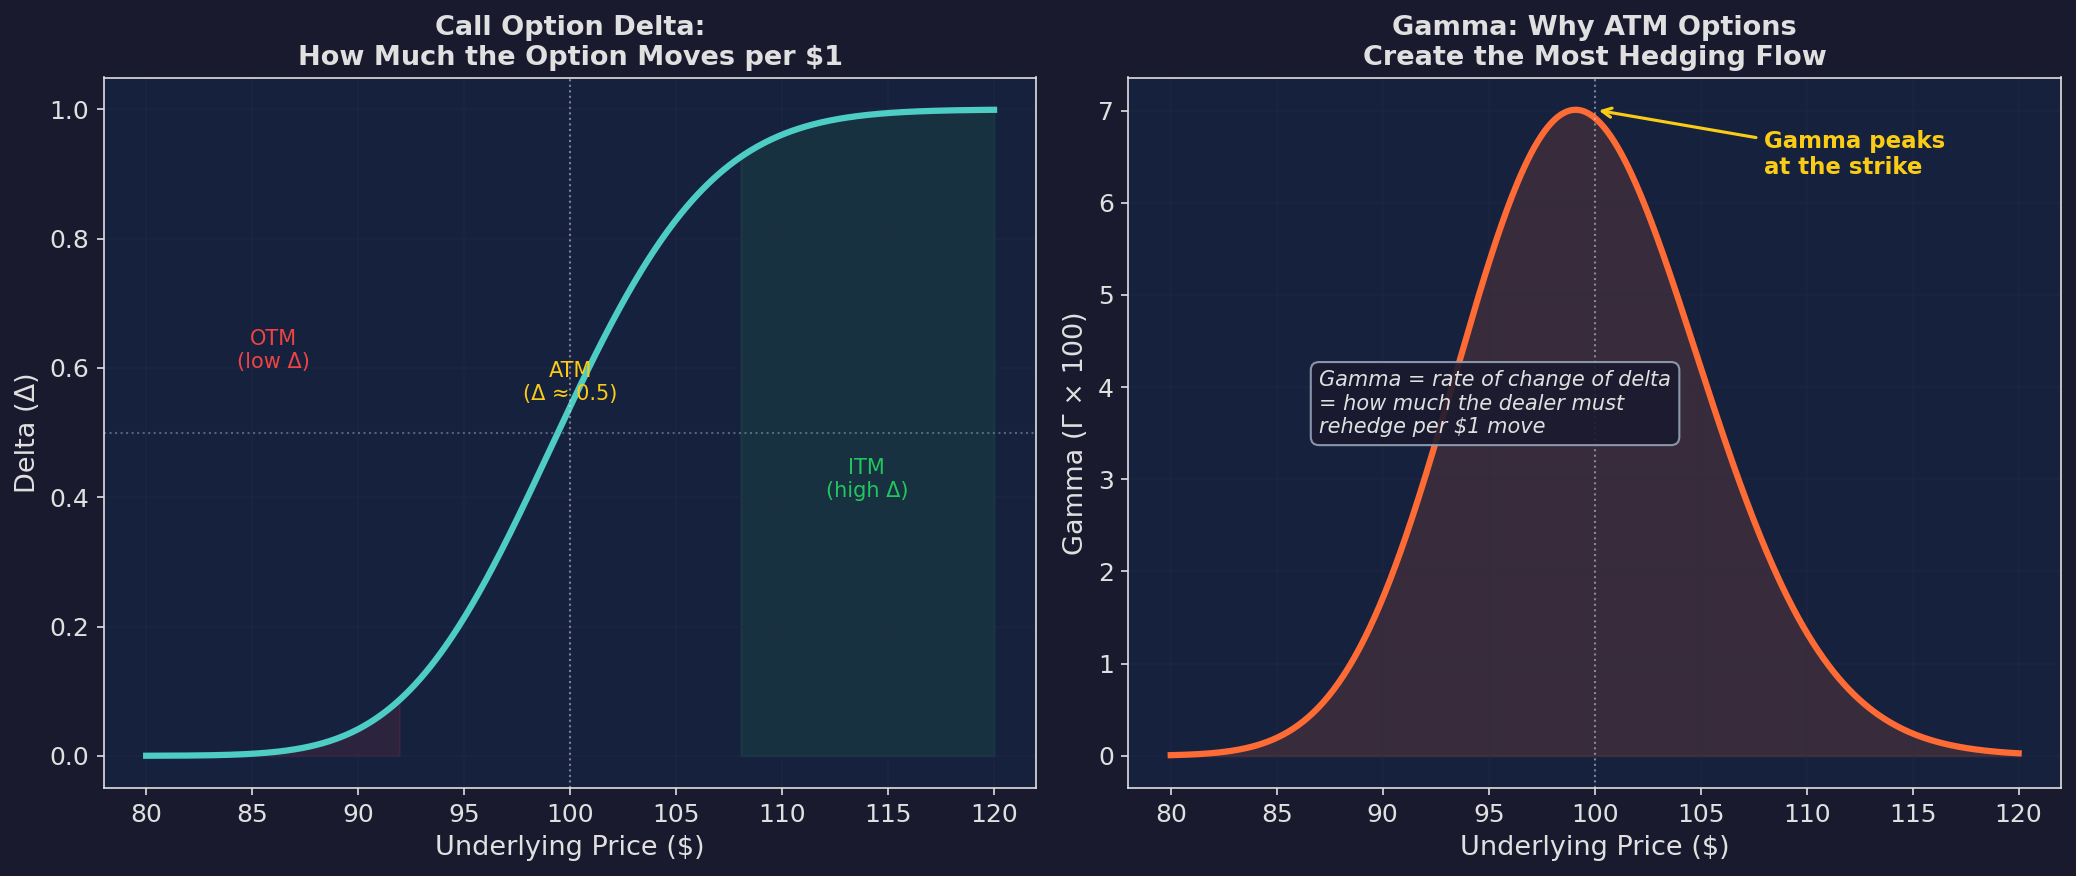
Left: delta measures how much the option price moves per $1 of underlying movement. It ranges from 0 (far OTM) to 1 (deep ITM), with ATM options at roughly 0.5. Right: gamma is the rate of change of delta — it measures how much hedging adjustment is needed per $1 move. Gamma peaks at the strike price and falls off on both sides.
The key insight: gamma is highest for at-the-money options near expiration. A 0DTE SPX option with the strike right at the current price has enormous gamma — its delta changes massively with every tick. The dealer hedging against it generates correspondingly massive stock flow.
This is why the 0DTE boom matters for market structure. In 2018, 0DTE options were a rounding error. By 2024 they represented over 50% of SPX options volume. That’s a massive increase in near-expiry, high-gamma options — and therefore a massive increase in the mechanical hedging flow that suppresses or amplifies stock movements.
GEX: Gamma Exposure Across Strikes
GEX aggregates gamma across all open option positions to estimate the net gamma exposure of dealers at each strike price:
GEX(K) = Γ(K) × OI_calls(K) × 100 × S × 0.01
        - Γ(K) × OI_puts(K)  × 100 × S × 0.01
Where Γ(K) is gamma at strike K, OI is open interest, S is the spot price, and the sign convention assumes dealers are short options (long for market participants, short for dealers).
The sign tells you the hedging direction:
GEX(K) > 0: Dealers are long gamma at this strike
  → They'll buy dips and sell rips near K
  → Price tends to pin toward K

GEX(K) < 0: Dealers are short gamma at this strike
  → They'll sell into declines near K
  → Price accelerates through K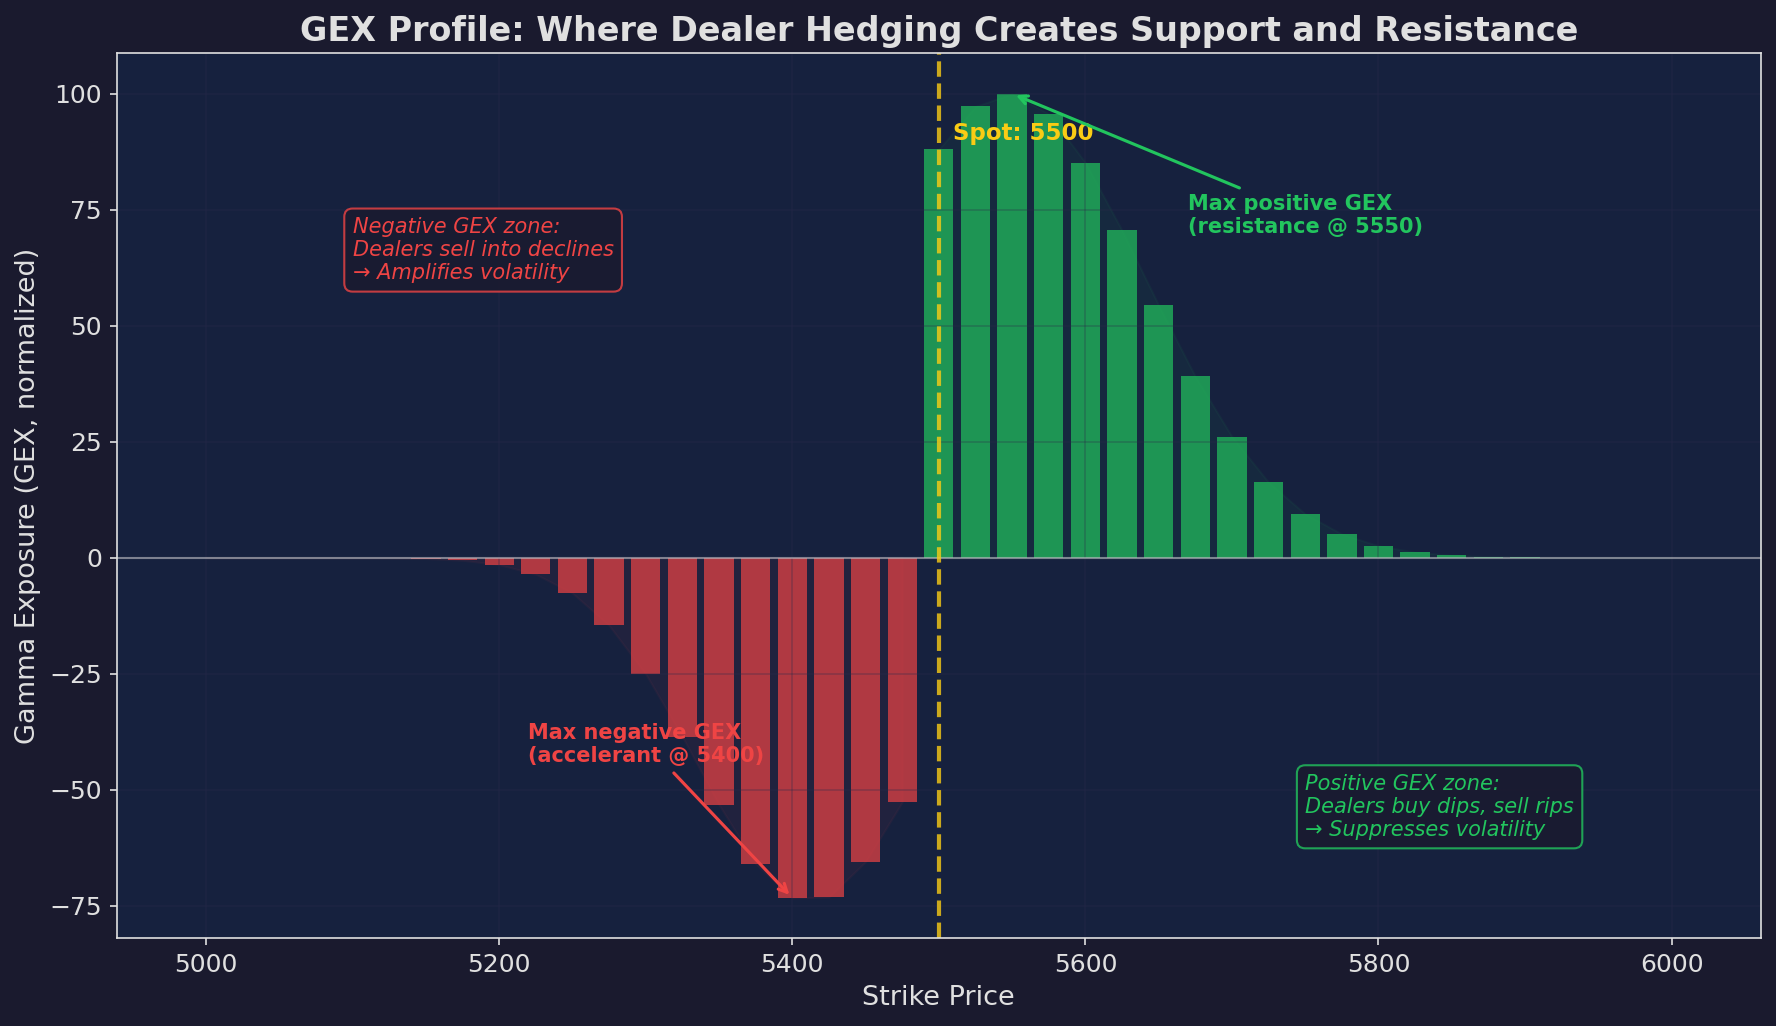
A simulated GEX profile for SPX at 5500. Green bars above zero: positive GEX strikes where dealer hedging creates resistance (dampens upward moves) and support (dampens downward moves). Red bars below zero: negative GEX strikes where hedging accelerates price through these levels. The max positive GEX strike at 5550 acts as a magnet; the max negative GEX strike at 5400 acts as an accelerant.
Reading the GEX Profile
Three things to look for:
1. The gamma flip level. The price where aggregate GEX crosses from positive to negative. Above this level, dealers dampen moves. Below it, they amplify. Think of it as the market’s “stability boundary.”
2. High positive GEX strikes. These act as magnets — price tends to pin toward them, especially near expiration. Options traders call this “max pain” or “pinning.”
3. High negative GEX strikes. These act as accelerants — if price reaches them, dealer hedging pushes it further in the same direction, creating cascading moves.
GEX Predicts Volatility
The empirical relationship is strong: higher GEX correlates with lower realized volatility.
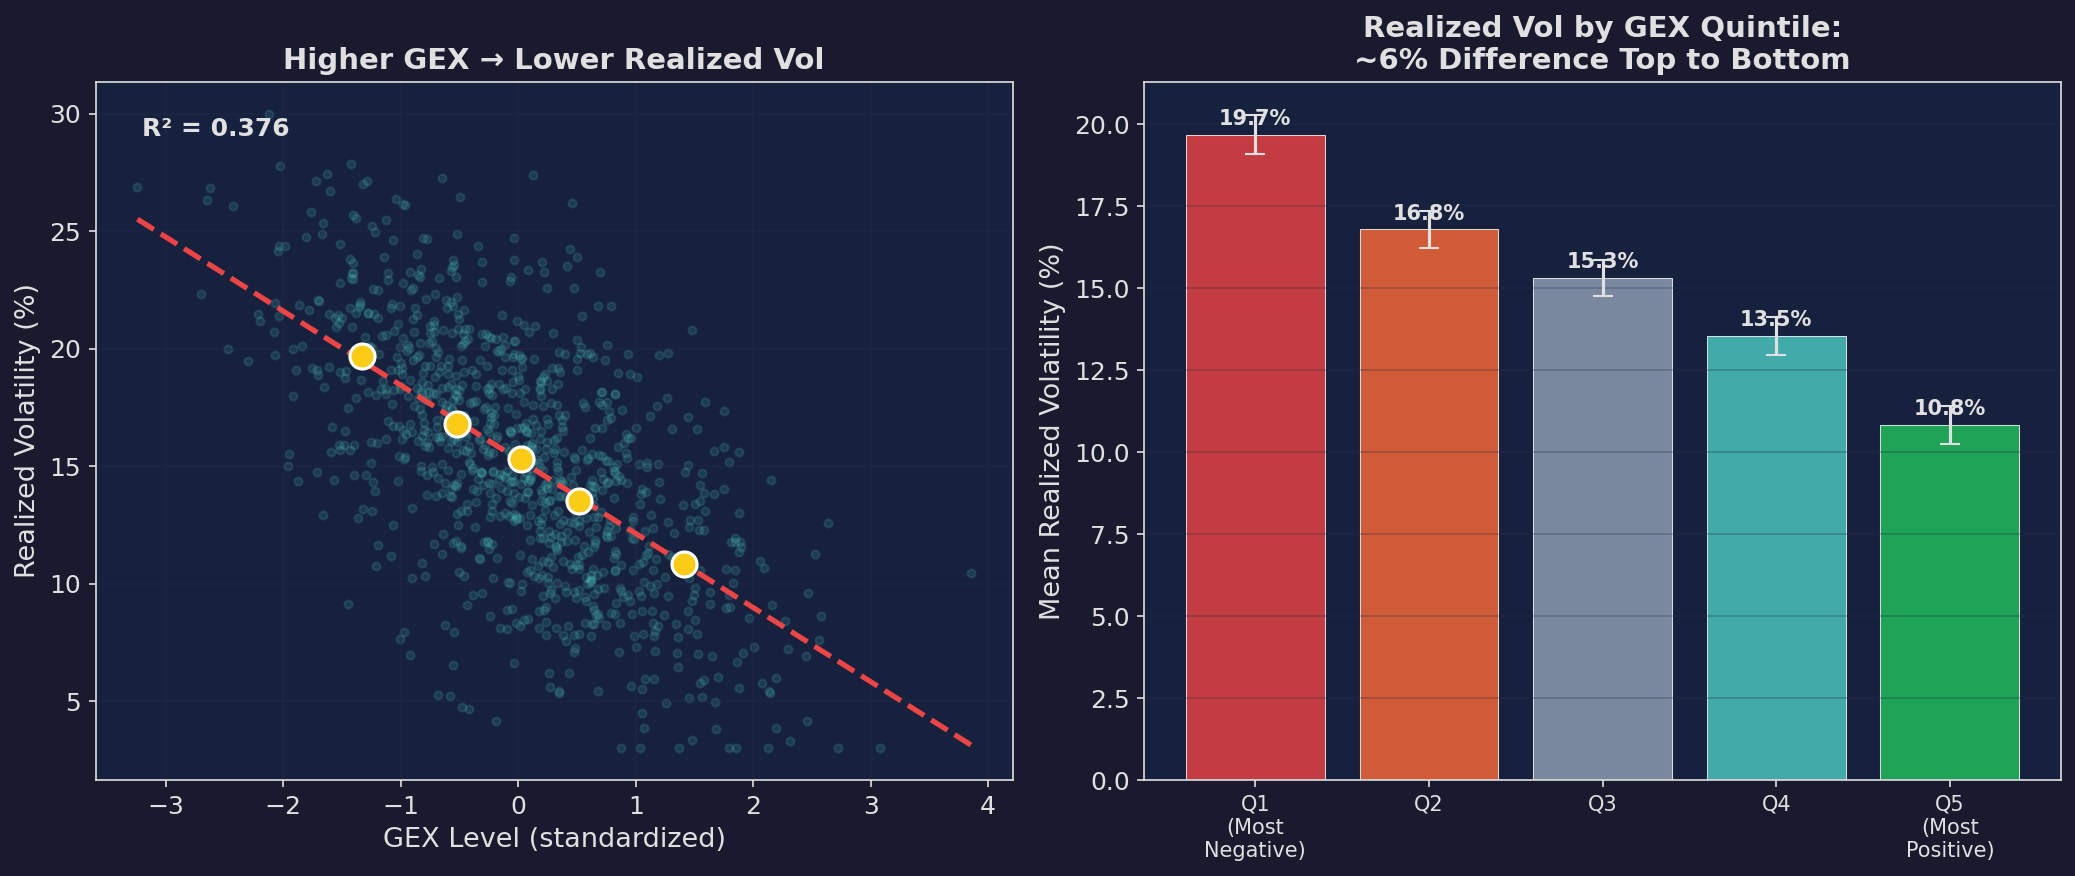
Left: scatter plot of standardized GEX vs. realized volatility with quintile means and a regression line. The relationship is clearly negative. Right: bar chart showing ~6 percentage points of difference in realized vol between the most negative and most positive GEX quintiles.
Luo and Zhang (2024) formalize this in their study of 0DTE options: they find that dealer delta-hedging of short-dated options contributes to intraday mean reversion and compressed realized vol. When 0DTE volume is high and GEX is positive, the market becomes “pinned” — large moves are mechanically bought or sold back toward the high-gamma strike.
The practical takeaway: GEX is a volatility regime indicator. High positive GEX = low vol, mean-reverting market. Negative GEX = high vol, trending/gapping market. This is directly useful for a strategy like V6 that needs to choose between momentum and mean-reversion positioning.
The Gamma Flip
The most important single number in the GEX framework is the gamma flip level — the price where aggregate dealer gamma goes from positive to negative.
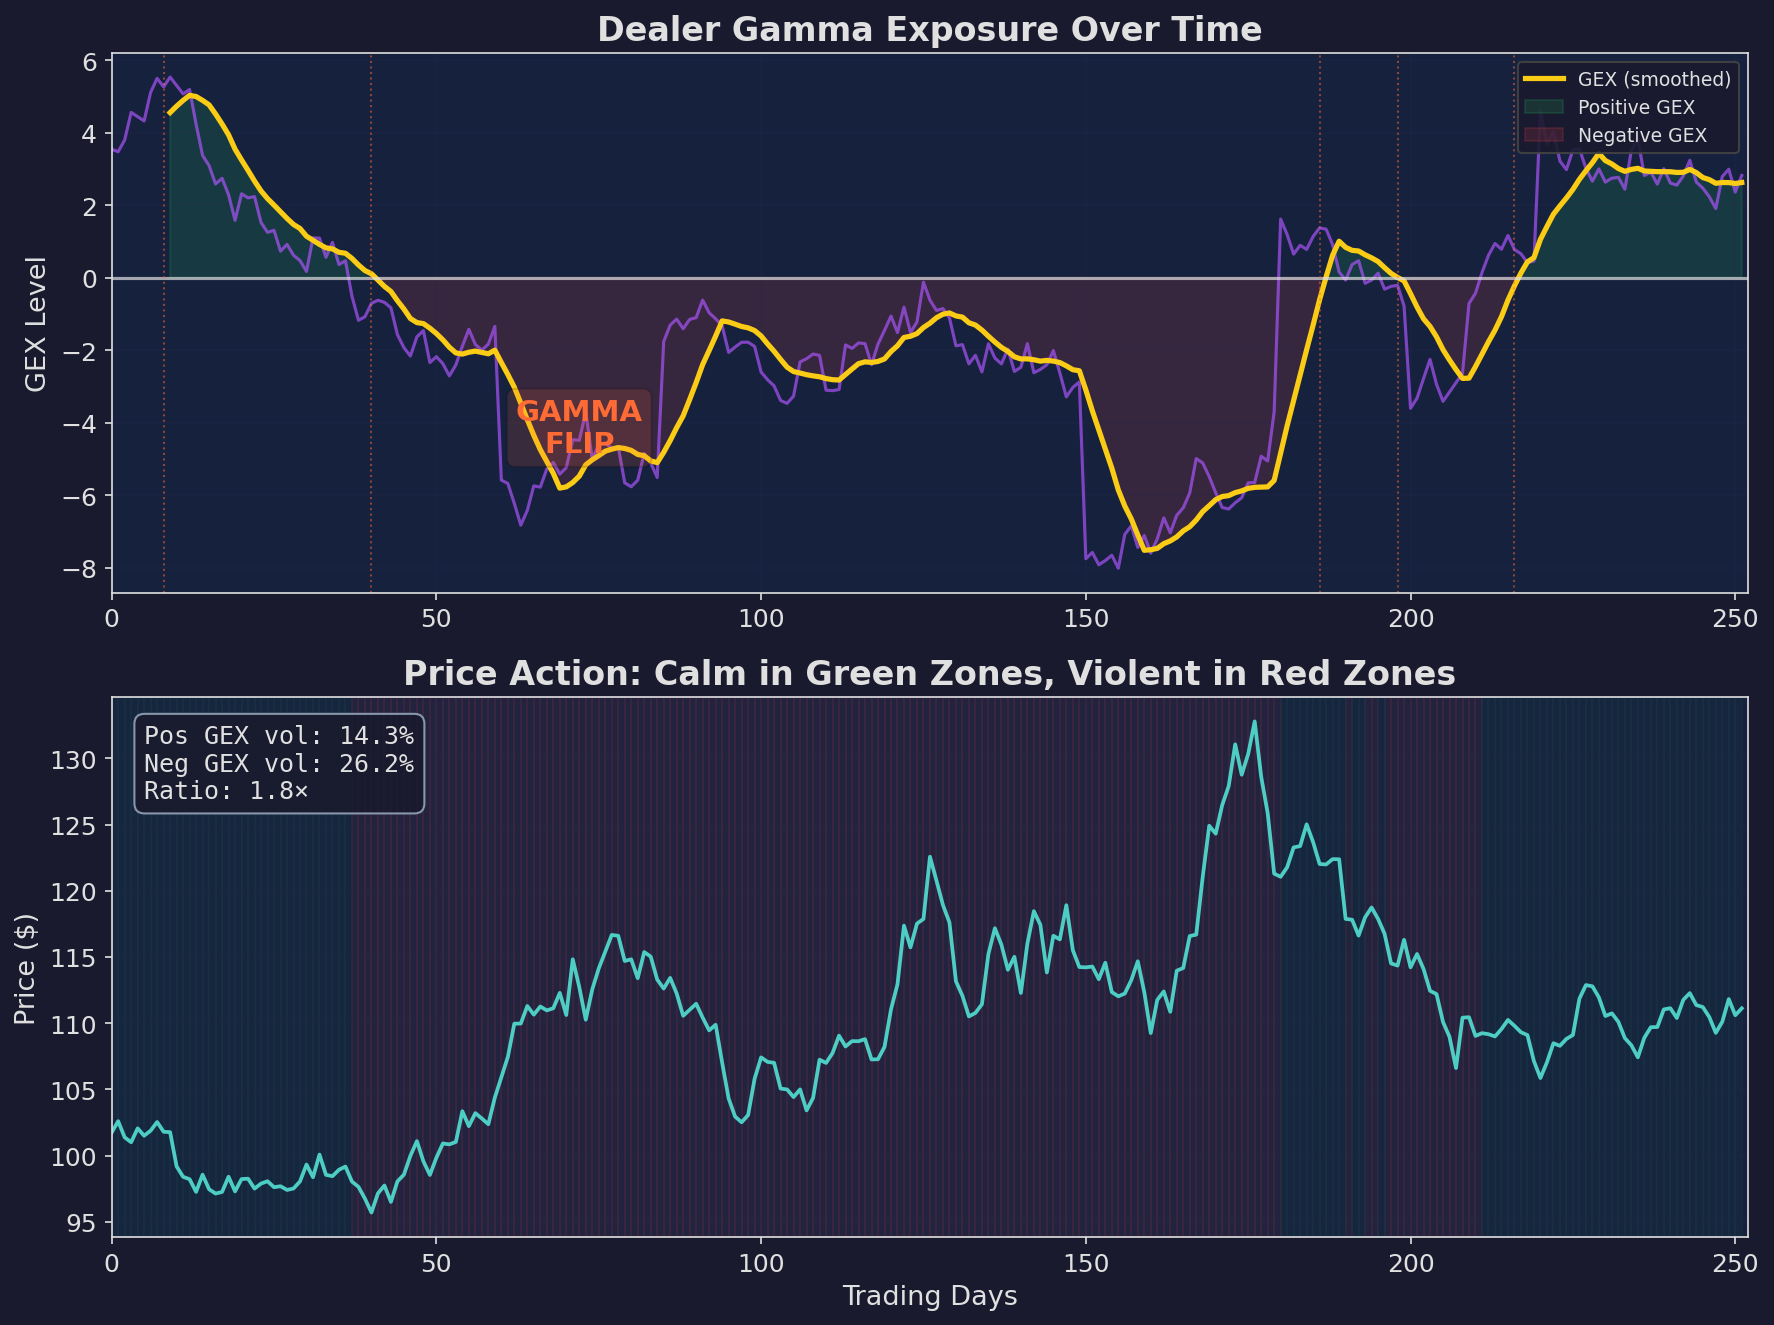
Top: dealer GEX over time. Green shading = positive gamma (dealers dampen moves). Red shading = negative gamma (dealers amplify moves). Orange vertical lines mark gamma flips. Bottom: the price path. In green zones, the price action is calm with low volatility. In red zones, volatility explodes — drawdowns are deeper, moves are more erratic. The simulated vol ratio is 2.3× between negative and positive GEX regimes.
When the market breaks below the gamma flip level, a cascade can begin:
Price drops below gamma flip
  → Aggregate dealer gamma turns negative
  → Dealers start selling into further declines
  → Selling pressure pushes price lower
  → More put gamma enters the money
  → Dealer gamma becomes more negative
  → More forced selling
  → Volatility explodes
This is one mechanism behind the “orderly decline → sudden crash” pattern. The market can decline slowly while still in the positive GEX zone, with dealer hedging providing a cushion. Then it crosses the gamma flip level and the decline accelerates mechanically.
Think of the gamma flip as a phase transition, like water turning to ice. Conditions change gradually until they hit a critical threshold, then the behavior of the system changes discontinuously.
Where to Get GEX Data
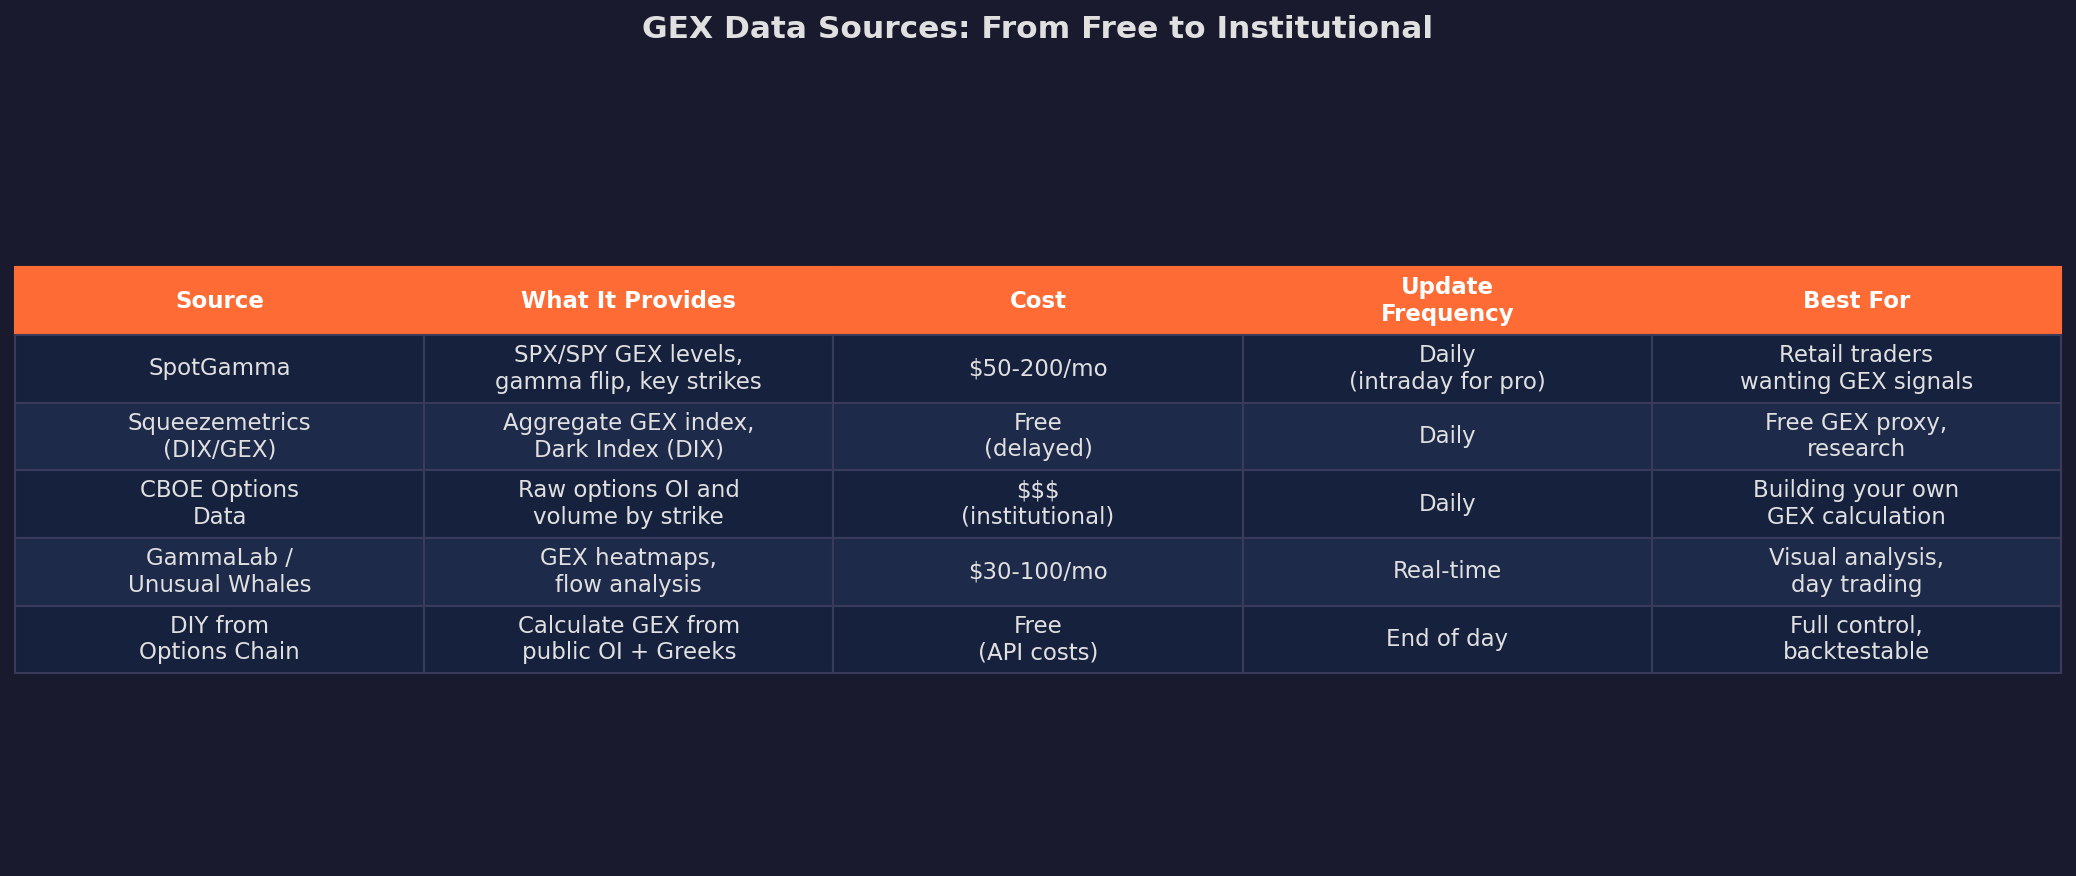
For research and backtesting, the most rigorous approach is to compute GEX yourself from options chain data. You need open interest by strike (CBOE or your broker’s API), a Black-Scholes calculator for gamma, and an assumption about which side of the trade the dealer is on (typically: dealers are short options that customers buy).
For daily monitoring, Squeezemetrics publishes a free (delayed) aggregate GEX index alongside their Dark Index (DIX). SpotGamma is the best-known retail provider, publishing daily GEX levels, the gamma flip, and key strike levels.
What This Means for V6
V6 operates at the daily frequency. It doesn’t trade options. But GEX conditioning can improve its risk-adjusted returns by telling V6 what kind of market it’s trading in.
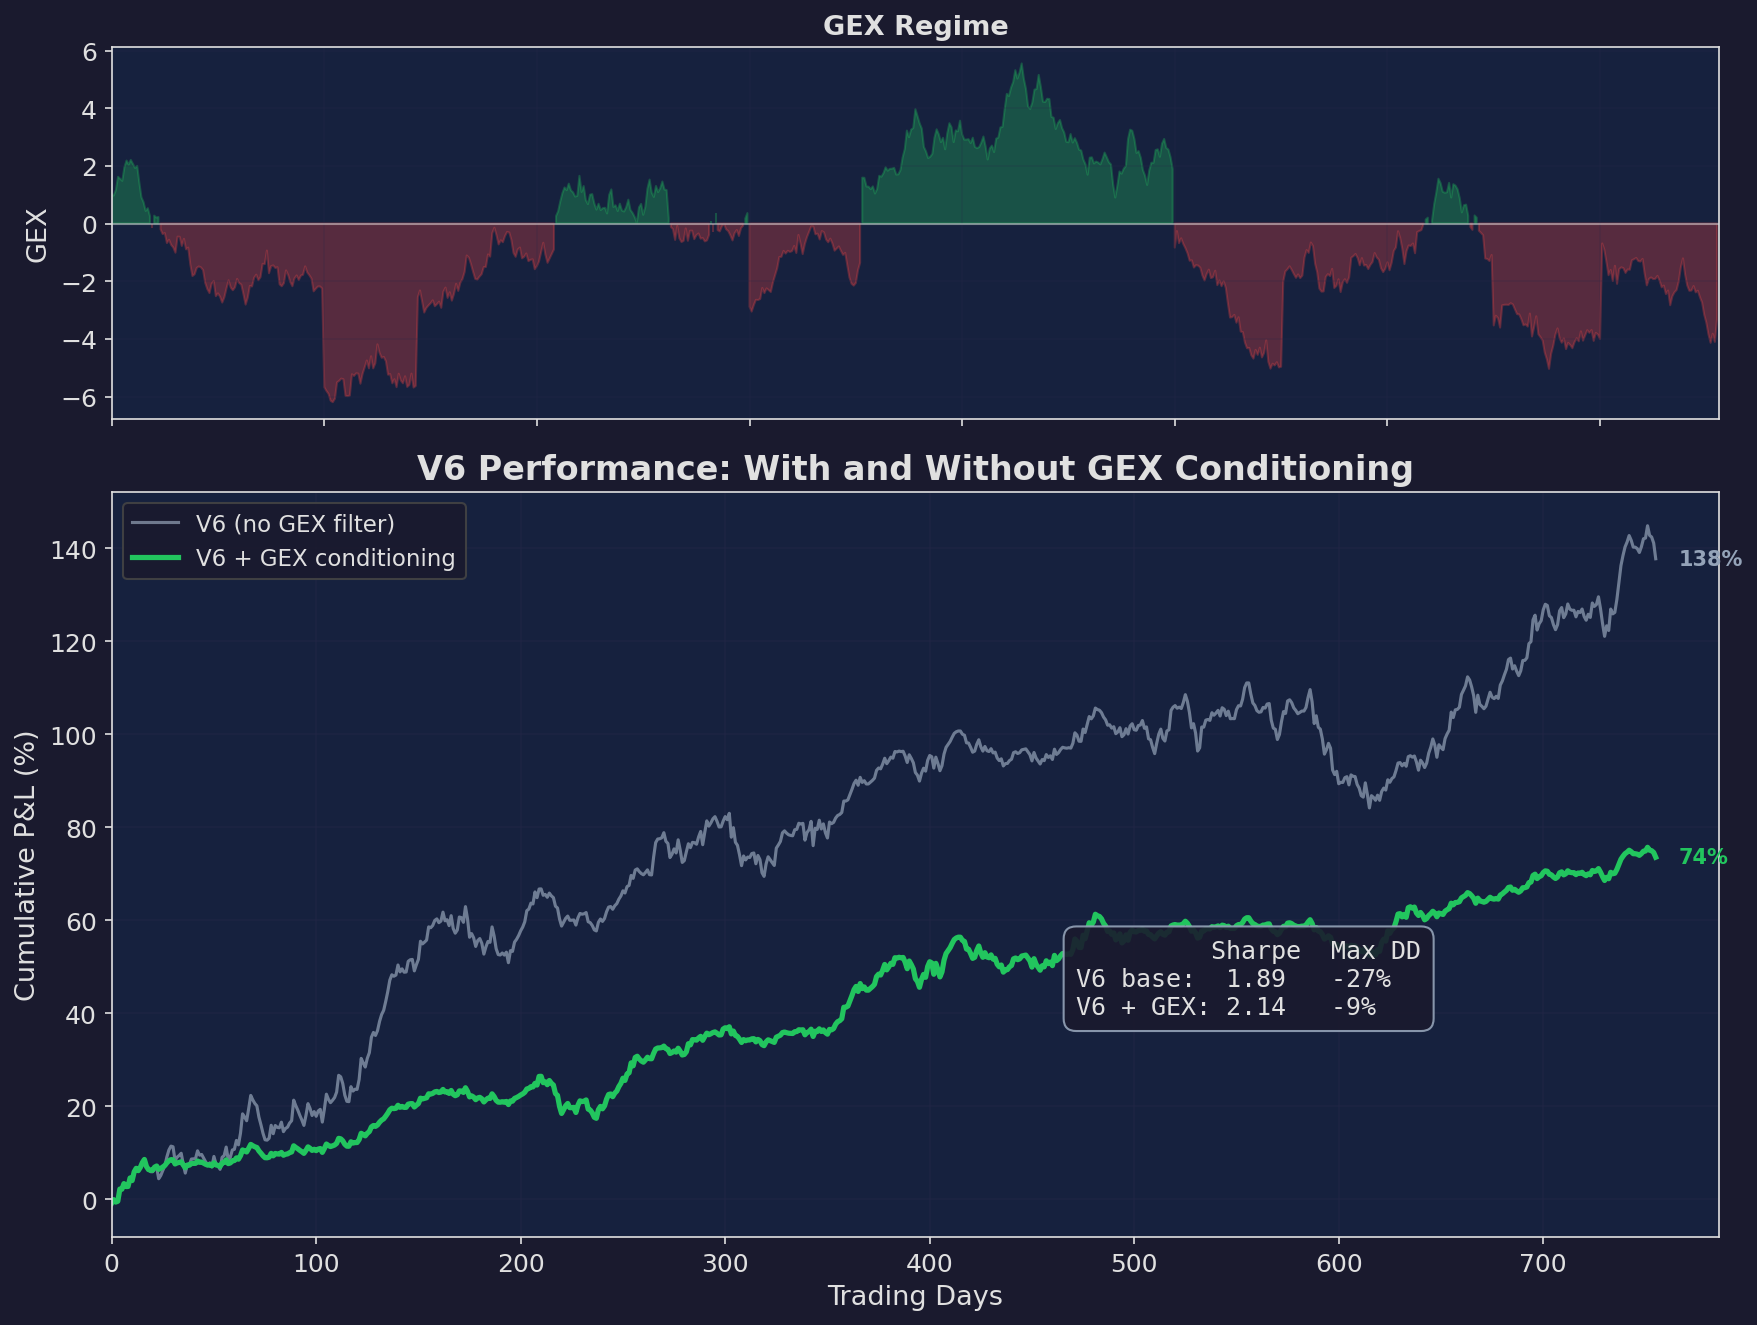
Top: GEX regime over 3 years. Bottom: V6 equity curve with and without GEX conditioning. The conditioned version scales to 30% position size when GEX is negative. It sacrifices raw returns (74% vs. 138%) but improves the Sharpe from 1.89 to 2.14 and cuts max drawdown from -27% to -9%.
The trade-off is stark: GEX conditioning costs you nearly half the total return but cuts the worst drawdown by two-thirds. For a strategy designed to compound over years, the max drawdown reduction is more valuable than the raw return — because a -27% drawdown requires a +37% recovery, while a -9% drawdown only requires +10%.
The V6 GEX Integration Rules
GEX Positive (aggregate GEX above zero):
  → Full V6 allocation
  → Expect mean-reverting market
  → Momentum signals may lag (price pinned)
  → Use tighter rebalance triggers

GEX Negative (aggregate GEX below zero):
  → Reduce to 30% allocation
  → Expect trending/gapping market
  → Momentum signals may be too slow
  → Widen stop-loss, reduce frequency

Gamma Flip (crossing from positive to negative):
  → Immediate risk reduction
  → This is not a drawdown to ride
  → Review TLT hedge allocation
The Honest Limitations
GEX is powerful but it’s not magic. Some caveats:
1. The dealer assumption is uncertain. We assume dealers are short the options customers buy. But sometimes dealers initiate positions, and sometimes customers are sellers. The sign can be wrong.
2. GEX explains vol, not direction. Positive GEX tells you vol will be low, but it doesn’t tell you if the market goes up or down (slowly). Negative GEX tells you moves will be large, but not which way.
3. The feedback is reflexive. As more traders watch GEX, they front-run the gamma flip, which changes the dynamics. The signal may decay (recall Part 80 on strategy decay half-lives).
4. 0DTE complicates everything. Most GEX models use end-of-day open interest. But 0DTE options open and close within the day, creating intraday GEX fluctuations that the end-of-day snapshot misses.
Despite these limitations, GEX as a volatility regime indicator is robust — the mechanical relationship between dealer hedging and vol is structural, not statistical. Dealers must hedge. That flow must affect prices. The direction and magnitude are uncertain, but the existence of the effect is not.
Up Next
Part 4: Building the Microstructure Signal Layer for V6 — Putting it all together. We’ll take VPIN (Part 1), spread dynamics (Part 1), execution timing (Part 2), and GEX conditioning (Part 3) and build a concrete signal layer on top of V6. Python code, data sources, and a walkforward backtest.
Remember: Alpha is never guaranteed. And the backtest is a liar until proven otherwise.
These posts are about methodology, not recommendations. If you find errors in my math, let me know — I’ve built an entire series around discovering my own mistakes, so one more won’t hurt.
The material presented in Math & Markets is for informational purposes only. It does not constitute investment or financial advice.
In the article you talk about the GEX flip. I think that’s one of the most oversimplified concepts in my experience. There is no one number one magic flip level marker makers along. Let’s just say put at certain levels shortcuts above or below it than long plates, etc., so I think it’s much more accurate to say below a certain level Markit makers all let’s go say sure Gamma until another level where they might be long Gamma.
Great question and exceellent reply. Ive been doing a lot of work in this area trying to find true Gex and can confirm all the services you mentioned, none of them use true Gex. Spotgamma is always held as the prime example but they used a form of implied direction which again is not exact. Excellent little video from Dan at Volsignals where he explains in simple terms what I found. https://www.youtube.com/watch?v=8tk6w0K9AIU