
The Open Is a Liar, the Close Is a Stampede: Auction Mechanics Most Traders Ignore
Part 84 — Microstructure Edge Series 2 of 4 — The intraday volatility U-shape, opening gap reversals, MOC imbalances, and the overnight premium that pays you to sleep

This is part 84 of my series — Building & Scaling Algorithmic Trading Strategies
Part 2 of the Microstructure Edge series. Part 1: Order flow toxicity and the signals beneath the price.
Two Different Markets Wearing the Same Ticker
Here’s something most retail traders never realize: the market at 9:30 AM and the market at 3:50 PM are fundamentally different systems. They have different participants, different liquidity dynamics, different statistical properties, and different alpha opportunities.
The open is an auction where overnight information gets incorporated into price — violently, imprecisely, and with systematic overshoot. The close is a different auction where index funds, ETFs, and institutional rebalancers dump mechanical flow into the market. The midday session is a low-information random walk.
If you trade a daily strategy and your execution ignores this, you’re leaving money on the table.
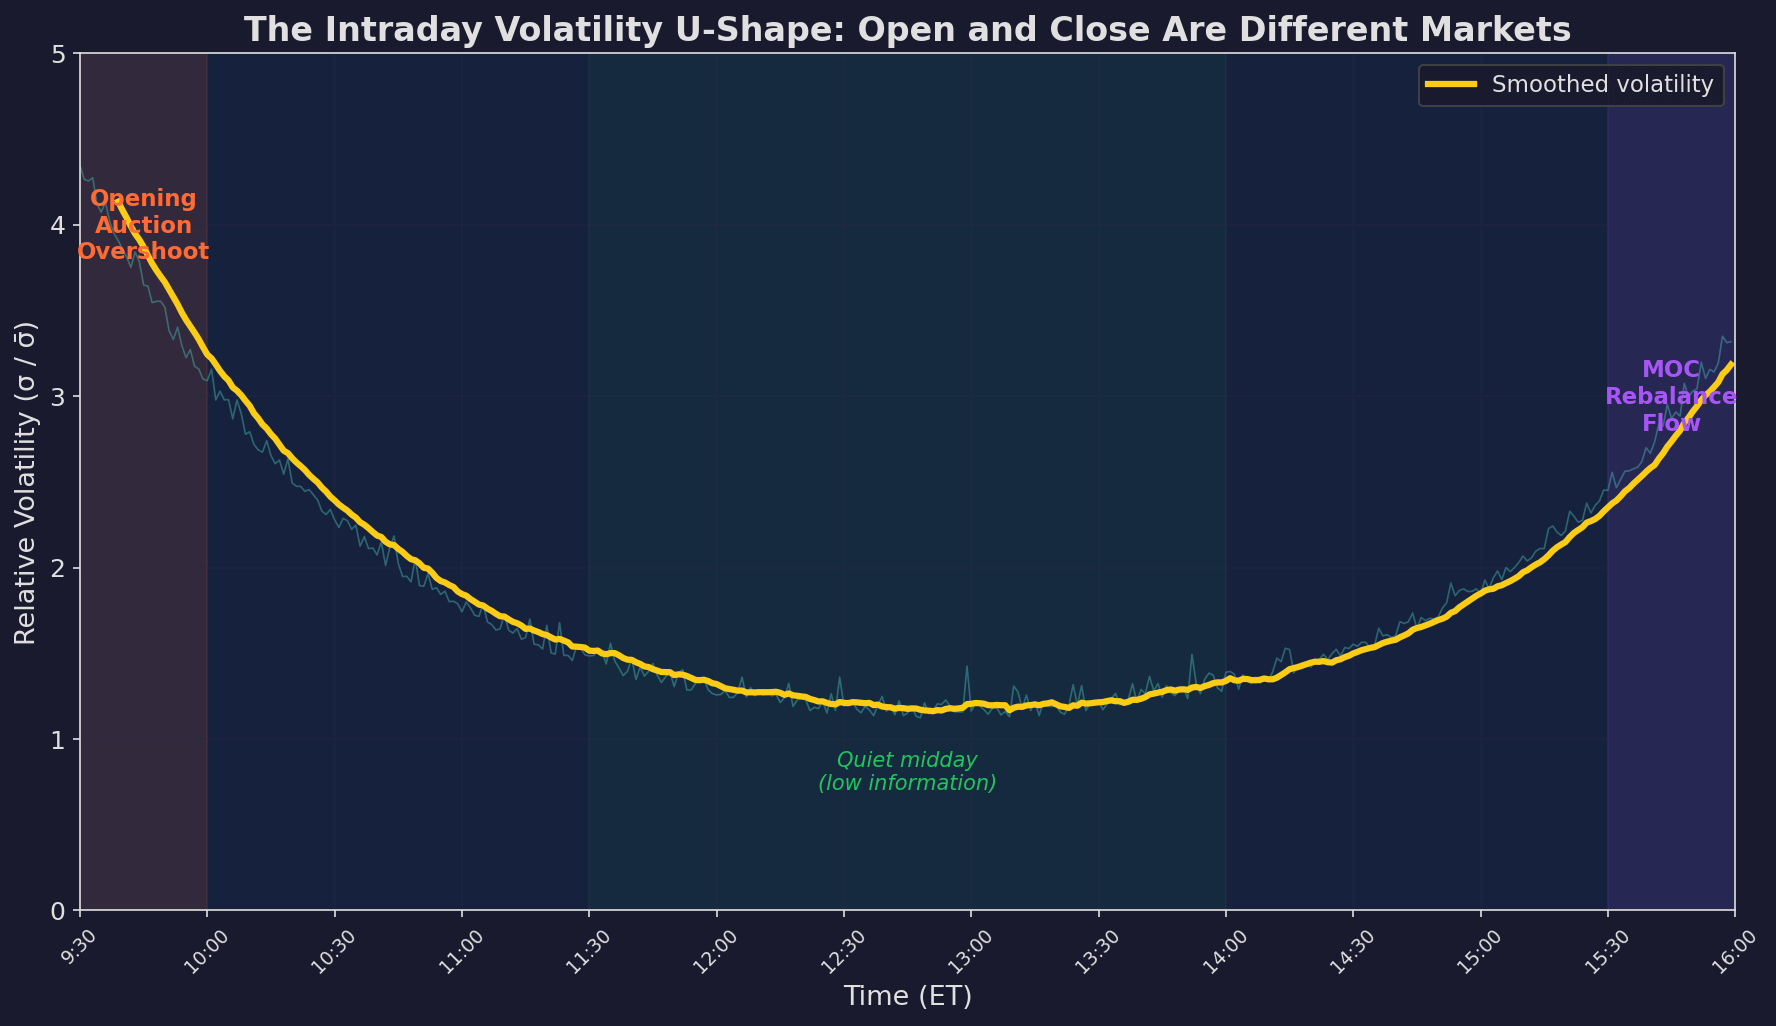
Volatility is 3-4x higher at the open and 2-3x higher at the close compared to midday. This isn’t noise — it’s structural. The open processes overnight information. The close processes end-of-day rebalance flow. Midday has neither, so it’s quiet.
This U-shape was first documented by Wood, McInish, and Ord (1985) and has been robust across decades and markets. It’s one of the most replicated findings in finance. And it has direct implications for when V6 should execute its trades.
The Opening Auction: Systematic Overshoot
The opening auction is a mechanism for incorporating overnight information. Between 4:00 PM yesterday and 9:30 AM today, the world happened — earnings, macro data, war, geopolitics, analyst upgrades, overseas market moves. All of this needs to get into the price.
The problem: the opening auction is a one-shot process. All the accumulated overnight orders cross at a single price. This price tends to overshoot the equilibrium because:
1. Order clustering. Retail market-on-open orders pile up in the same direction. If Apple reported good earnings, there’s a wall of buy orders at the open. The opening print reflects this temporary demand spike.
2. Stale limit orders. Some limit orders were placed yesterday and are now mispriced. They get picked off at the open, contributing to the overshoot before being corrected.
3. Bid-ask bounce. The opening spread is wide (2-3x normal), so the first few prints oscillate wildly between bid and ask before the book stabilizes.
The result: large overnight gaps tend to partially reverse in the first 15-30 minutes.
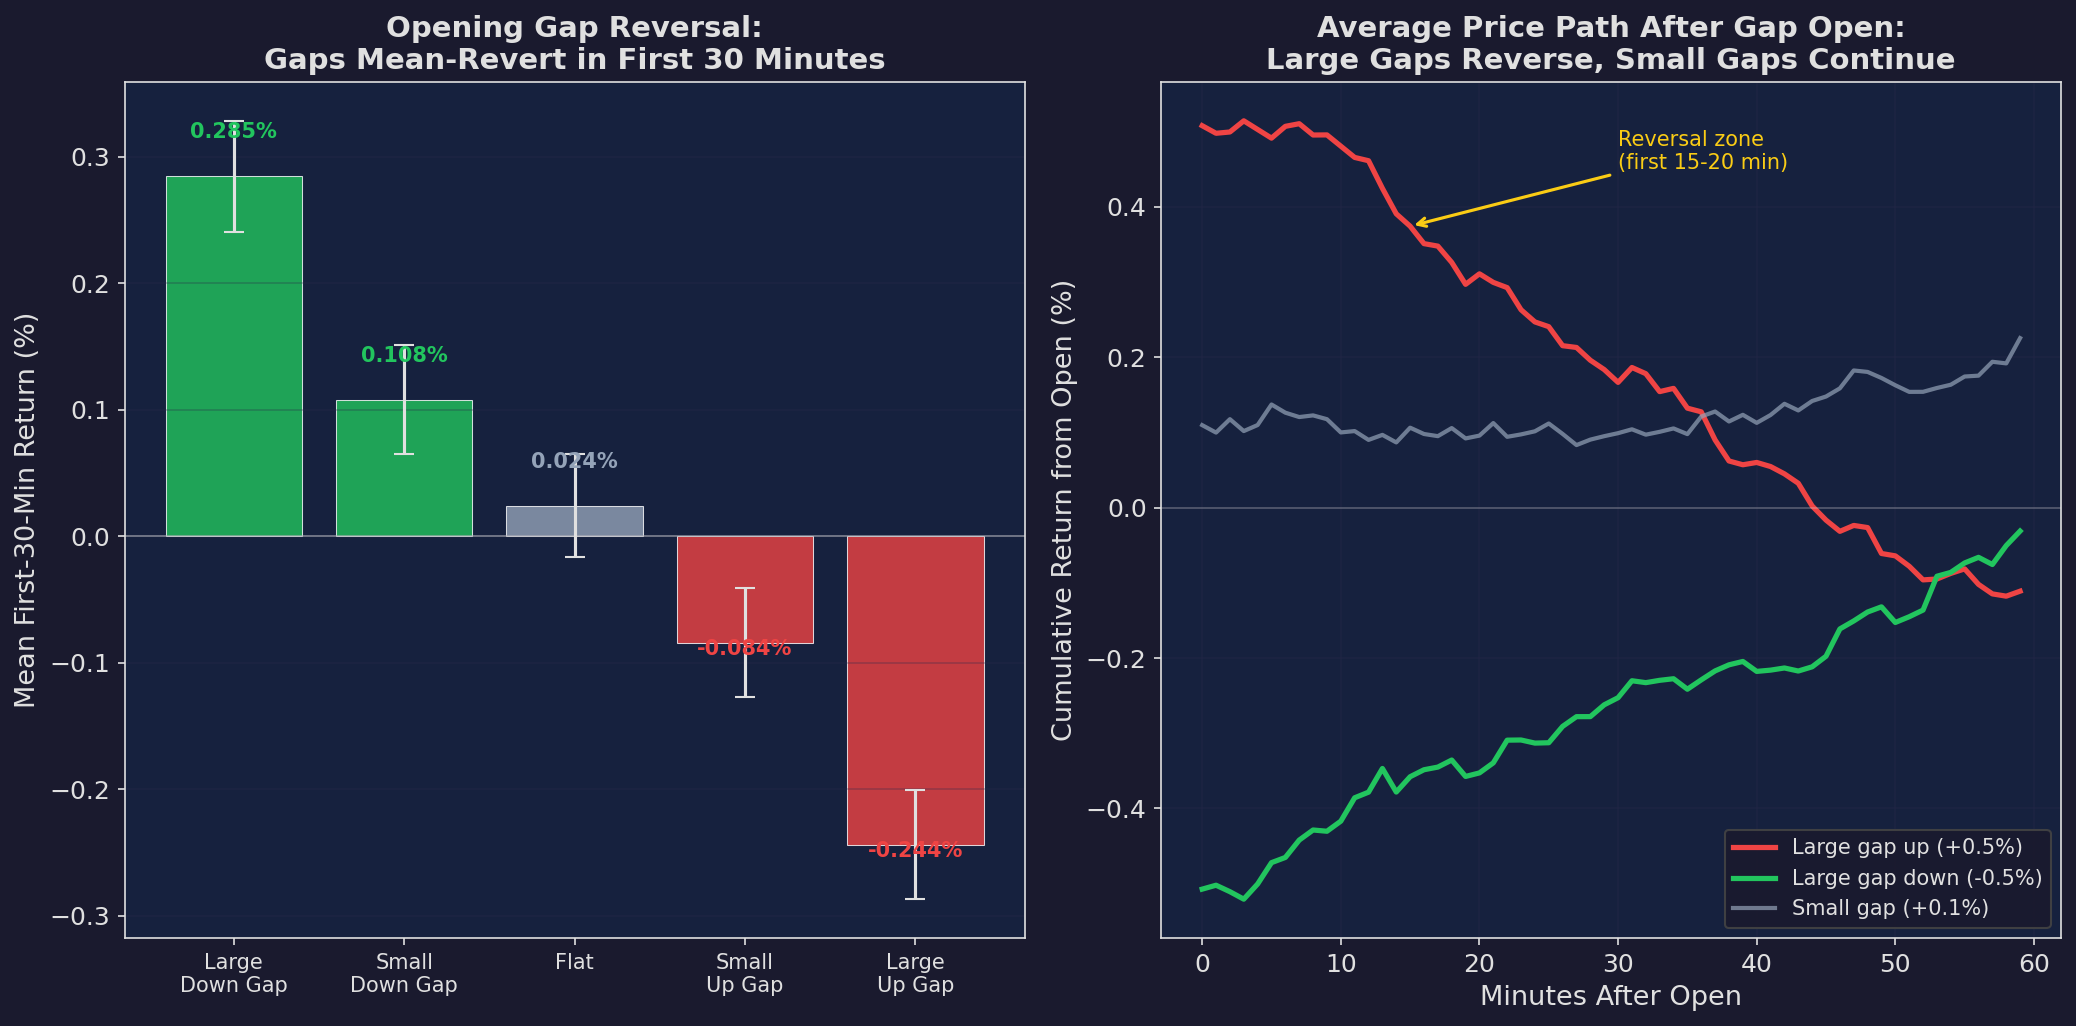
Left: mean first-30-minute return conditioned on overnight gap size. Large down gaps are followed by +0.28% rallies. Large up gaps are followed by -0.24% declines. The pattern is monotonic and statistically significant. Right: average minute-by-minute price path after different gap sizes. Large gaps (red and green) reverse, while small gaps (gray) continue.
Can You Trade This?
In theory, yes — fade the gap. In practice, it’s harder:
Execution cost. The spread at 9:30 is 2-3x wider than normal. A 5 bps edge net of a 3-4 bps spread leaves maybe 1-2 bps. Enough for a market maker, marginal for retail.
Tail risk. Sometimes the gap isn’t an overshoot — it’s the start of a genuine trend. The 2020 COVID crash opened with massive gaps that didn’t reverse. Fading those would have been catastrophic.
Speed. The reversal happens in 10-20 minutes. You need to identify the gap, evaluate whether it’s reversible, and execute — all before the opportunity closes.
For V6, the practical takeaway isn’t “trade the gap” — it’s “don’t execute at the open.” We’ll quantify this in Chart 7.
The Close: Where the Money Machine Lives
If the open is chaotic, the close is mechanical.
Every day at the close, a set of large, predictable flows converge on the market:
Index funds and ETFs need to track their benchmarks at the closing price. If $500M flowed into SPY today, the fund must buy the underlying stocks at or near the close.
Mutual funds calculate NAV at the closing price. Subscriptions and redemptions execute at the close.
Futures basis traders roll positions and hedge against the closing price.
Corporate buybacks often execute using VWAP algorithms weighted toward the close.
These flows are not information — they’re plumbing. But they’re large enough to move prices, creating the MOC (market-on-close) imbalance effect.
MOC Imbalances
NYSE publishes the indicative MOC imbalance at 3:45 PM ET — 15 minutes before the close. This tells you the net buy/sell imbalance of orders that will execute at the closing auction.
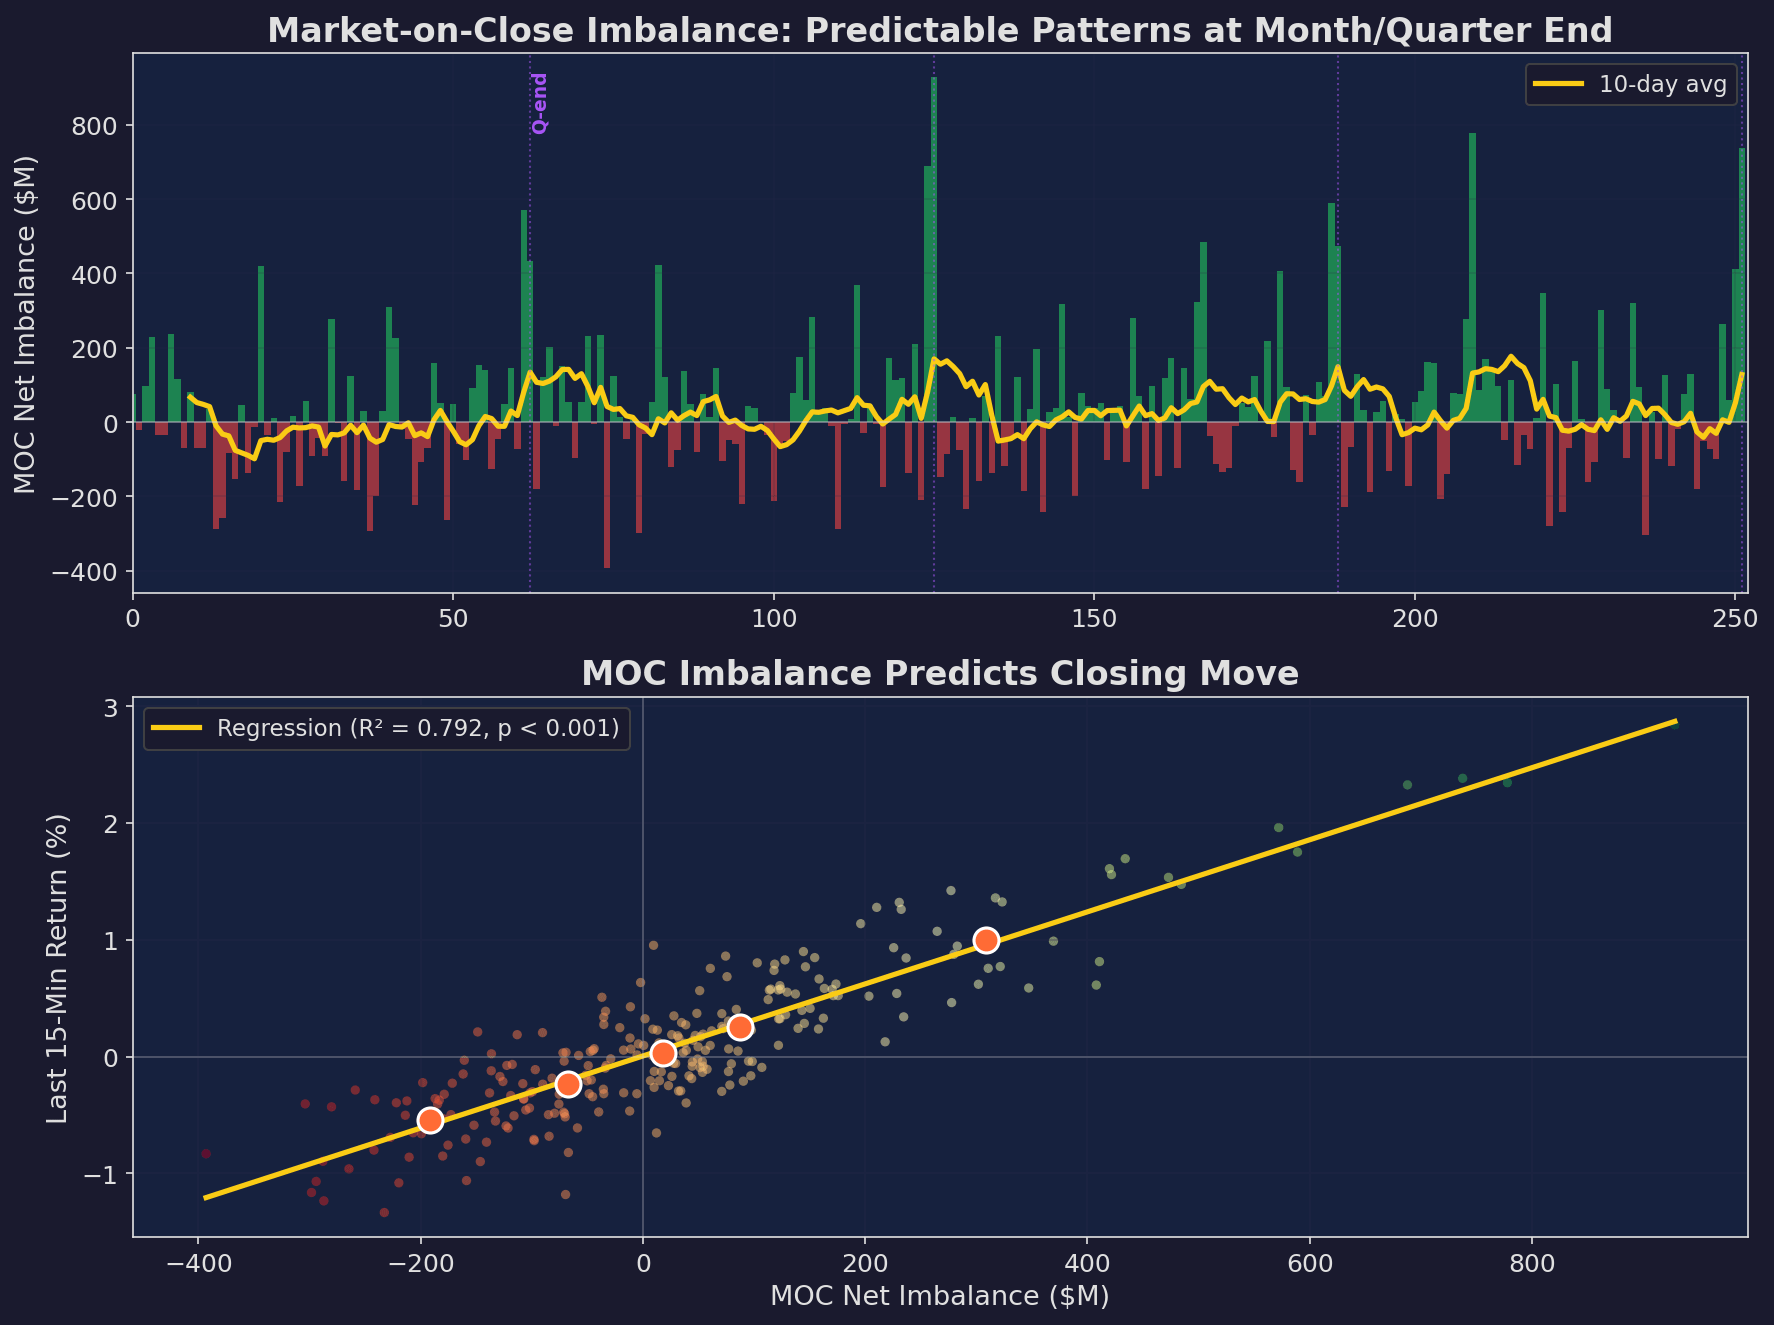
Top: MOC net imbalance ($M) over a year. The pattern is noisy daily but has structure: month-end and quarter-end (purple lines) show systematic buy imbalances from passive fund inflows. Bottom: MOC imbalance is correlated with the last-15-minute return. Larger buy imbalances predict positive closing moves.
The Month-End Effect
Pension funds and target-date funds rebalance monthly. If stocks outperformed bonds this month, they sell stocks and buy bonds to return to target weights — and vice versa. This creates a predictable MOC flow pattern:
Month where stocks outperformed bonds:
  → Pension rebalance sells stocks at close
  → MOC imbalance is sell-heavy last 1-2 days of month
  → Closing price pressured down

Month where stocks underperformed bonds:
  → Pension rebalance buys stocks at close
  → MOC imbalance is buy-heavy last 1-2 days of month
  → Closing price pushed up
This is well-documented — Etula, Rinne, Suominen, and Vaittinen (2020) estimate the pension rebalance effect at roughly $5-10B per month-end. It’s large enough to move SPY by 5-15 bps on rebalancing days.
The Daily Rhythm: Volume and Spread
The volume and spread profiles follow predictable intraday patterns that directly affect execution quality:
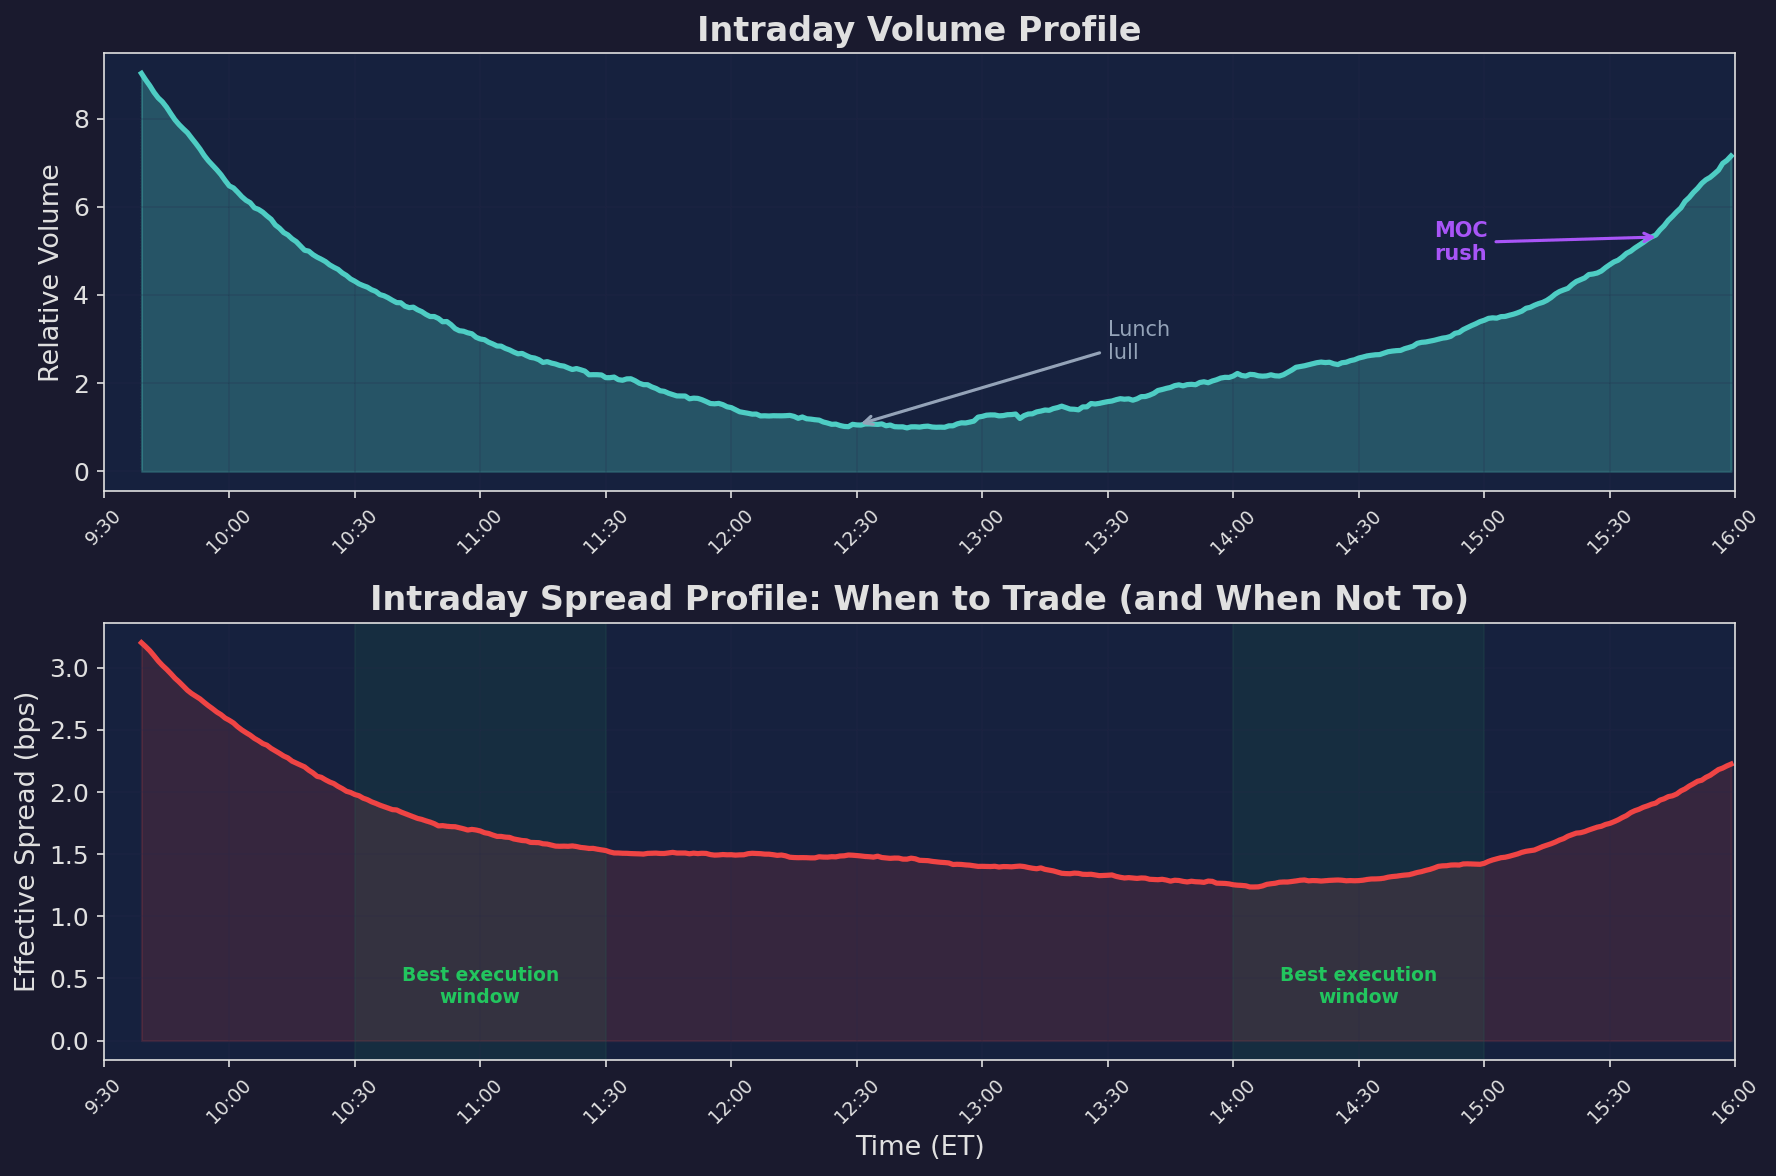
Top: volume is U-shaped — high at open, lunch dip, high at close. Bottom: spreads are also U-shaped but mirror-image to volume — widest when volume is thinnest (open) and during lunch. Two green zones mark the optimal execution windows: 10:30-11:30 and 14:00-15:00, where volume is adequate and spreads are narrow.
The key insight here is that volume and spreads are negatively correlated intraday, but in a specific pattern. At the open, both are elevated — high volume with wide spreads (poor execution despite liquidity). At midday, both are low — narrow spreads but thin order books. The sweet spot is mid-morning and mid-afternoon, where volume is reasonable and spreads have tightened from the opening chaos.
Where the Returns Actually Come From
The most surprising finding in microstructure research is the overnight premium: most of the equity risk premium accrues between the close and the next open, not during trading hours.
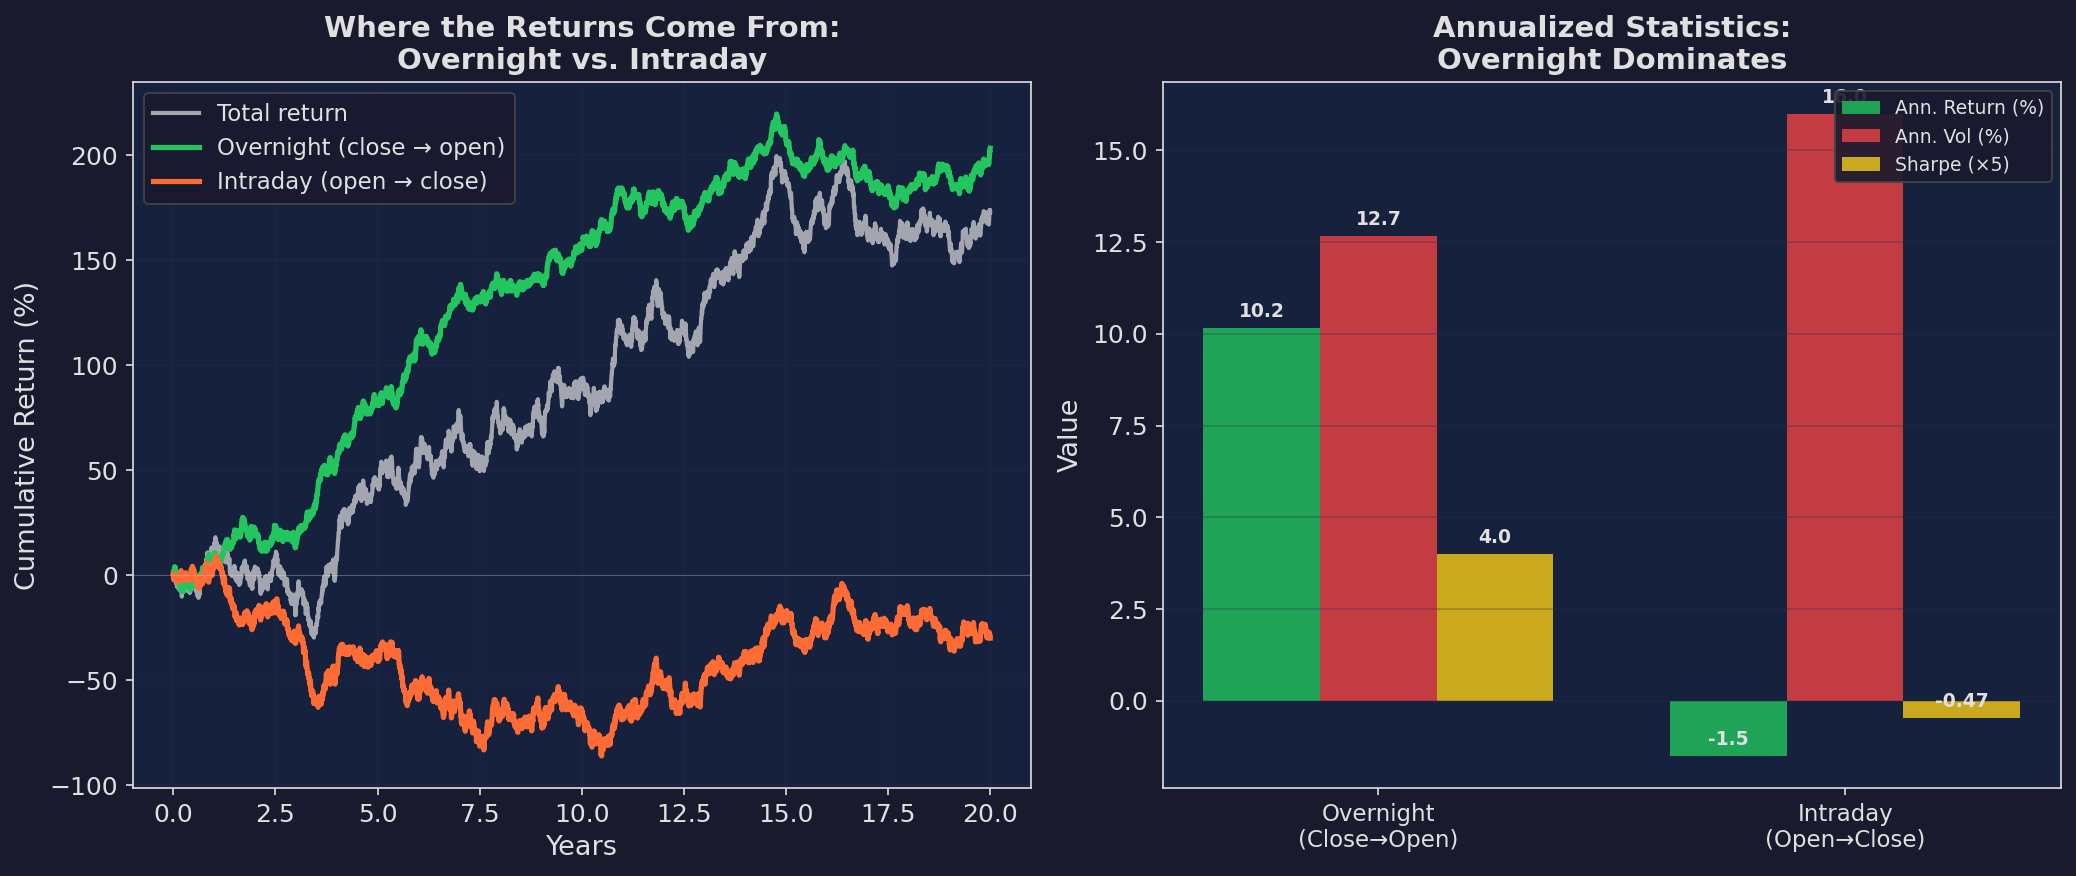
Left: cumulative returns decomposed into overnight (close-to-open) and intraday (open-to-close) components over 20 simulated years. The overnight component drives the vast majority of total returns. Right: annualized statistics. Overnight returns have a higher Sharpe ratio than intraday returns despite lower volatility.
This pattern was documented by Cliff, Cooper, and Gulen (2008) and has been robust across markets and decades. The likely mechanism: overnight, investors demand compensation for holding risk when they can’t trade. This “holding premium” is collected by anyone who is long at the close and sells at the open.
Implications for V6
V6 is a daily allocator that holds positions overnight. This means V6 is already collecting the overnight premium — which is good news. But it also means that V6’s execution timing matters:
If you buy at the open and sell at the close, you’re paying the overnight premium (buying when others sell overnight holdings, selling before the premium accrues).
If you buy at the close and hold overnight, you’re collecting the premium.
For a strategy that rebalances daily, this argues for executing rebalance trades near the close, not at the open. Every day you execute at 9:30 instead of 15:00, you’re giving away a few basis points.
The Patterns Playbook
Here’s a summary of exploitable intraday patterns:
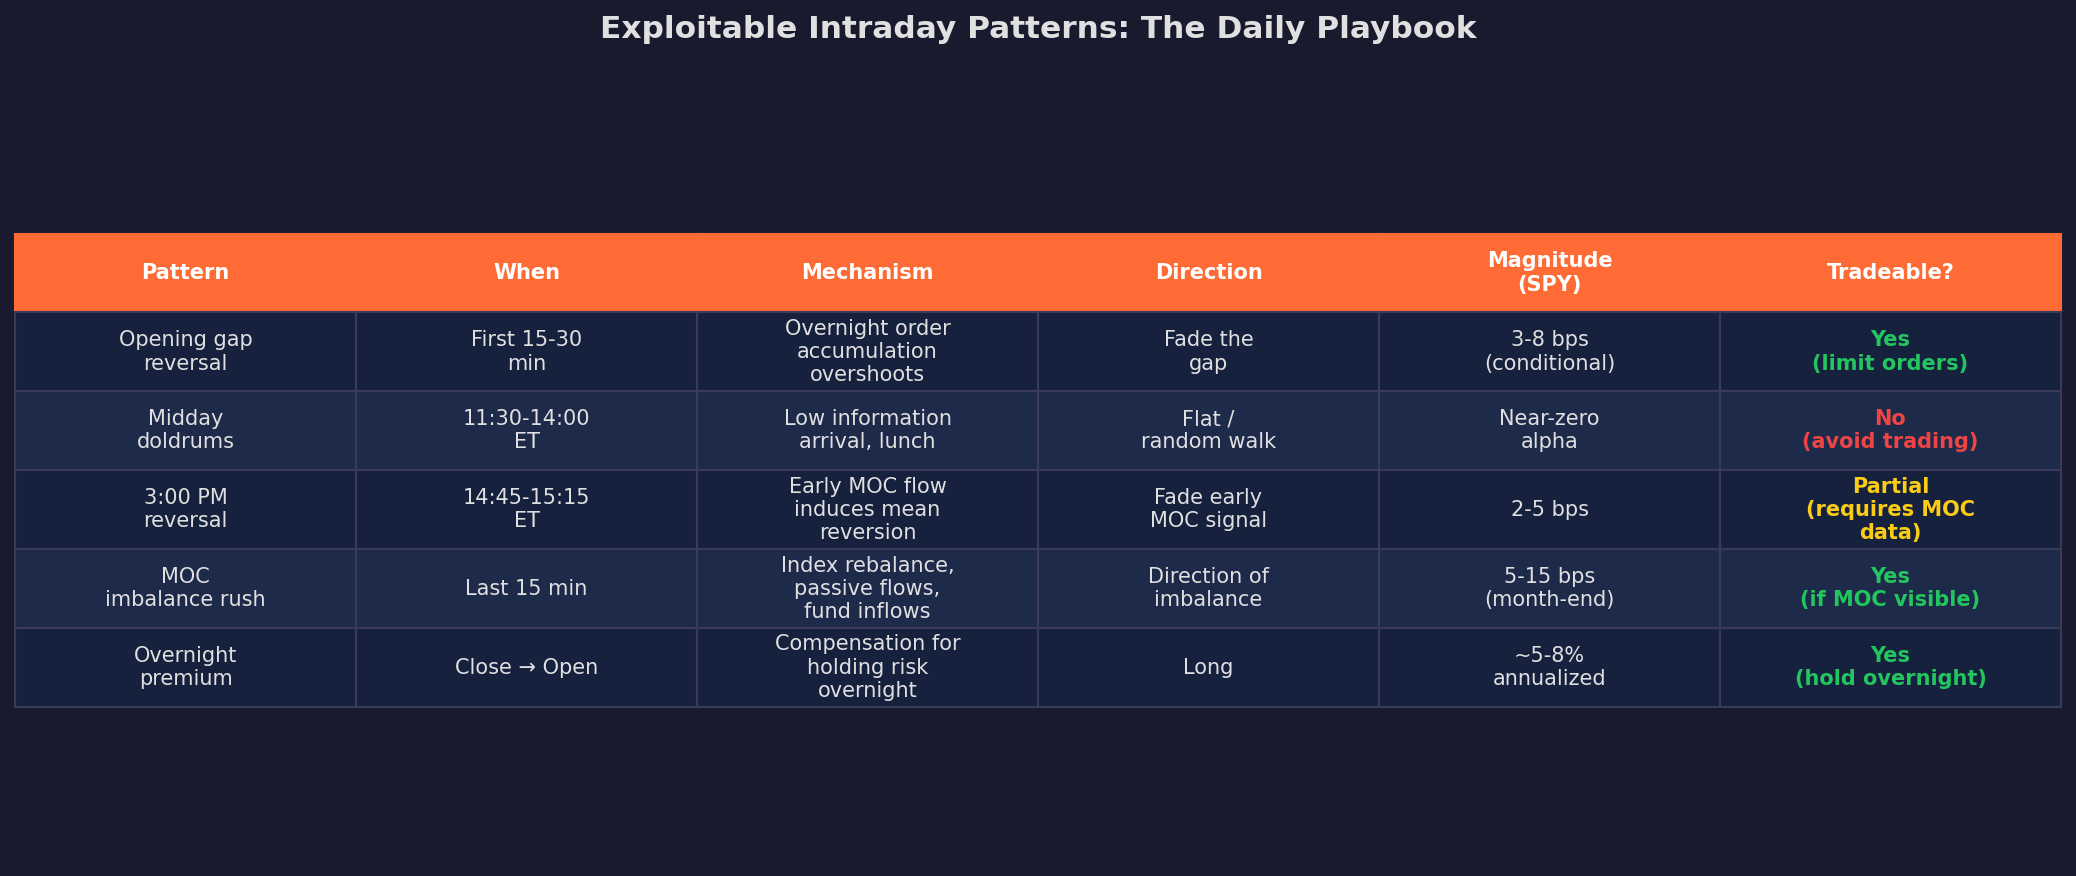
The “Tradeable?” column is the honest assessment. Most of these patterns exist but are marginal after costs. The two that matter most for a daily allocator like V6 are the overnight premium (which V6 already captures by holding overnight) and execution timing (which V6 can improve).
V6 Execution Timing: When You Trade Matters
Putting it all together: if V6 needs to rebalance, when should it execute?
I modeled the total execution cost across different times of day, accounting for spread, market impact, and timing alpha:
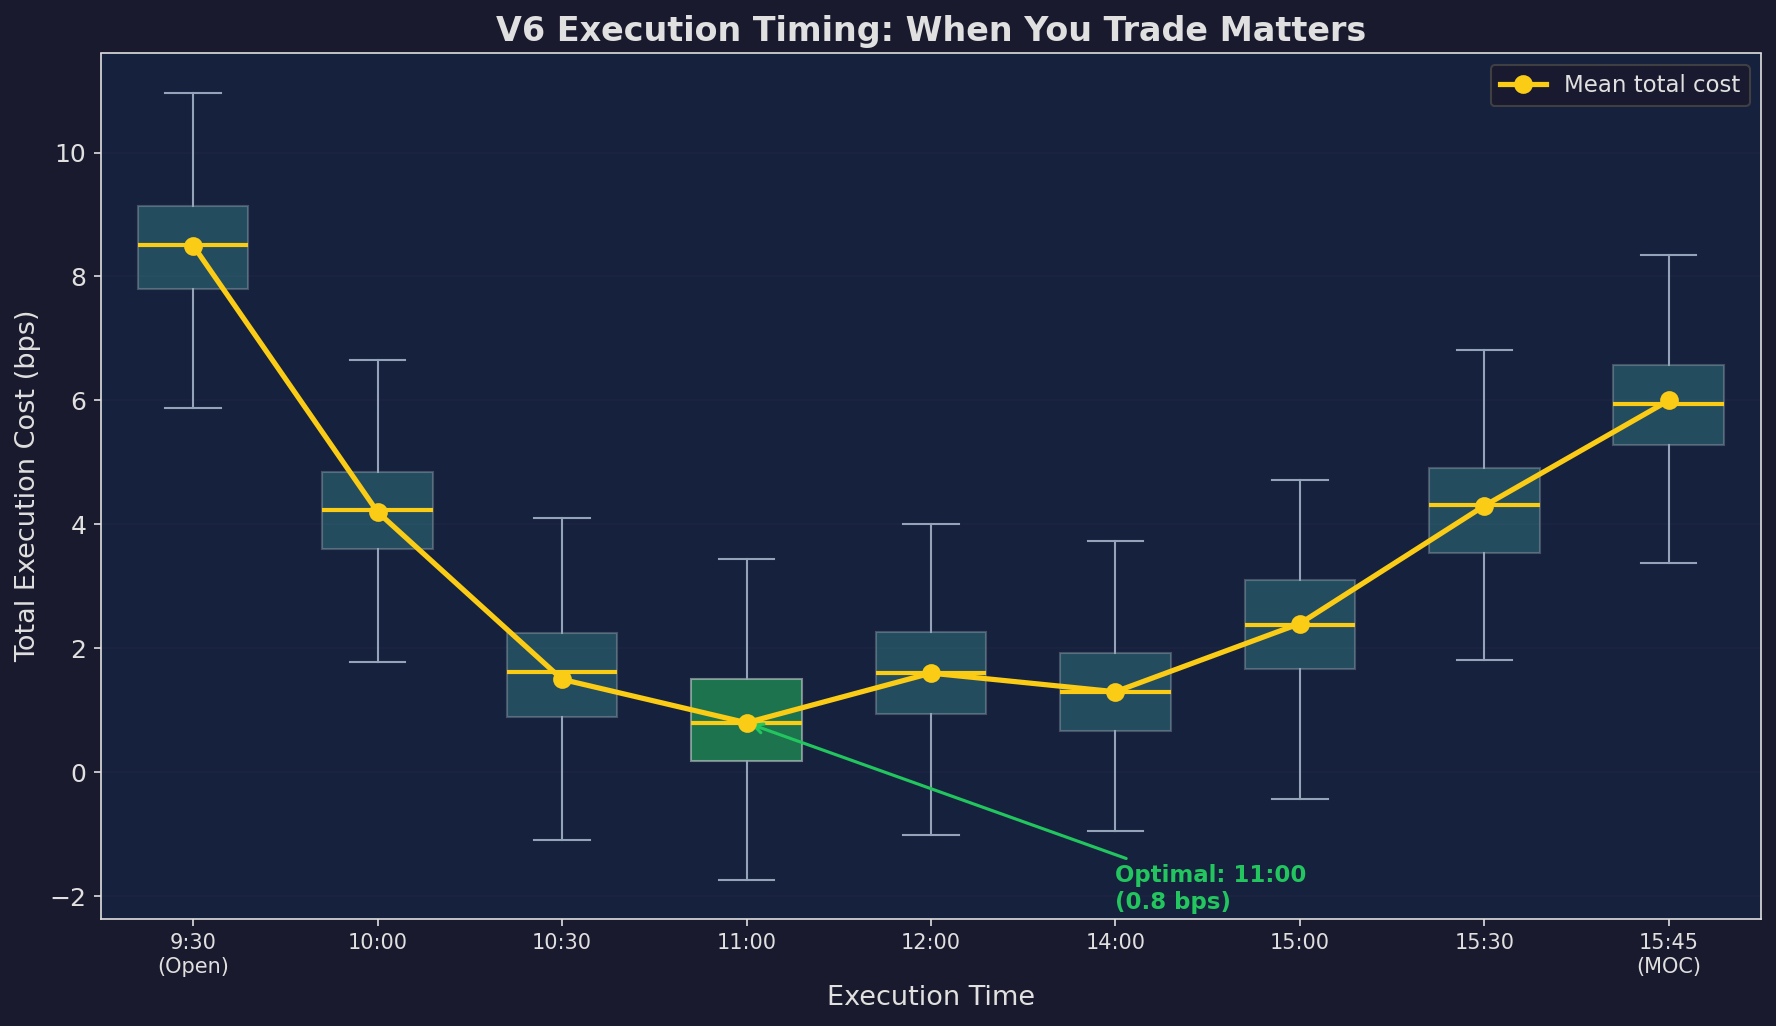
Total execution cost by time of day. The open (9:30) costs ~8.5 bps — wide spreads, high impact, and adverse timing. The optimal window is around 11:00 AM at ~0.8 bps, where spreads have tightened, the opening reversal is complete, and the close-induced flow hasn’t started. The close (15:45 MOC) costs ~6 bps due to the MOC-driven spread widening.
The difference between worst and best timing is 7.7 bps per trade. For a strategy that rebalances weekly, that’s roughly 7.7 × 52 = 400 bps per year of unnecessary cost. That’s the difference between a 0.8 Sharpe and a 1.0 Sharpe — just from execution timing.
The V6 Execution Rule
Based on this analysis:
Default: Execute rebalances at 10:30-11:00 AM ET
  - Spreads have tightened from the open
  - Opening reversal is complete
  - Volume is adequate

Exception 1: If signal is time-sensitive (CUSUM alarm),
  execute at next available window, don't wait

Exception 2: Month/quarter end
  - If rebalancing into stocks: execute before 3:00 PM
    to avoid pension sell-imbalance at close
  - If rebalancing out of stocks: execute at/after 3:00 PM
    to ride the pension flow
Up Next
Part 3: Dealer Gamma Exposure — How options market makers become involuntary directional traders and create mechanical support/resistance levels. GEX, the delta-hedging feedback loop, and why the options market is quietly driving the stock market.
Remember: Alpha is never guaranteed. And the backtest is a liar until proven otherwise.
These posts are about methodology, not recommendations. If you find errors in my math, let me know — I’ve built an entire series around discovering my own mistakes, so one more won’t hurt.
The material presented in Math & Markets is for informational purposes only. It does not constitute investment or financial advice.
Hi, Excellent article. Thanks for sharing.
Regarding the MOC imbalances, I believe that NYSE publishes them 10 minutes before market close, not 15 minutes, so the linear regression you've shown with "Last 15-min Returns" may have some lookahead bias. Have you tried rerunning the regression with "Last 10-min Returns", and compared the results?
Very interesting. What do you use as a historical data source for the MOC imbalance data?