
The LEGO Bricks of Options: Put-Call Parity and the Art of Building Any Payoff You Want
Part 91 — Understanding synthetic positions changes how you think about risk

This is part 91 of my series — Building & Scaling Algorithmic Trading Strategies
This begins a 4-part series on synthetic replication. Part 1: the building blocks. Part 2: replicating hedge fund strategies. Part 3: vol surface arbitrage. Part 4: an options overlay for V6.
Options Are Just Payoff Shapes
Most people learn options as a catalog of strategies: covered calls, protective puts, iron condors, butterflies. Each has a name, a diagram, and a use case. This is like learning architecture by memorizing floor plans.
The better way: understand the four building blocks, learn the one equation that connects them, and then design whatever payoff shape you need.
The Four Bricks
Every option position in existence is a combination of four elemental payoffs:
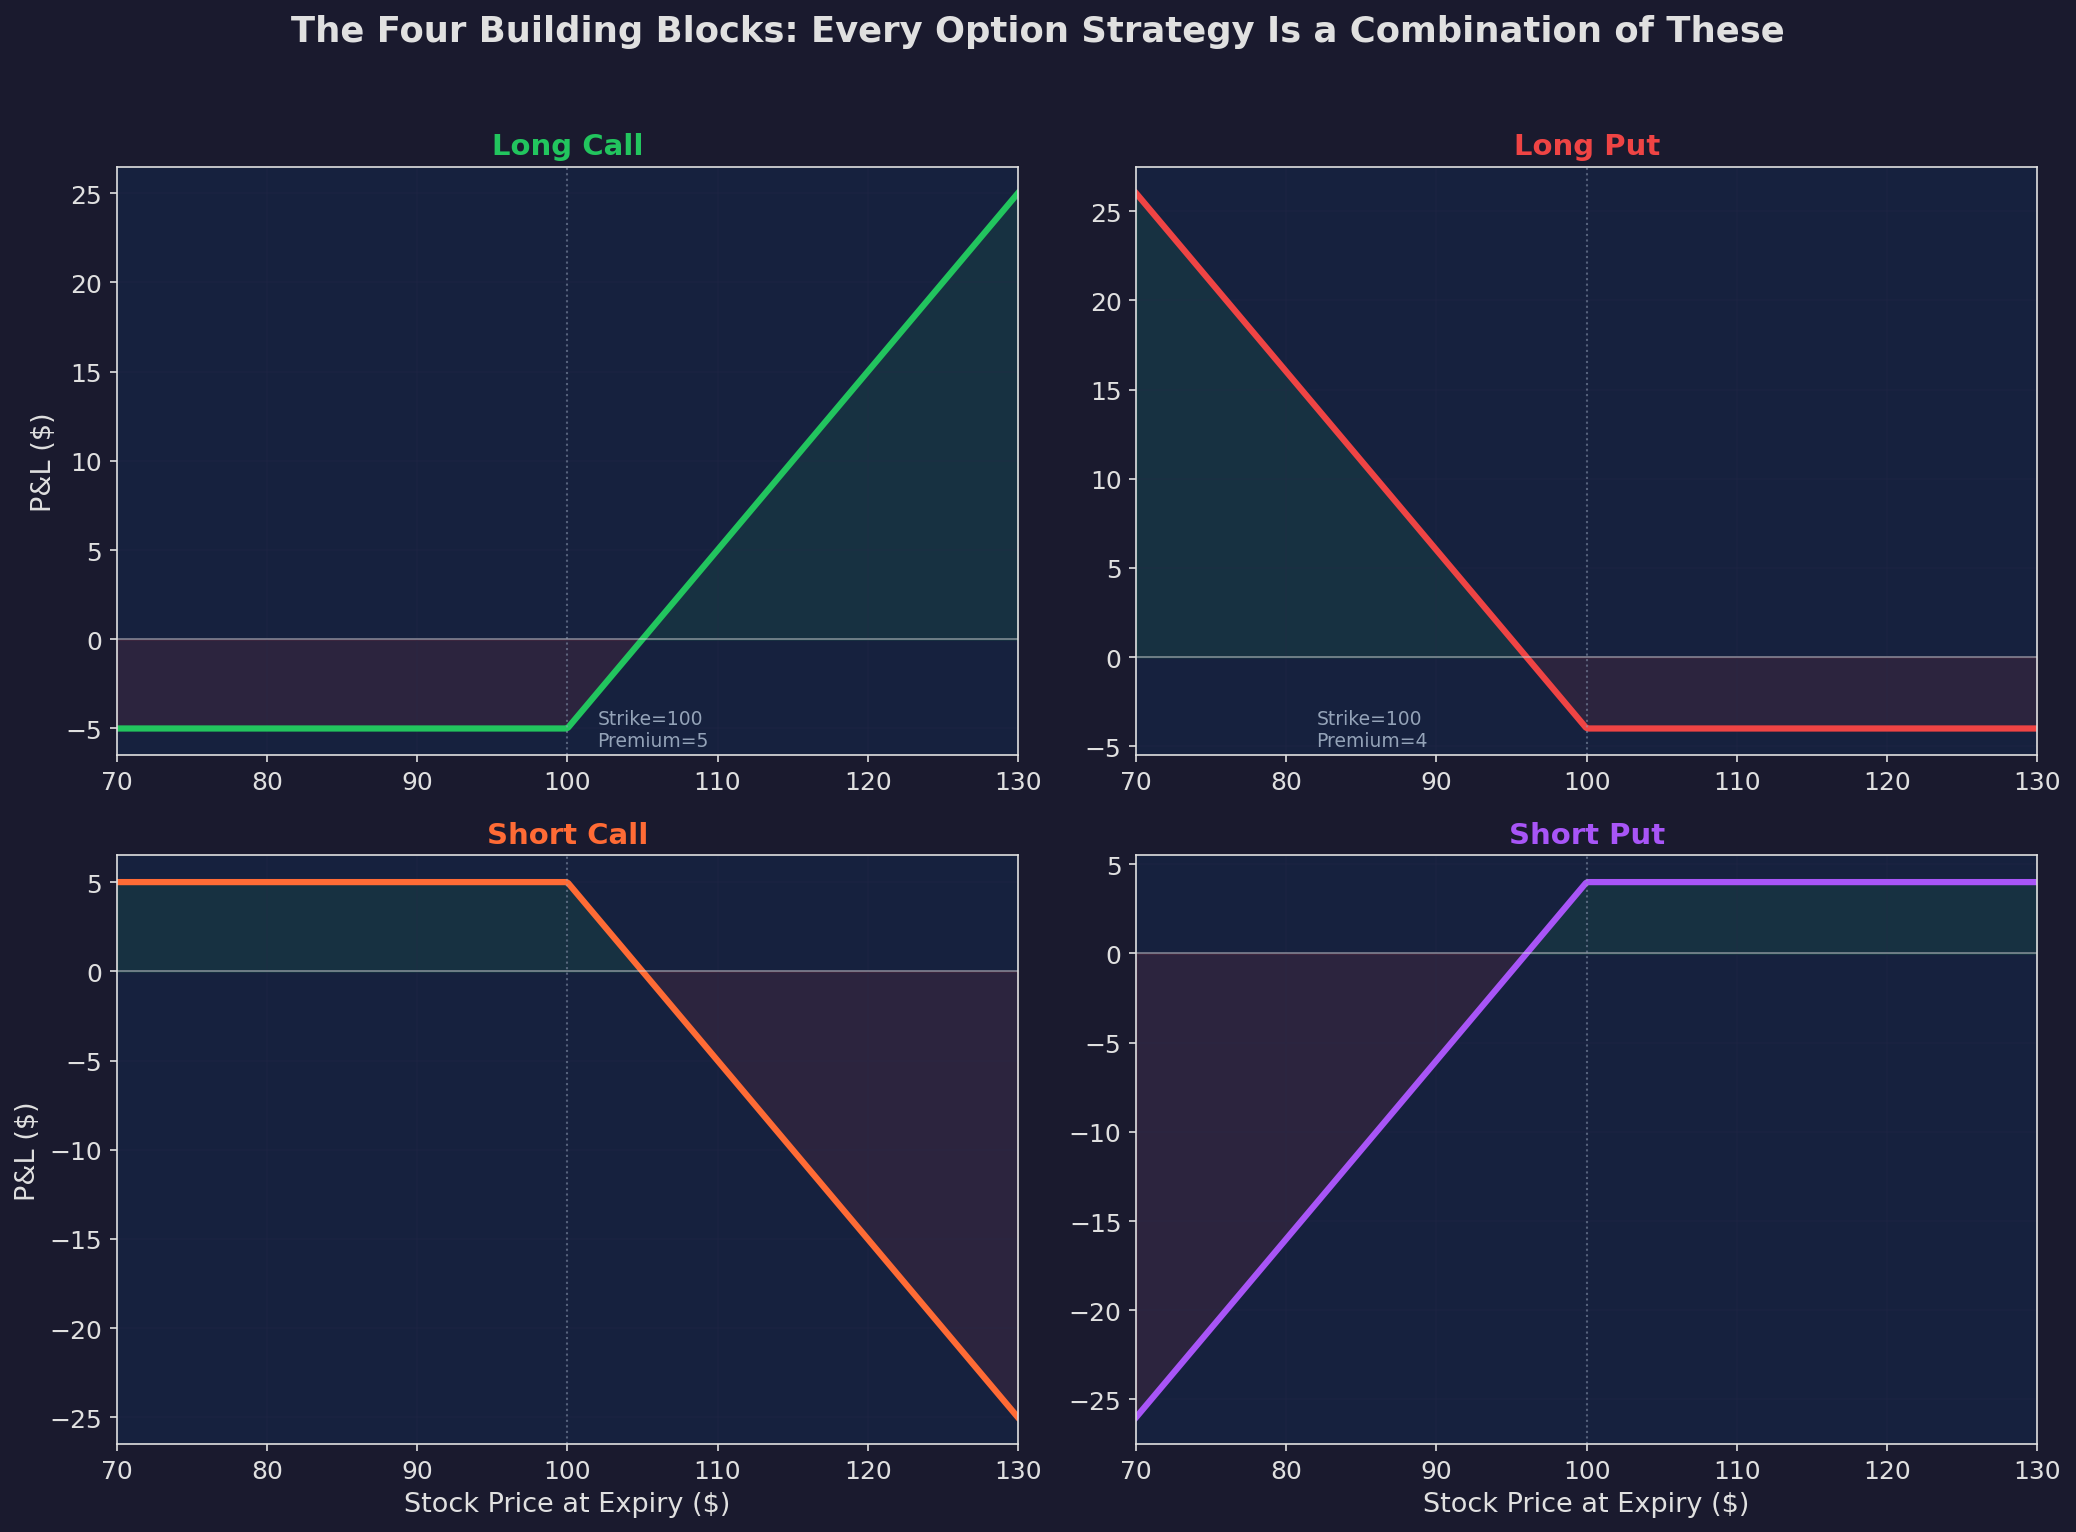
Top left: Long Call — unlimited upside, capped downside. Top right: Long Put — profits from decline, capped loss. Bottom left: Short Call — income if flat/down, unlimited risk if up. Bottom right: Short Put — income if flat/up, large risk if down. Every strategy you’ve ever seen is a linear combination of these four payoffs plus long or short stock.
The key insight: these four shapes are linearly independent. Any payoff diagram you can draw — literally any combination of slopes, kinks, and flat sections — can be constructed by adding these together with appropriate strikes and sizes.
This is why options are sometimes called “financial LEGO.” Four brick types, infinite possible structures.
The One Equation: Put-Call Parity
In 1969, Hans Stoll published the relationship that connects everything:
C - P = S - K·e^(-rT)Call price minus put price equals stock price minus the present value of the strike. Same strike, same expiry. Always. In every market, for every stock, at every moment.
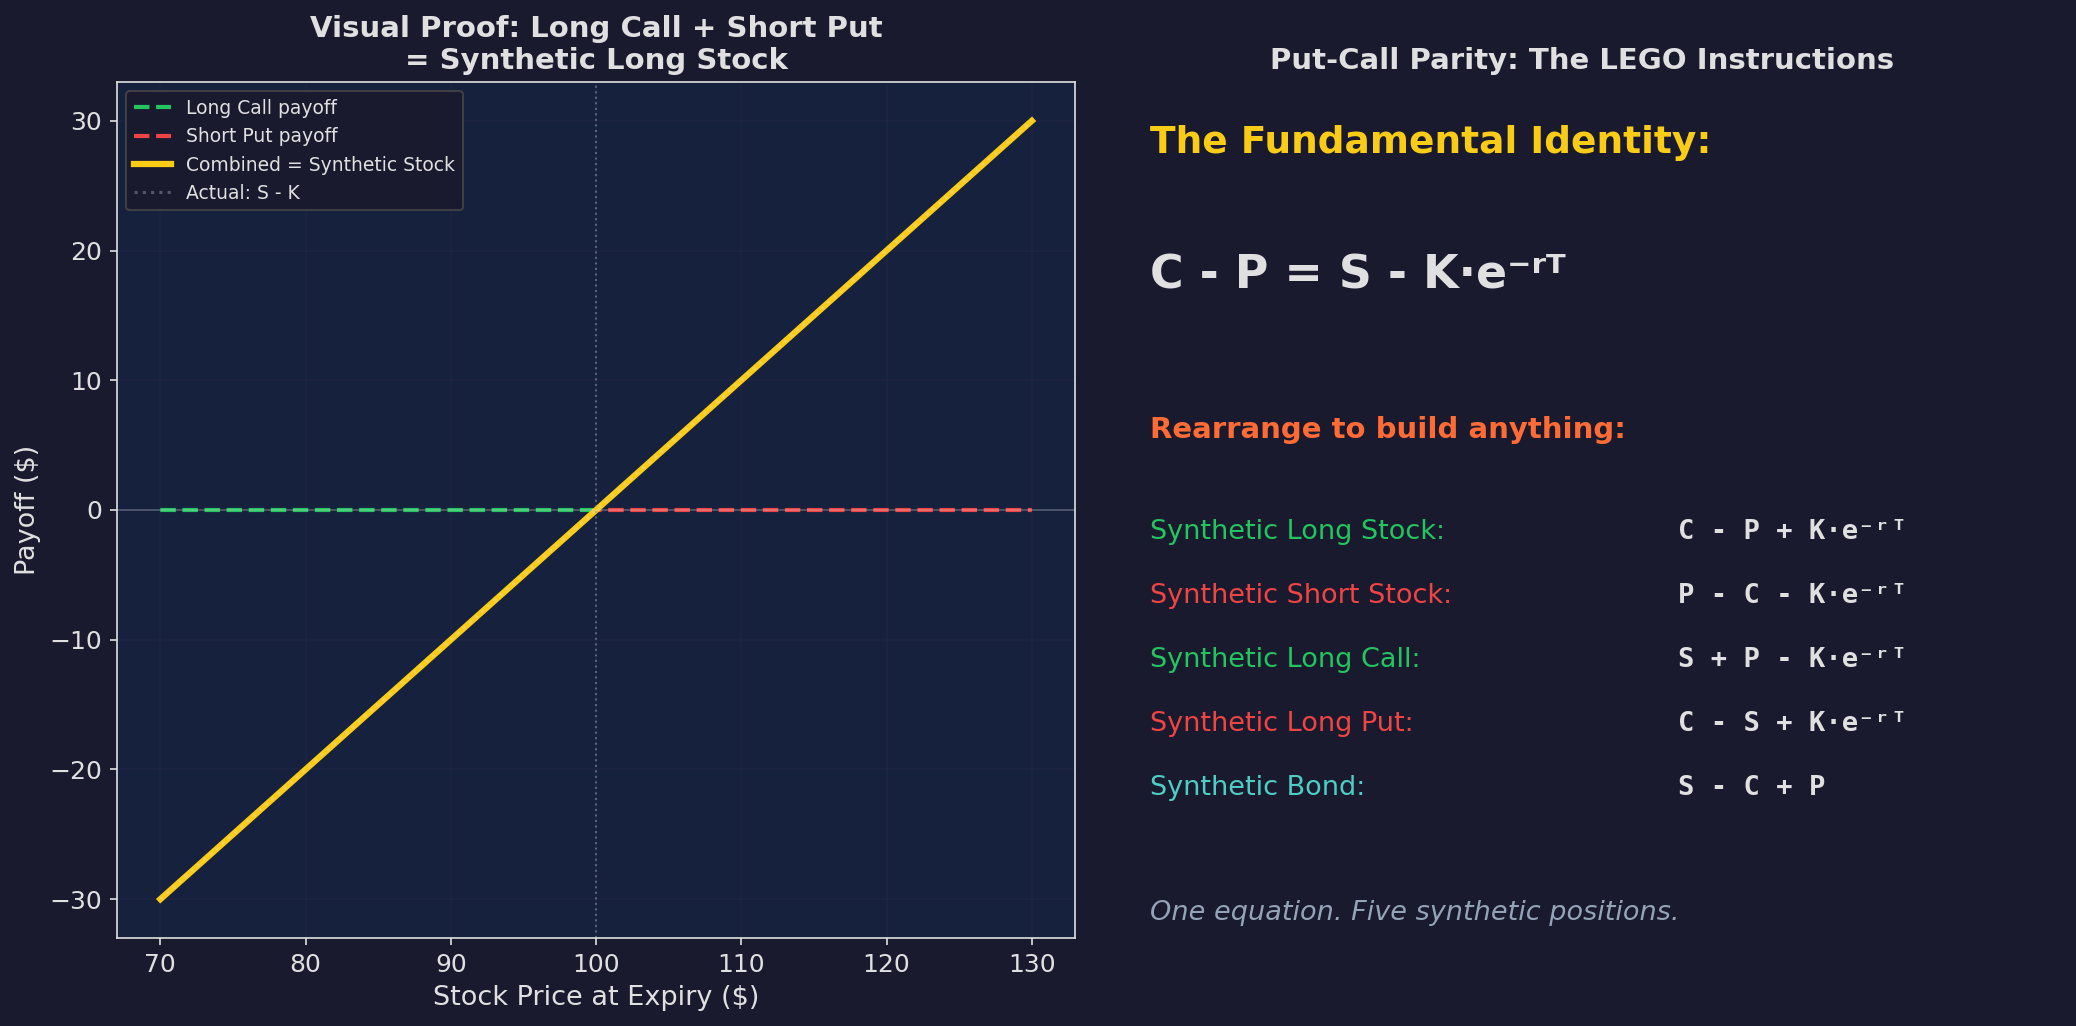
Left: visual proof. The green dashed line (long call payoff) plus the red dashed line (short put payoff) equals the yellow solid line — which is exactly the payoff of owning the stock. Right: rearrange the equation to build five synthetic positions from the same identity.
Why This Matters
Put-call parity isn’t just an academic identity. It’s a construction manual. Rearranging one equation gives you five synthetic positions:
Synthetic Long Stock = Long Call + Short Put + Cash
You don’t need to buy stock. Buy the call, sell the put at the same strike, set aside the present value of the strike in cash. At expiry, you’ll have exactly the same P&L as owning the stock. Why would you do this? Capital efficiency — the options might require less capital than buying the stock outright.
Synthetic Long Call = Long Stock + Long Put
If you own the stock and buy a put, you’ve created a call option. This is the “protective put” — but reframed as building a call from its components. Conceptually, a protective put isn’t “buying insurance on your stock” — it’s “building a synthetic call option.”
Synthetic Bond = Long Stock + Long Put + Short Call
The “conversion” — you hold the stock, buy a put, and sell a call at the same strike. Your payoff is completely flat: the stock gains are capped by the short call, and losses are floored by the long put. The result is a risk-free position that earns the risk-free rate. You’ve synthesized a Treasury bond from options and stock.
The Six Essential Synthetics
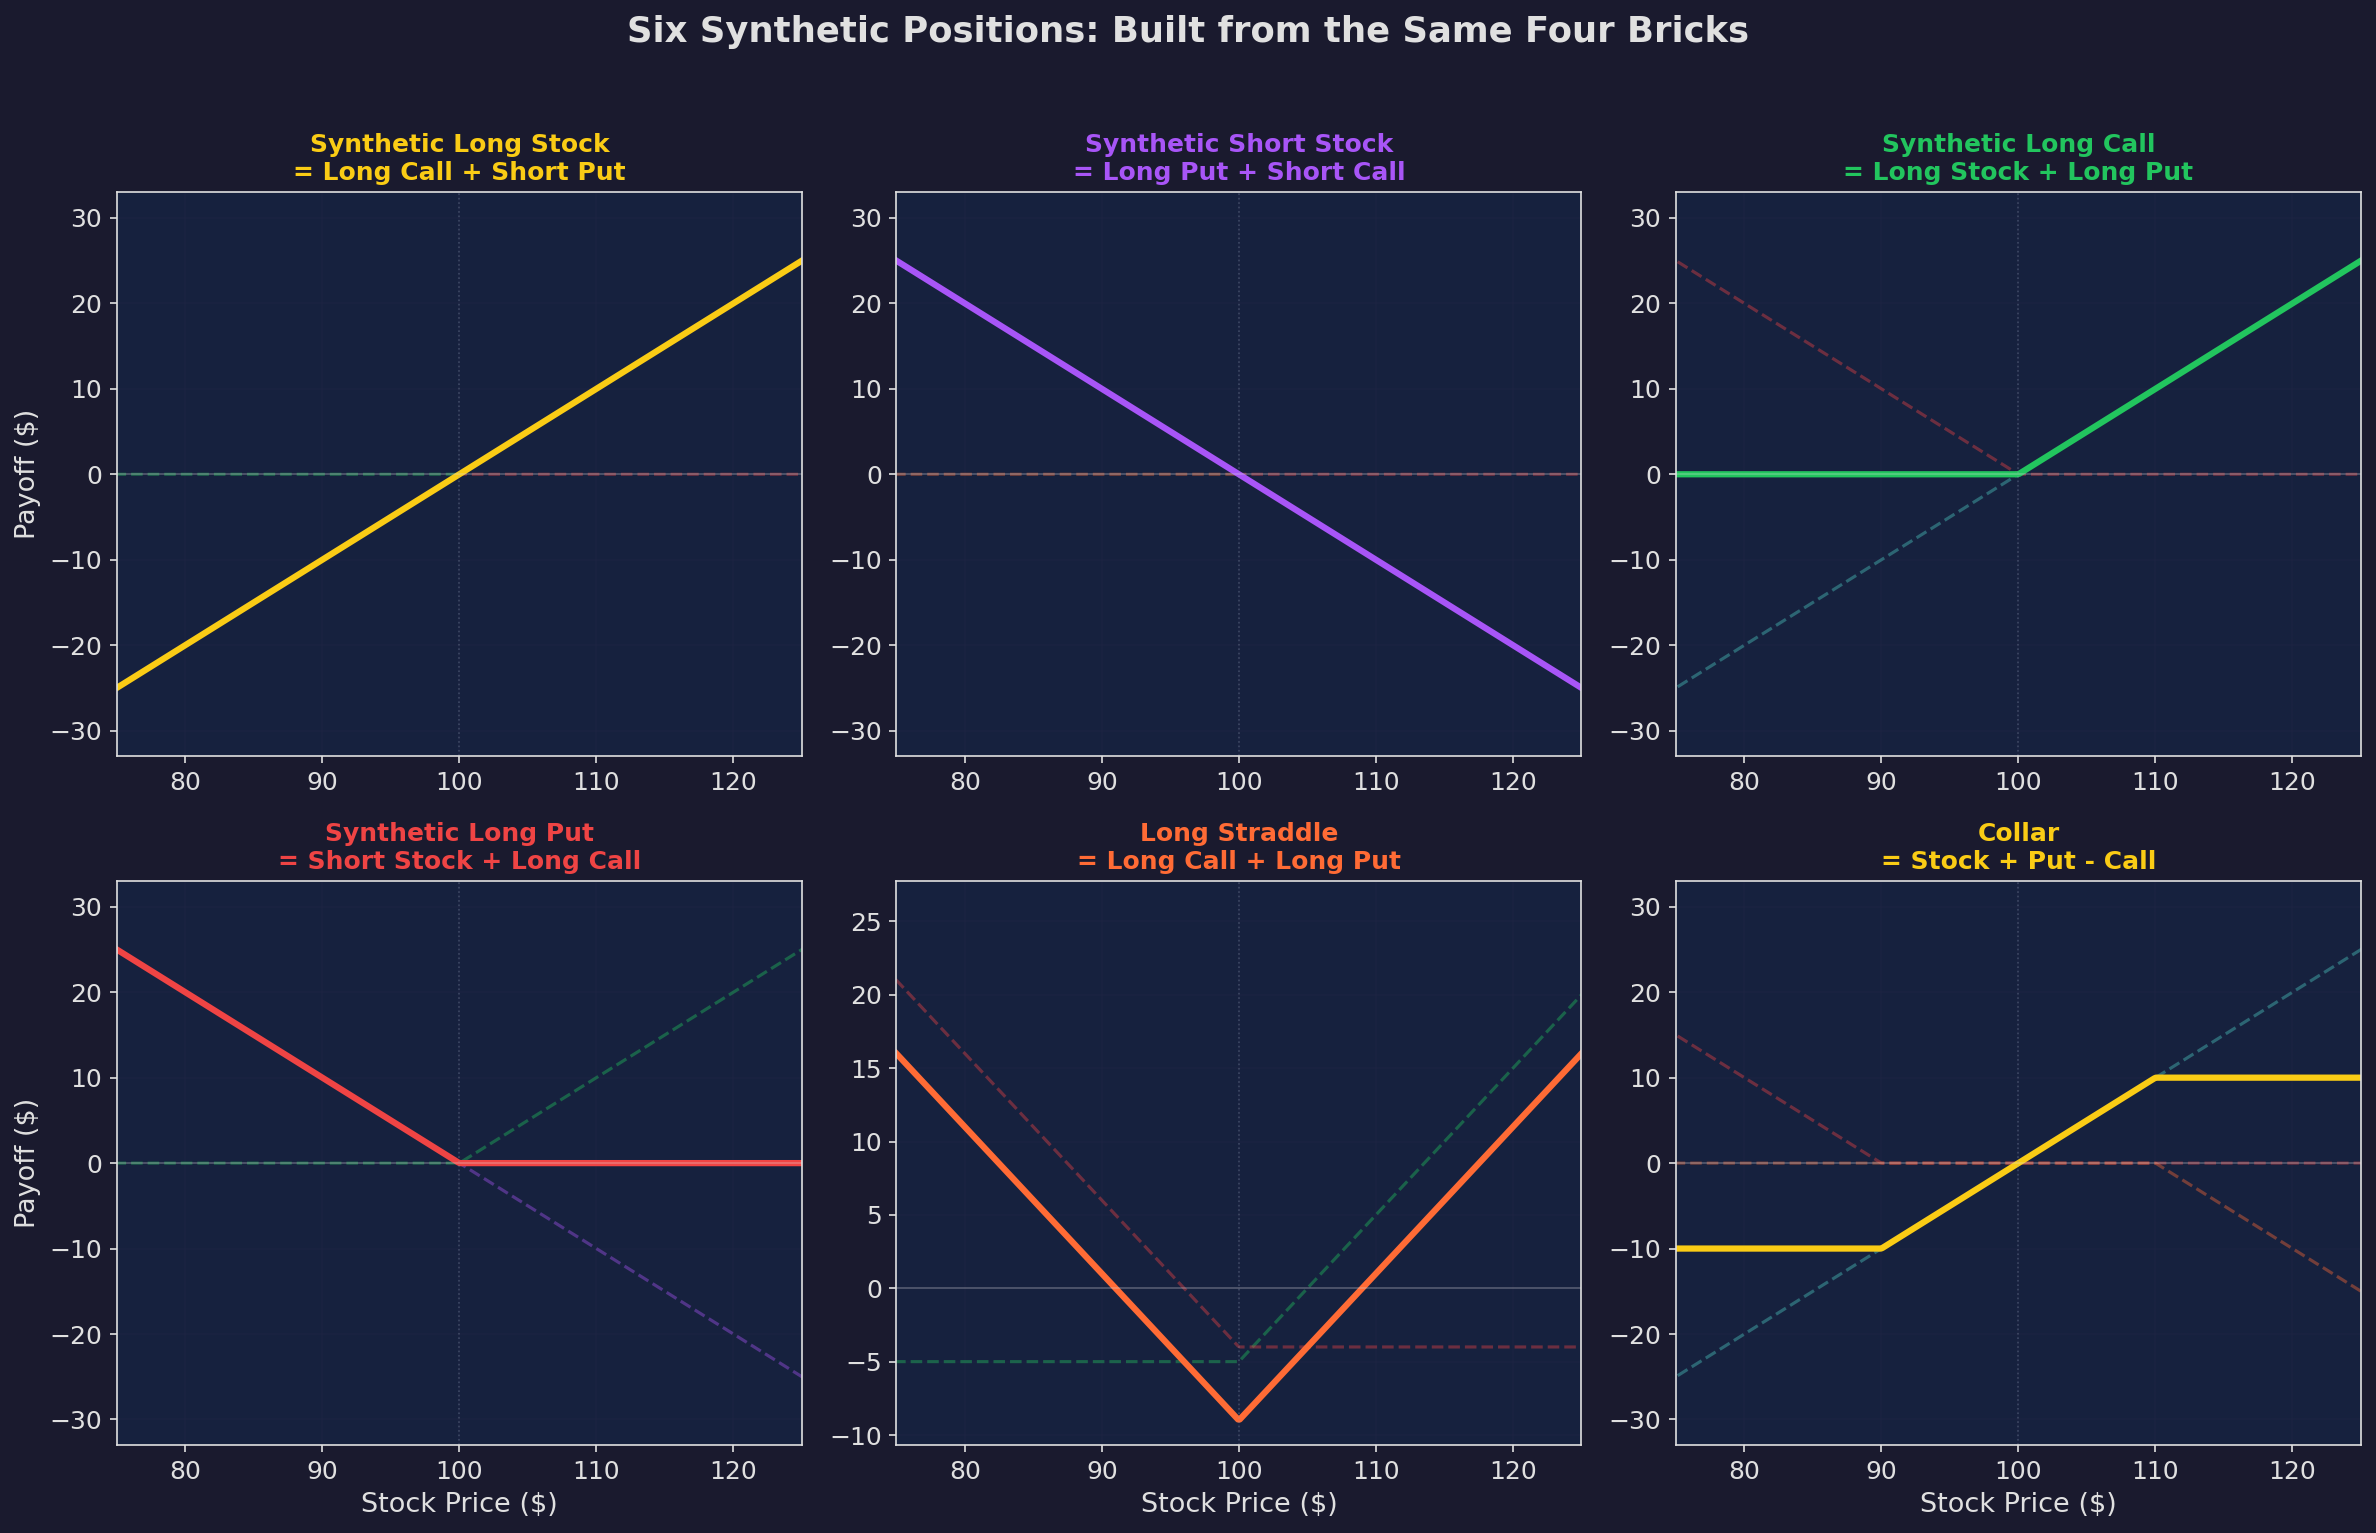
Six positions built from the four building blocks. Each panel shows the component payoffs (dashed) and the resulting combined payoff (solid). Top row: synthetic long stock, synthetic short stock, synthetic call. Bottom row: synthetic put, long straddle, collar. The dashed lines always add up to the solid line — that’s the construction at work.
The straddle and collar are particularly important for what comes in Parts 2-4:
The straddle (long call + long put, same strike) creates a V-shaped payoff that profits from movement in either direction. You’re buying volatility. You don’t care which way the stock moves — you just need it to move more than the combined premium you paid.
The collar (stock + long OTM put + short OTM call) clips both tails of the stock’s return distribution. You give up upside beyond the call strike and gain protection below the put strike. If the premiums offset, it’s “free” — you’ve reshaped your risk without paying cash.
Why Capital Efficiency Matters
The practical motivation for synthetic positions: you can get the same directional exposure with dramatically different capital requirements.
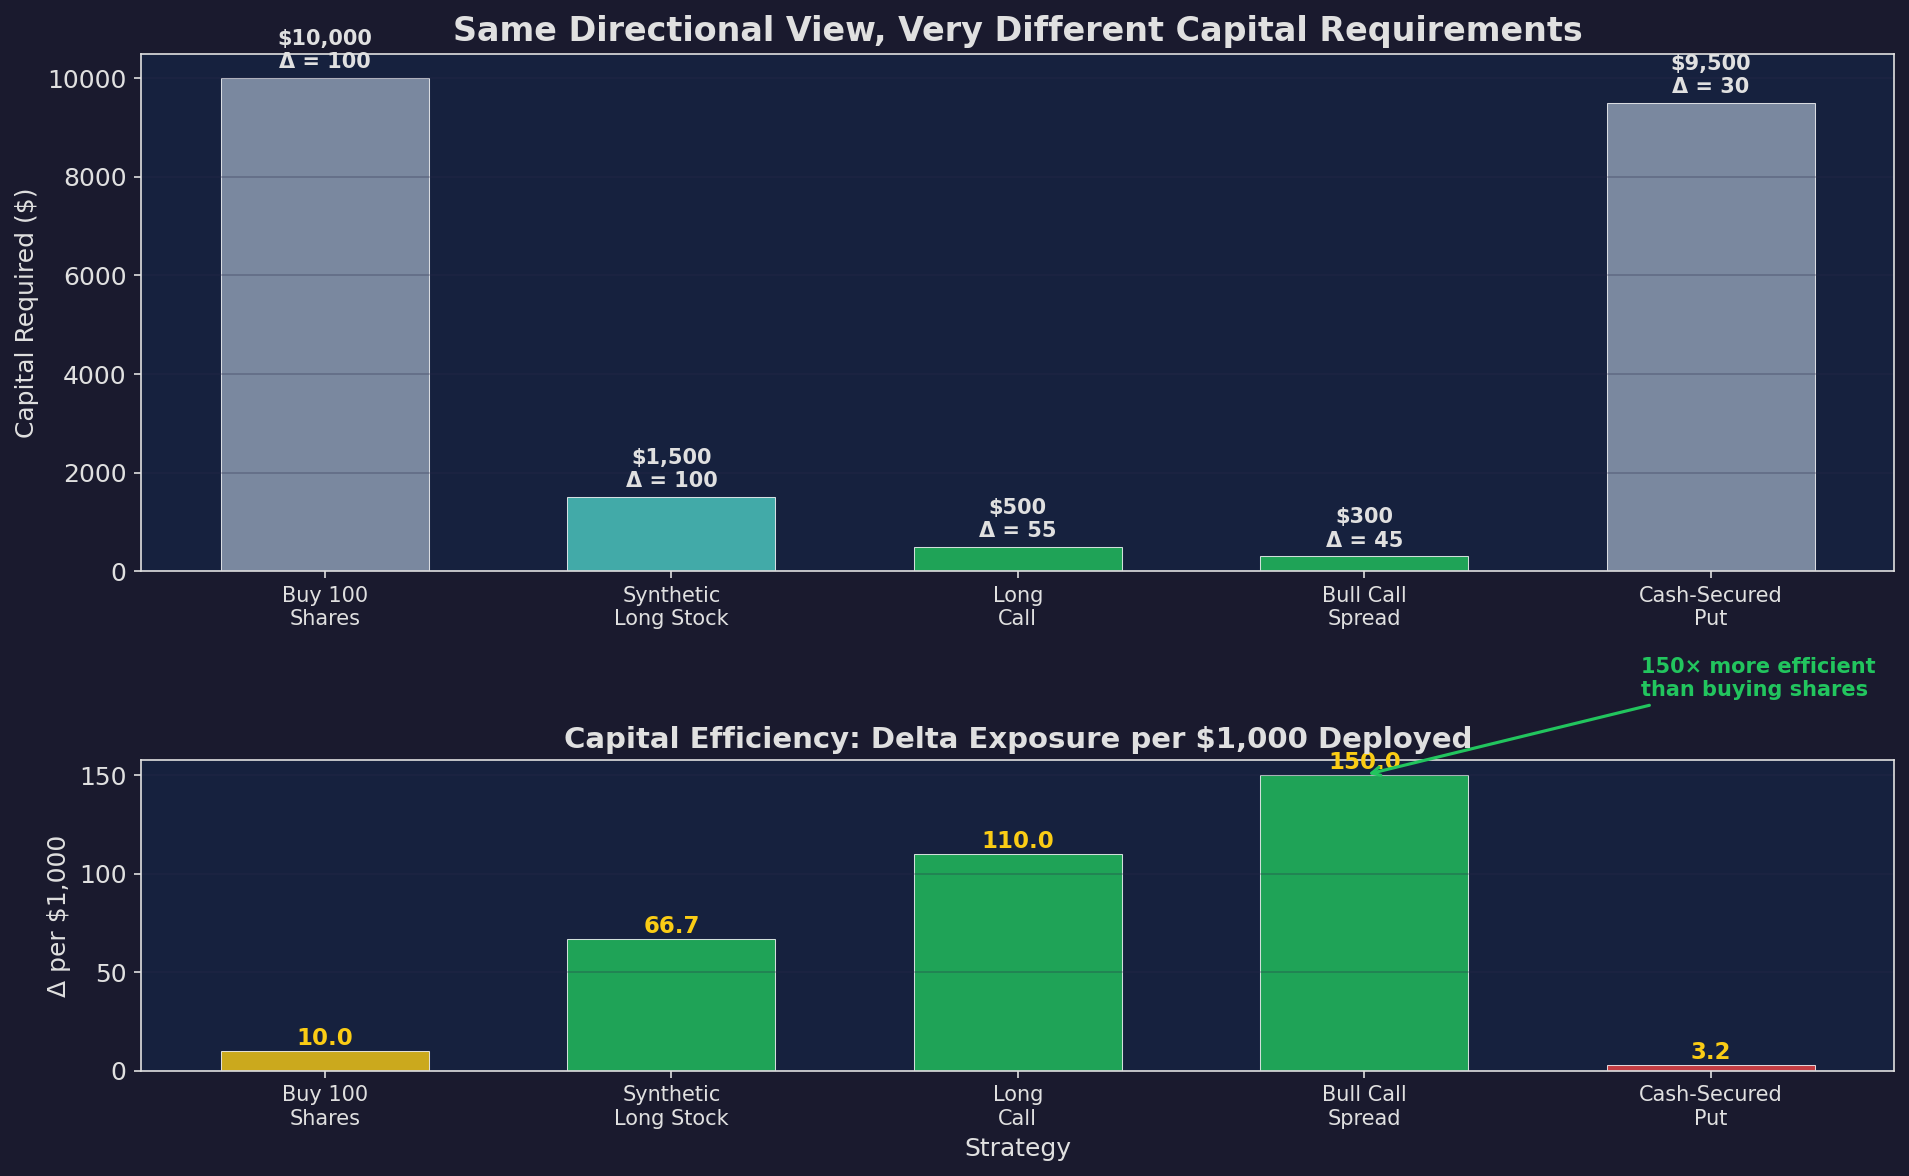
Five ways to get bullish exposure to a $100 stock. Buying 100 shares costs $10,000 for 100 deltas of exposure (1.0 delta per $100). A synthetic long costs $1,500. A long call costs $500 for 55 deltas. A bull call spread costs $300 for 45 deltas. The capital efficiency ranges from 1.0 to 15.0 deltas per $1,000 deployed.
This efficiency has a cost: defined expiry. Stock doesn’t expire; options do. But for a strategy like V6 that rebalances regularly, the expiry constraint is manageable — you’d roll the position quarterly.
When Parity Breaks: Arbitrage Signals
Put-call parity should hold exactly. When it doesn’t, someone is making a mistake — and someone else can profit.
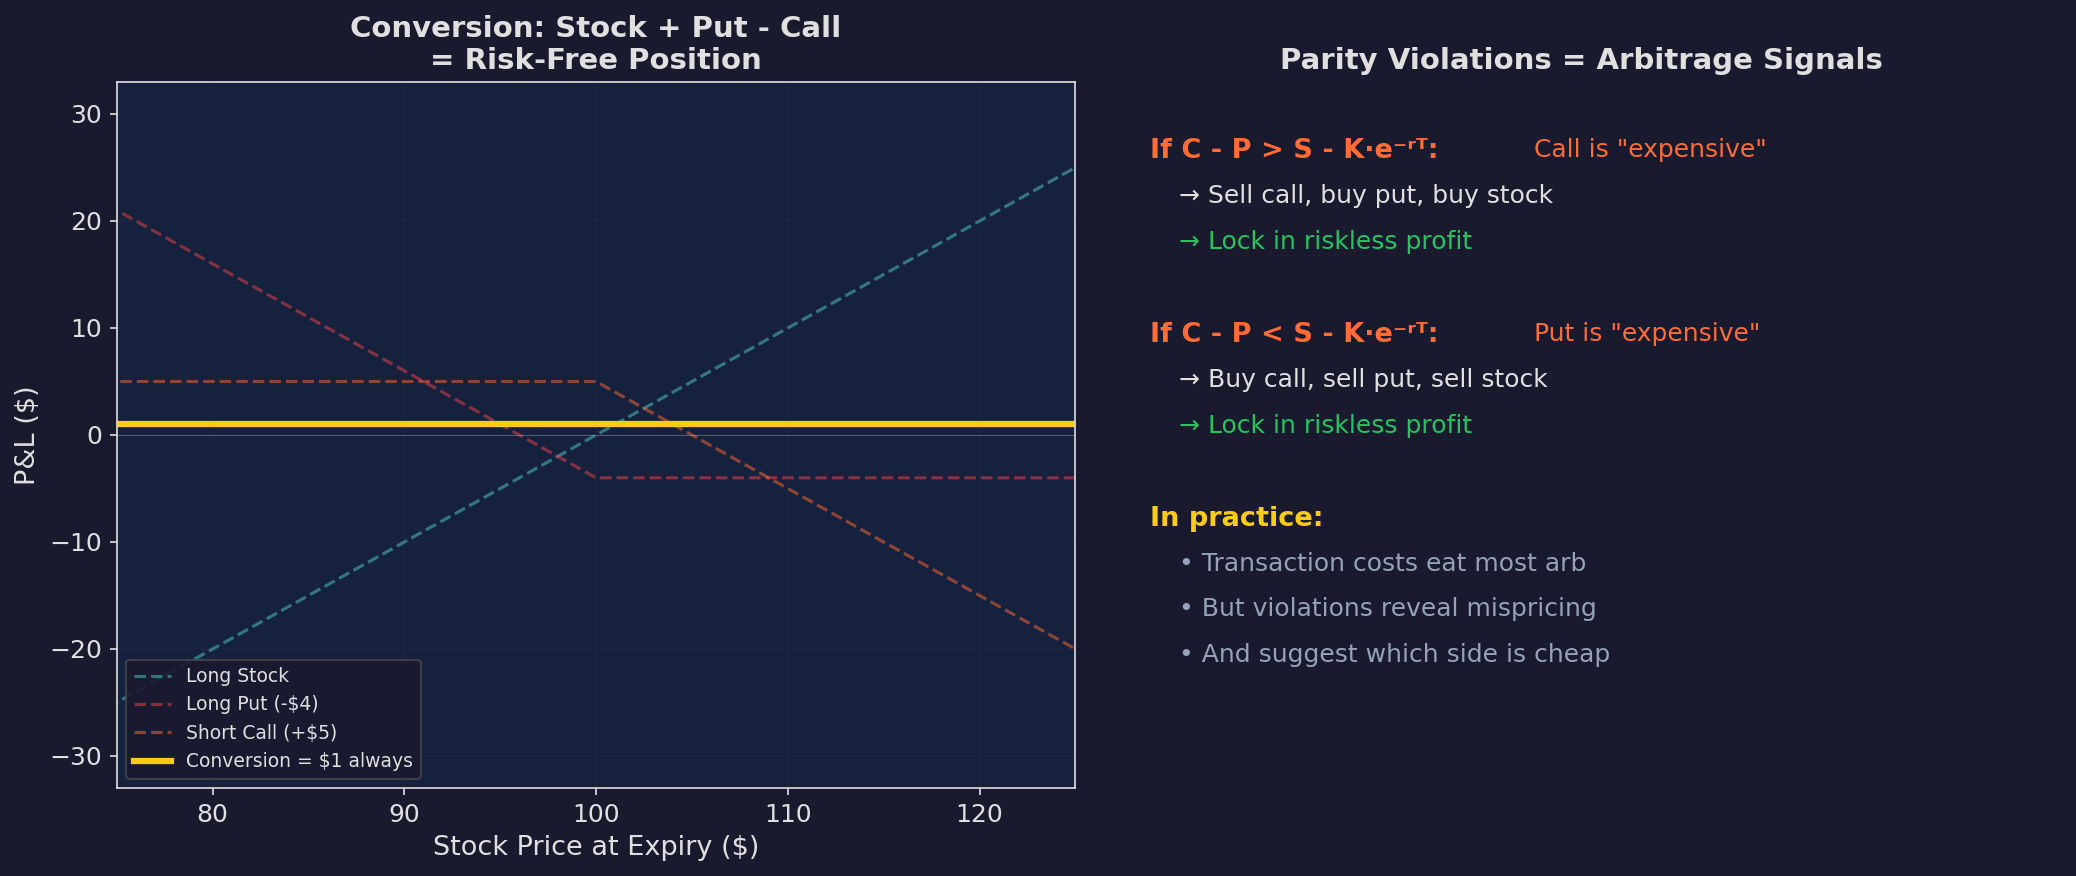
Left: the conversion — stock + put - call produces a flat payoff (risk-free). If the flat payoff exceeds the risk-free rate, you’ve found free money. Right: what parity violations tell you about mispricing.
In practice, transaction costs eat most of the arbitrage. But the direction of the violation tells you something useful:
If calls are expensive relative to parity → implied vol on calls is elevated → the market is pricing more upside risk than the put side.
If puts are expensive relative to parity → implied vol on puts is elevated → the market is pricing more downside risk (skew is steep).
This links directly to the vol surface discussion in Part 3.
The Replication Menu
Here’s where this series is going. Every strategy in the next three posts uses the same four building blocks:
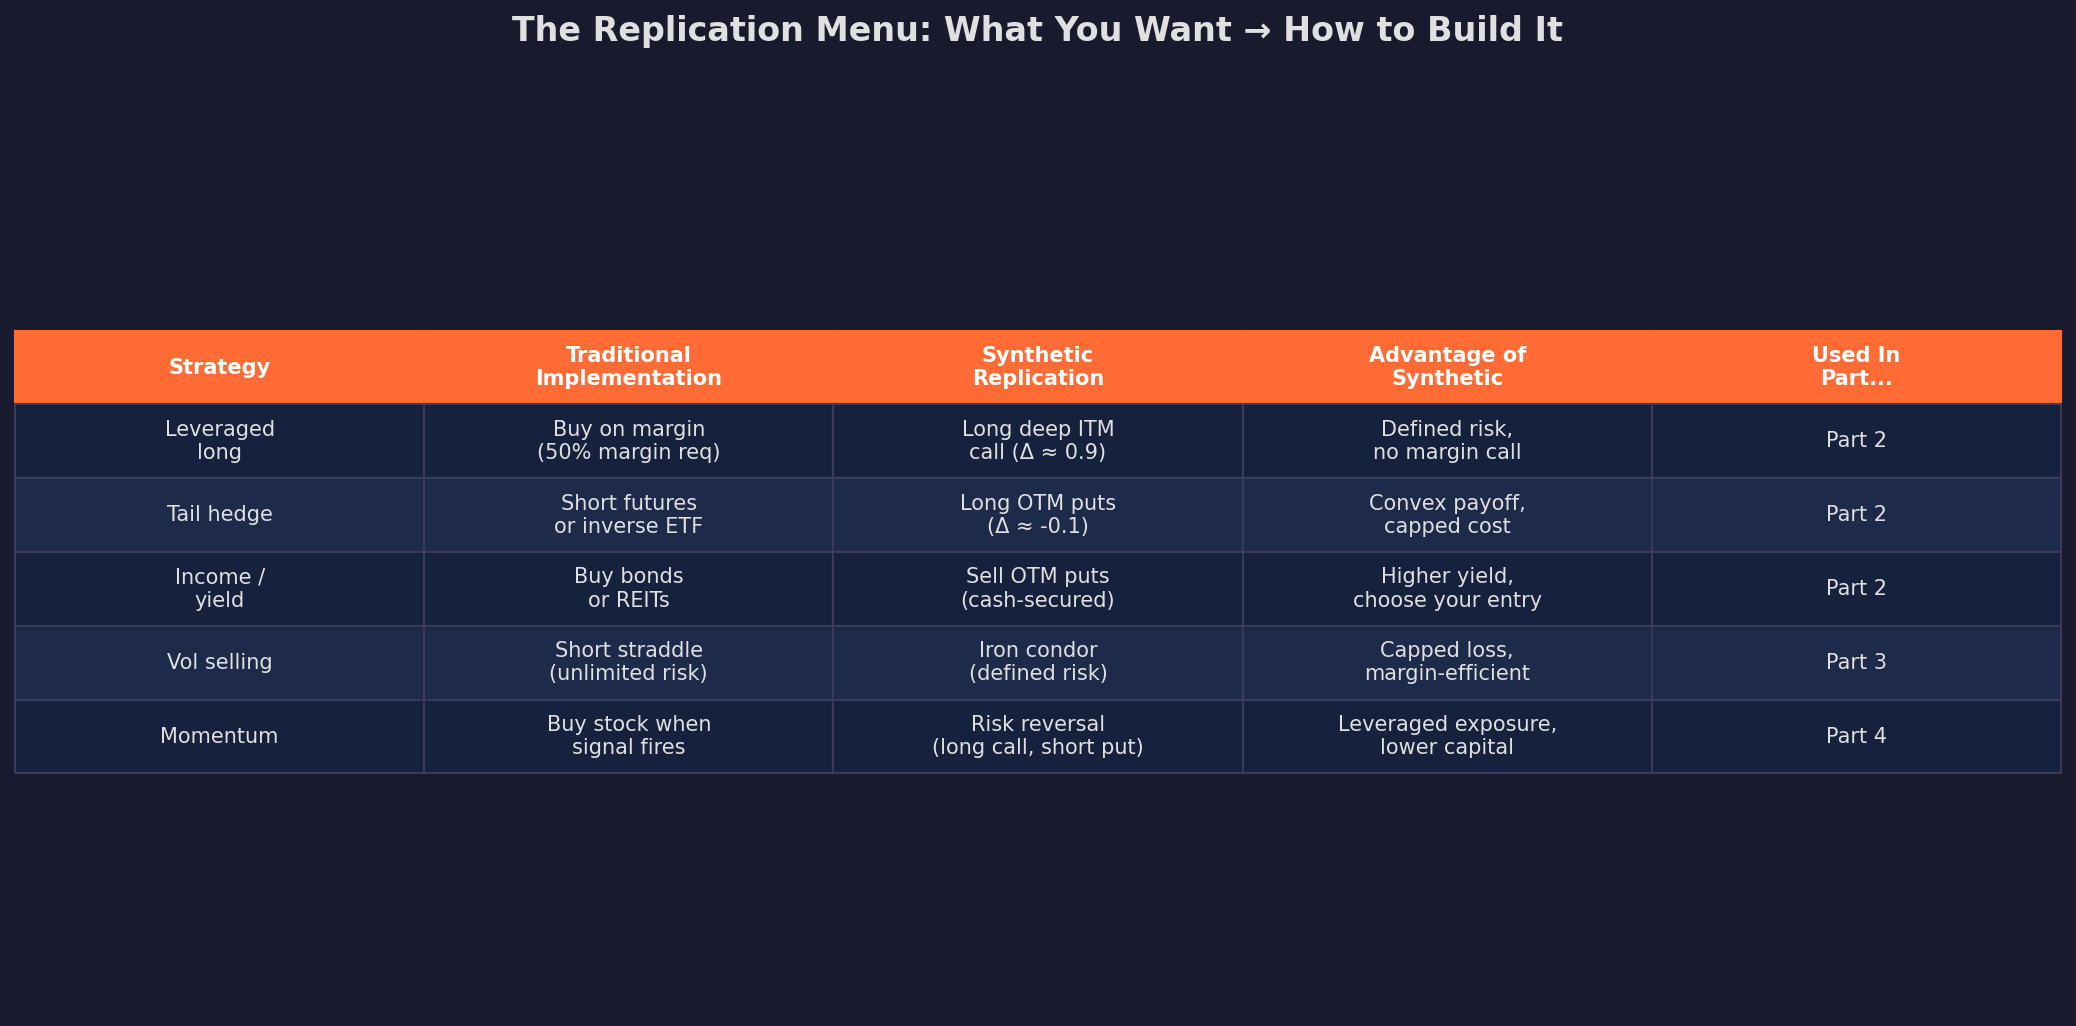
The replication principle: any payoff you want can be constructed from options. The question isn’t “which named strategy should I use?” — it’s “what payoff shape do I want, and how do I build it?”
Payoff Engineering: Design, Then Build
This is the mindset shift. Instead of asking “should I buy a covered call?” ask “what do I want my P&L to look like?”
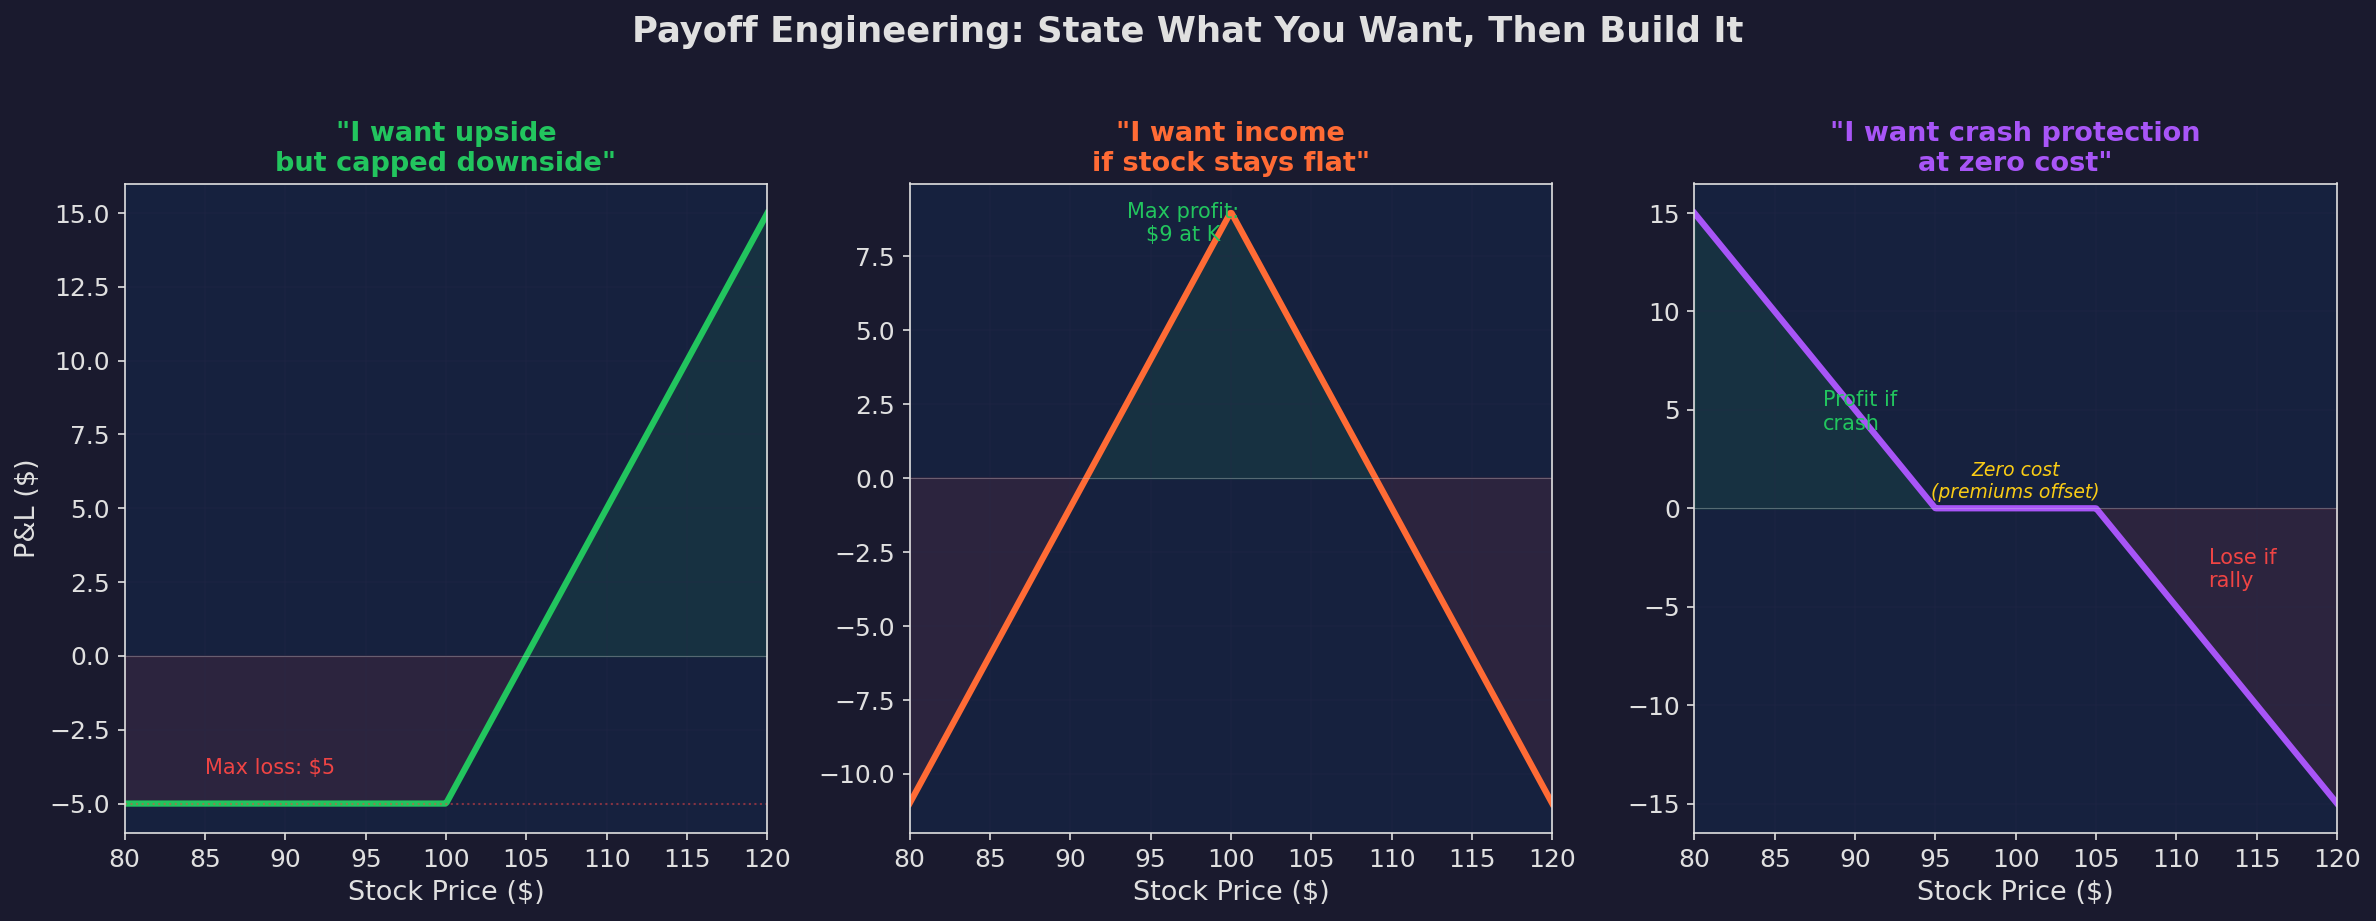
Three investor goals, three custom payoffs. Left: “I want upside with capped downside” → long call (max loss = premium). Center: “I want income if the stock stays flat” → short straddle (profit in the center, loss in the tails). Right: “I want crash protection at zero cost” → risk reversal (sell upside call to fund downside put).
Each of these payoffs is a direct expression of a view:
The long call says: “I’m bullish and want defined risk.” The short straddle says: “I think realized vol will be lower than implied vol.” The risk reversal says: “I’d rather have crash protection than participate in a rally.”
The same framework applies to V6. In Part 4, we’ll ask: “What payoff shape would improve V6’s risk/return profile?” — and then build it from the bricks.
What’s Next
If you’re comfortable with payoff diagrams and put-call parity, you have everything you need for the next three posts:
Part 2 will use these bricks to replicate hedge fund strategies — risk reversals as synthetic momentum, covered calls as systematic vol selling, collars as tail hedging.
Part 3 goes deeper into the vol surface — when the implied vol at different strikes and expirations is “wrong,” how to express a view on skew, term structure, or convexity.
Part 4 brings it home to V6 — designing a specific options overlay that improves V6’s Sharpe by adding convexity in the tails.
Remember: Alpha is never guaranteed. And the backtest is a liar until proven otherwise.
These posts are about methodology, not recommendations. If you find errors in my math, let me know — I’ve built an entire series around discovering my own mistakes, so one more won’t hurt.
The material presented in Math & Markets is for informational purposes only. It does not constitute investment or financial advice.