
The Correction: Does Crypto Predict the VIX? Yes — But Not Profitably
This is a correction of my previous post

Two days ago I argued that overnight crypto returns predict next-day VIX moves with a tradable Sharpe of 2.36 net of costs. Two readers, Eric and Per, reader pulled the thread and the whole thing came apart.
What the readers caught
The original backtester used Yahoo’s daily crypto bars to construct an “overnight” crypto return:
crypto_overnight_d = ln( Close_d / Close_(d-1) )The problem: Yahoo’s daily crypto bar closes at 00:00 UTC, which is roughly 20:00 ET on the same calendar day. So Close_d is recorded after the VIX trading session of day d has already ended. The “overnight” variable I was using to predict the VIX trading-hour return contained the VIX trading-hour move itself.
That is the textbook definition of lookahead bias. It is exactly the kind of thing that turns a ~0.5 Sharpe signal into a ~2.4 Sharpe phantom.
I confirmed it directly. Once you align the “overnight” bar one day forward — so it is genuinely information available before the NY open — the same-day correlation of the proxy with the VIX trading return collapses from −0.24 to +0.001. The signal as I had it was almost entirely the contamination.
It sucks. But I’m grateful to Eric and Per because understanding and fixing the mistakes in the strategies we discuss is what makes M&M better!
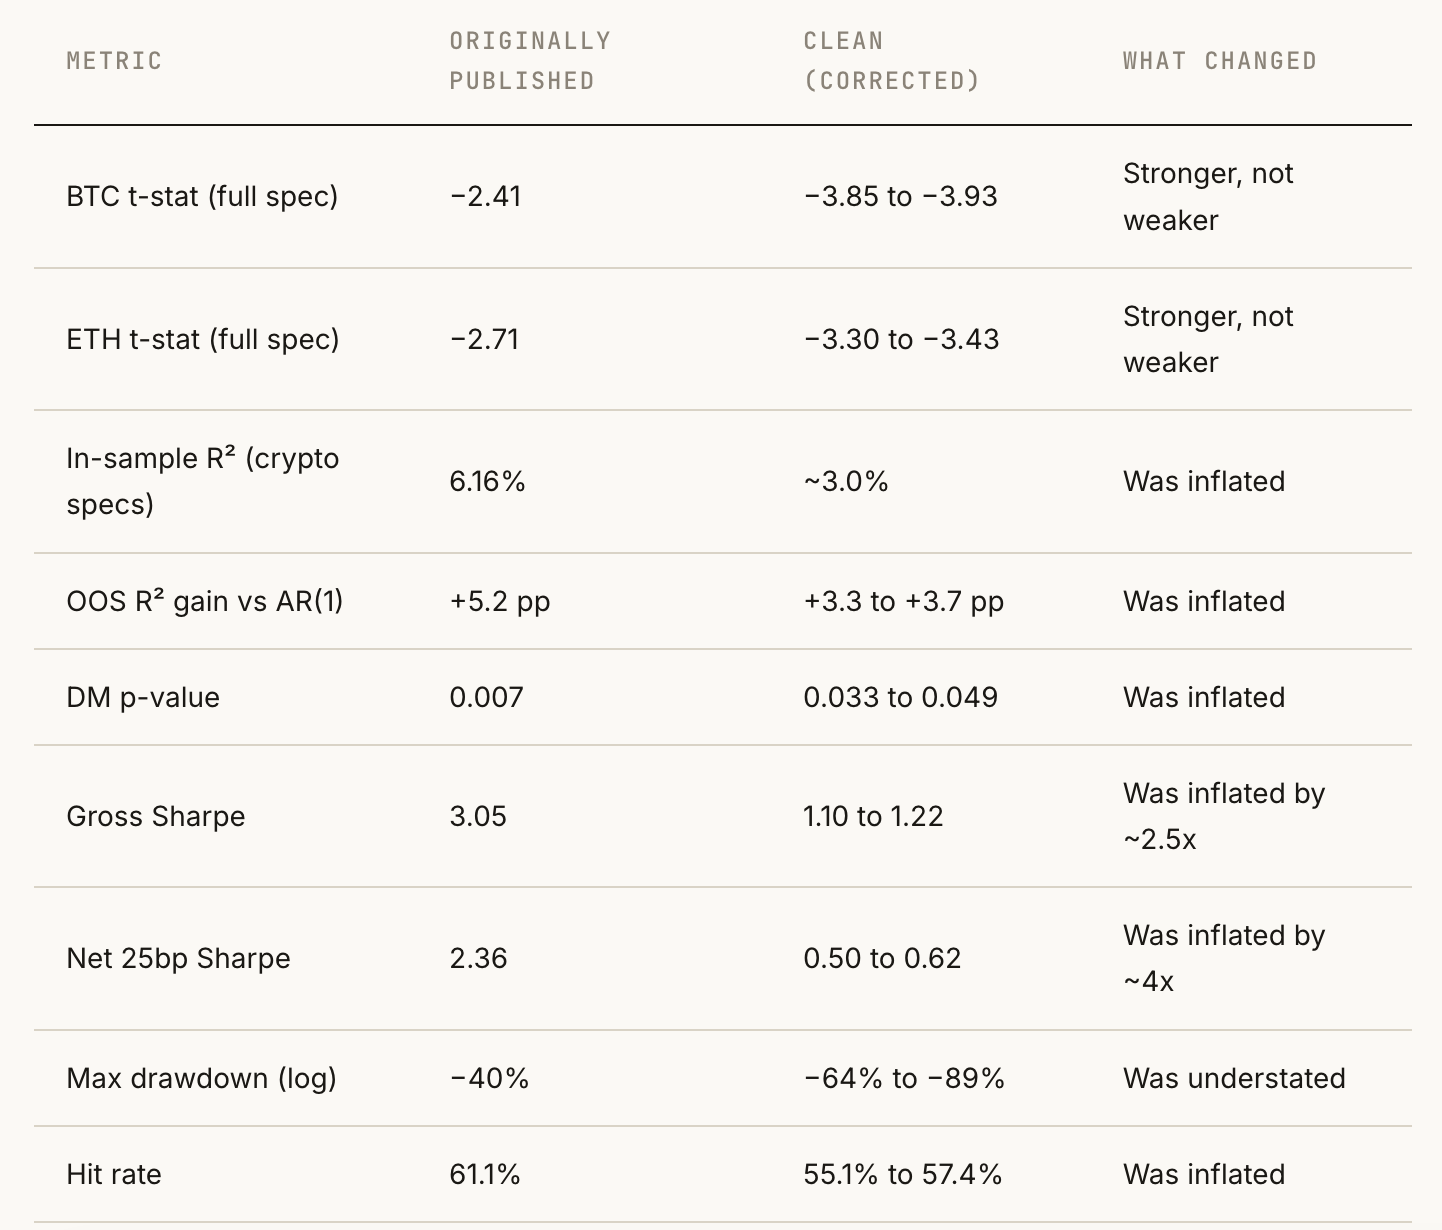
Original numbers vs corrected numbers
Step 1: Rebuild the data, three ways
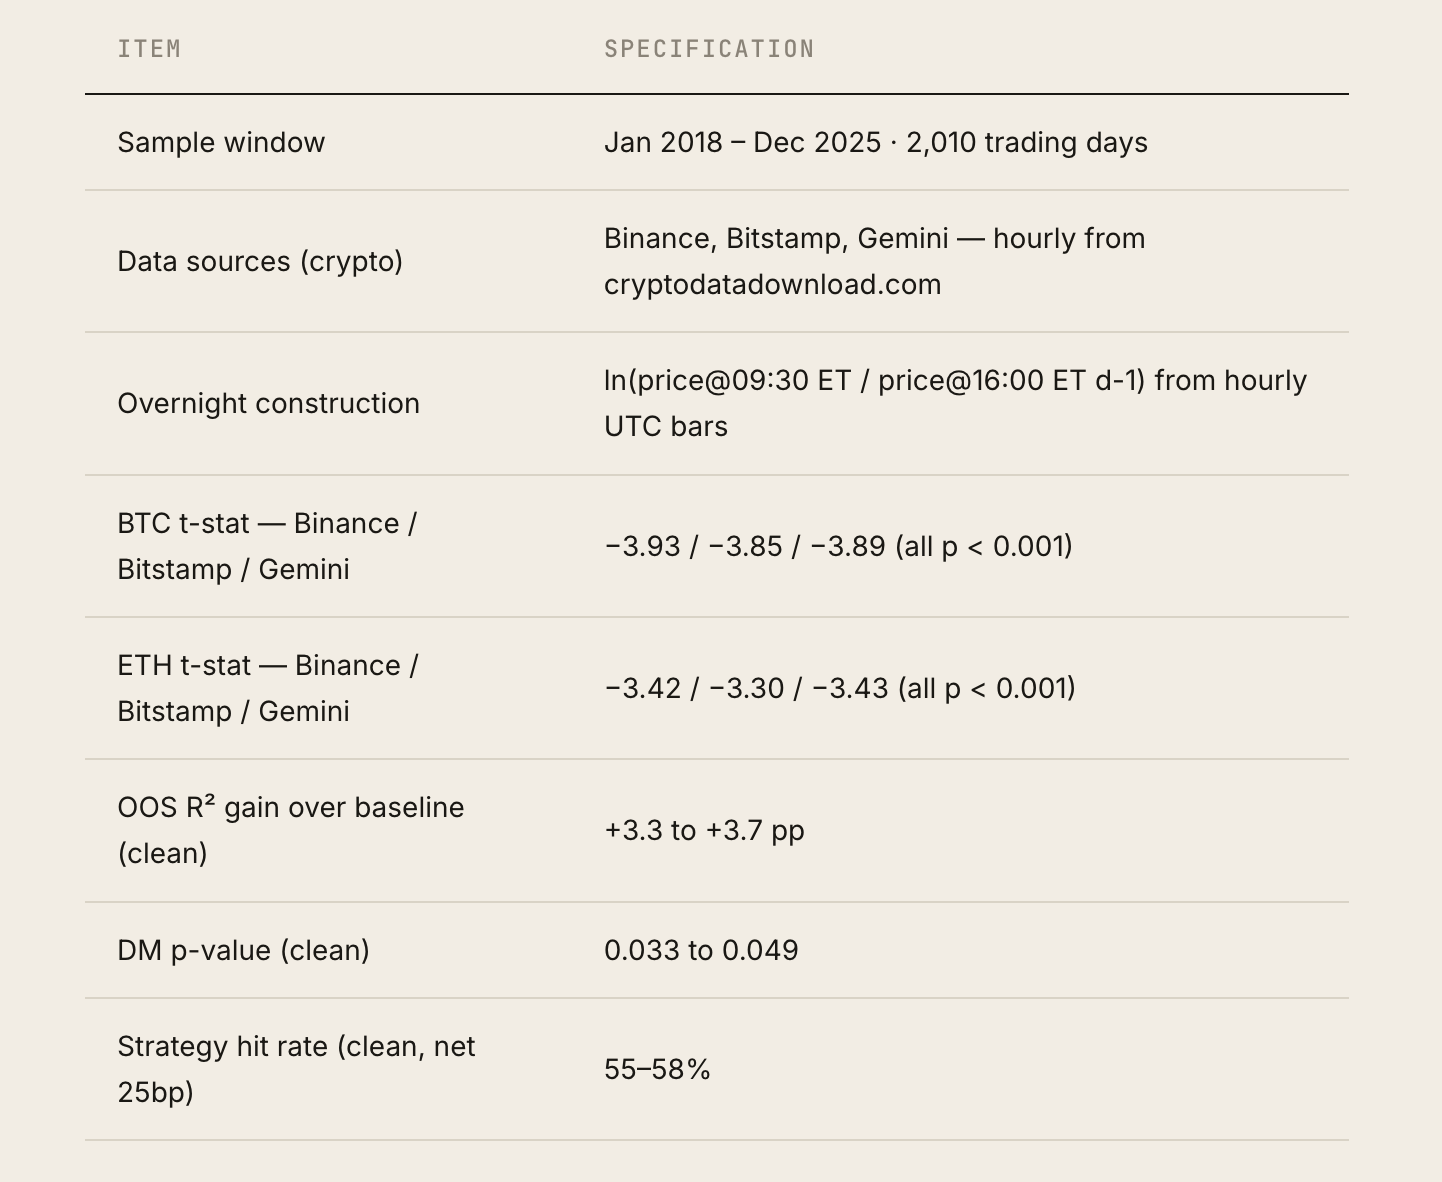
I scrapped Yahoo for crypto and rebuilt the dataset from cryptodatadownload.com, pulling hourly BTC and ETH bars from three exchanges that don’t share an order book: Binance (USDT pairs, Aug 2017–present), Bitstamp (USD pairs, May 2018–present), and Gemini (USD pairs, Oct 2015–present).
Three exchanges is overkill for the headline number, but it answers the obvious second question: is the signal a Binance artifact, or is it really there? The clean overnight return is now constructed from hourly bars at the exact NYSE-relevant times:
crypto_overnight_d = ln( price@09:30 ET on d / price@16:00 ET on d-1 )NYSE sessions come from pandas_market_calendars. Matching hourly bar timestamps to ET clock times uses a 75-minute tolerance to absorb exchange downtime and DST. Sample: 2018-01-02 to 2025-12-30, 2,010 NYSE trading days.
Headline regression — clean, three exchanges
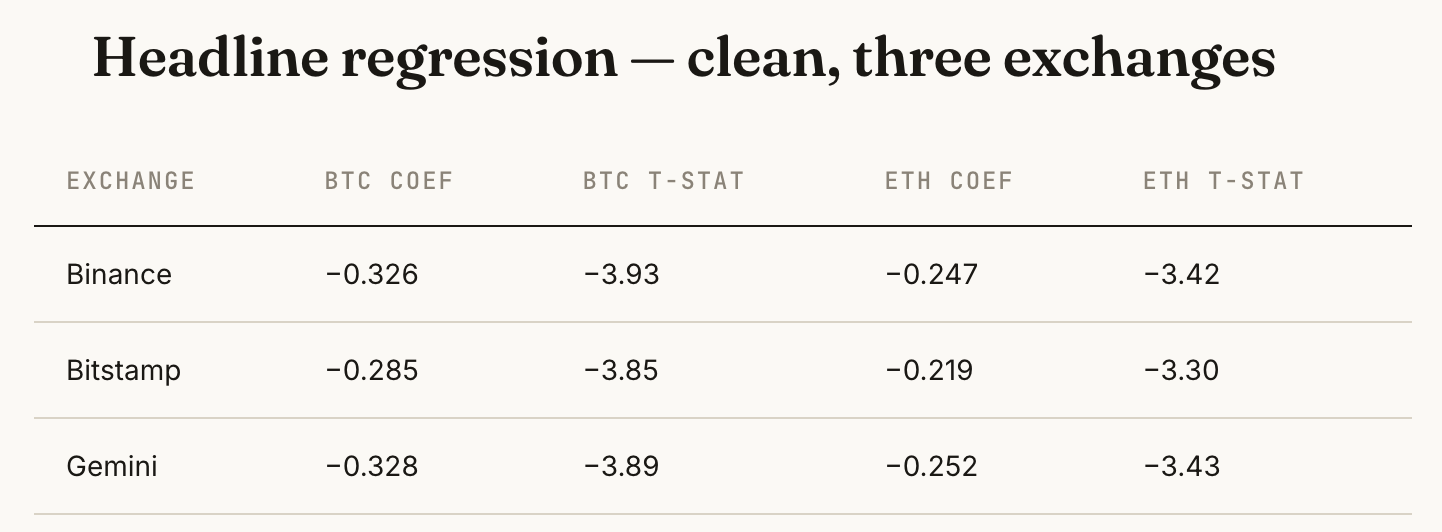
All BTC t-stats clear |t|>3.8. All ETH t-stats clear |t|>3.3. Standard errors are HAC (Newey-West) with 5 lags. The signal is real, robust across exchanges with no shared price source, and more statistically significant on clean data than it was on contaminated data. In-sample R² is roughly 3.0% for the crypto-only specifications, versus the 6.16% I originally reported. The original number was inflated; the sign and significance were not.
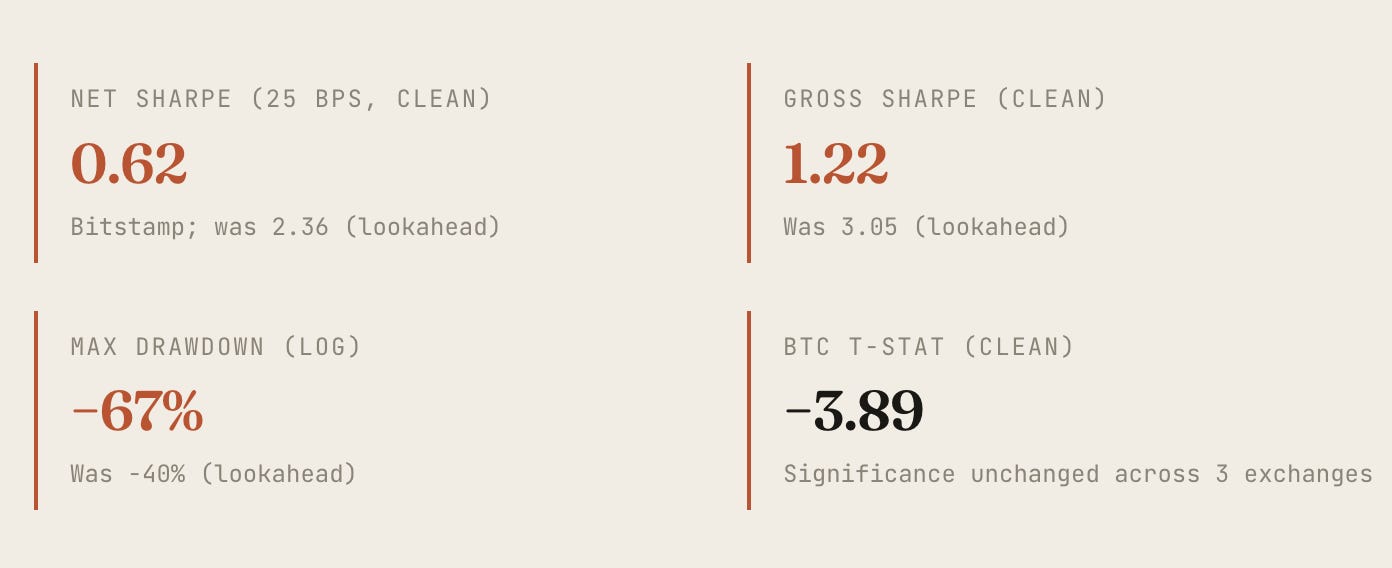
Strategy — VIXY long/short, 25bp round-trip cost
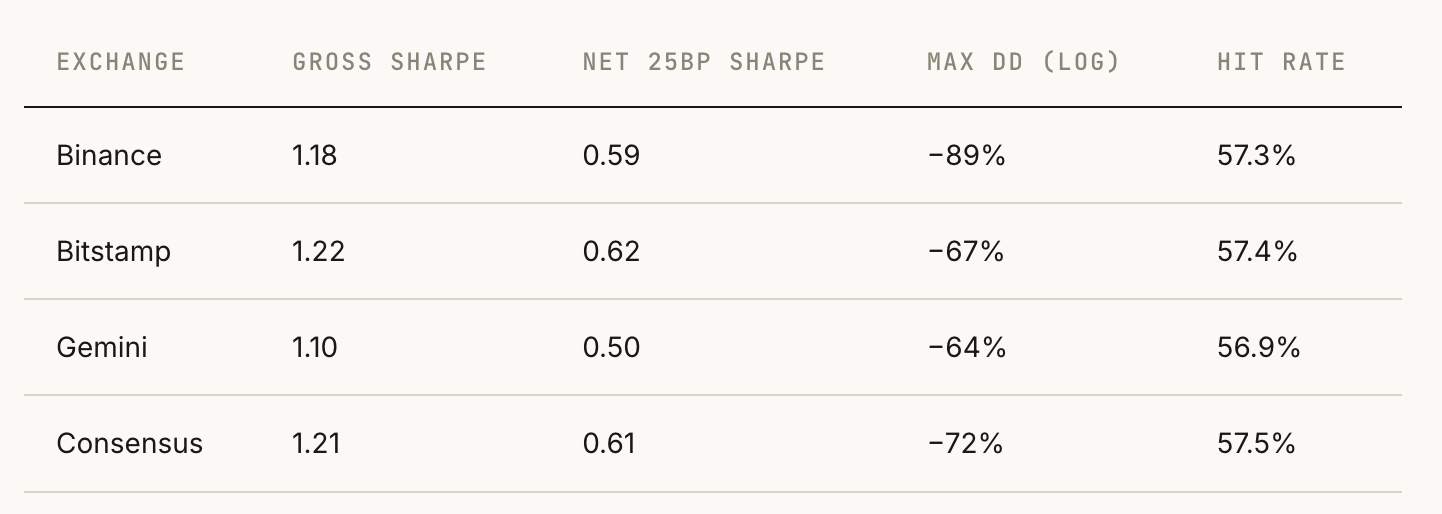
This is the corrected verdict, and it is much, much weaker than the headline I originally published. Gross Sharpe of ~1.2 looks fine. Net of realistic round-trip costs of 25 bps, Sharpe drops to ~0.6, drawdowns exceed 60%, and a 57% hit rate is well short of what would justify the position swings the strategy demands. This is not a tradable standalone strategy — it is a research finding about predictability, not a P&L engine.

Step 2: Can we save it with another variable?
Once the clean numbers were in, the natural next move was to ask whether the Sharpe could be repaired by adding additional, theoretically-motivated predictors. I picked three from the literature, all strictly available before the NY 09:30 open on each trading day:
Nikkei 225 close-to-close return. NY Fed “Overnight Drift” work documents large Asian-session content in US open vol. Tokyo closes at 01:00 ET — fully pre-NY-open.
Lagged VIX trading-hour return (d-1). Bevilacqua et al, “Breaking VIX at Open” — strong cross-autocorrelation between successive VIX trading-hour moves; VAR specifications dominate AR(1) and HAR.
Log VIX level (d-1). Vol is mean-reverting at horizons ≤ 5 days. Cheap to add.
I deliberately did not test day-of-week dummies (data-mined to death), FOMC-day dummies beyond what’s already in the model (8 events/year overfit OOS), or VVIX (collinear with VIX level).
Extended-model coefficients
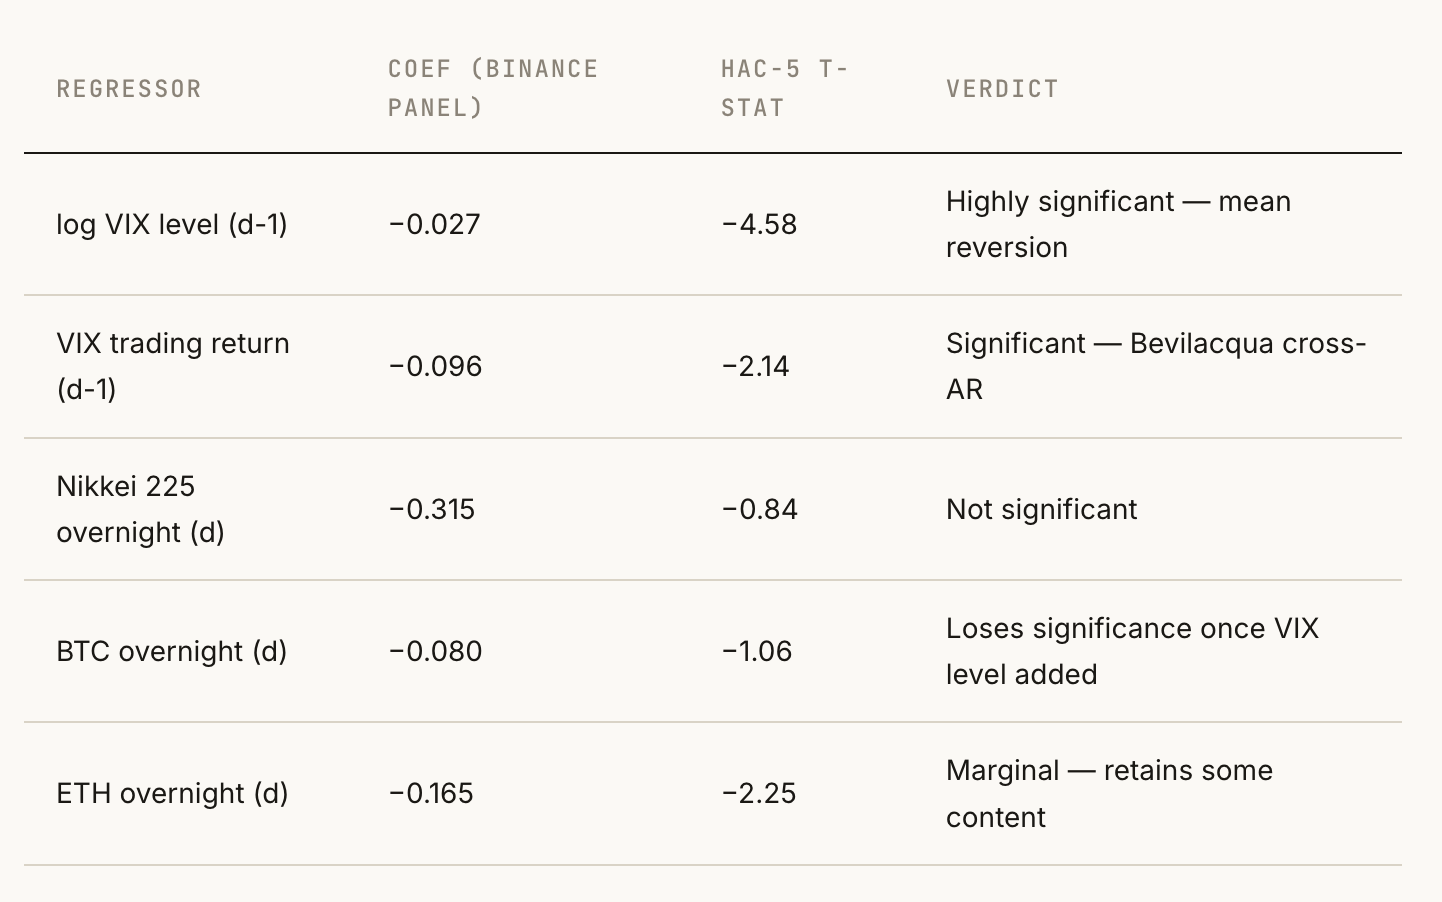

There is a more important and uncomfortable finding here. When we add log VIX level lagged, the BTC overnight coefficients lose significance. BTC t-stats collapse from −3.85/−3.93/−3.89 to roughly −0.6 to −1.1 across the three exchanges. ETH retains marginal significance (t ≈ −2.1 to −2.3).
That’s pretty interesting because it tells me a chunk of what the BTC overnight signal was capturing was VIX mean-reversion — high vol days tend to be days with sharp overnight crypto moves and days where VIX is about to revert. Once you control for the VIX level directly, BTC stops adding much.
Out-of-sample lift

In-sample R² rises from ~3.0% to ~5.5%. Out-of-sample R² rises modestly: from 5.8–6.5% to 6.5–7.5%. But the Diebold-Mariano test comparing clean vs extended yields p-values of 0.46 to 0.78 — i.e., the OOS R² improvement is not statistically significant. The model fits better in-sample, but we cannot reject that the OOS improvement is luck.
And, crucially, what happens to the Sharpe
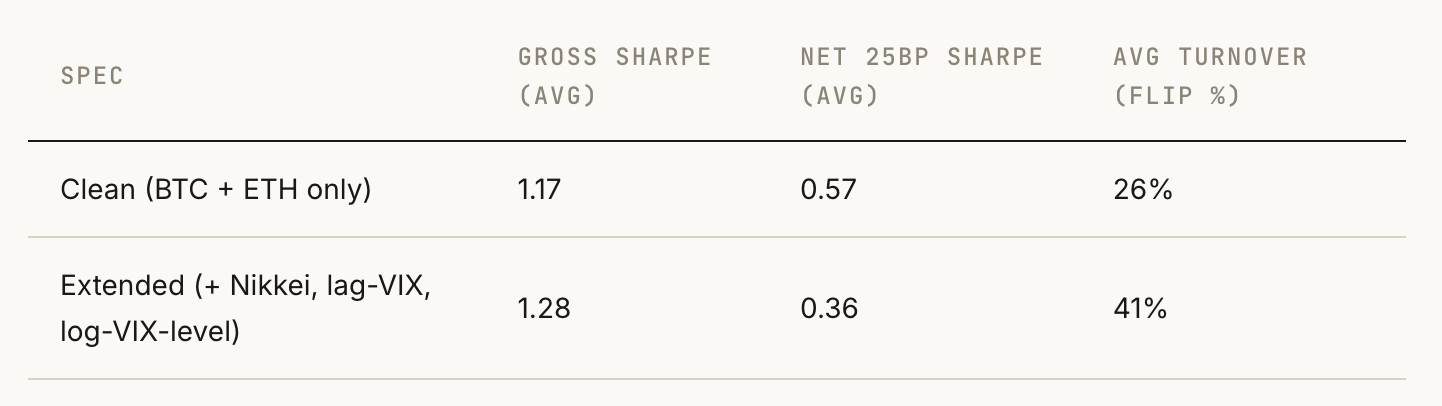


The extended model is more informationally accurate — Spearman IC of forecast vs realized VIXY return rises from 0.071 to 0.091, a ~30% lift. But the extended model flips position roughly 60% more often. Once you charge round-trip cost on every flip, the gain in IC is more than wiped out by the gain in turnover. The two lines cross at about 4 bps — i.e., the extended model is only better than the clean model in a friction-free world that doesn’t exist.
What I actually learned
The headline Sharpe of 2.36 was a bug. The real Sharpe net of 25bp costs is about 0.5–0.6 on clean, cross-validated data.
The crypto → VIX signal is real but weak. It is statistically significant on three independent exchanges, contributes ~3.3pp of OOS R², but does not, on its own, support a tradable strategy at realistic costs.
Most of the BTC signal seems to be a proxy for VIX mean-reversion. Once you include the lagged VIX level, BTC coefficients lose significance. ETH retains marginal significance.
Adding three theoretically-motivated predictors improved in-sample fit and information coefficient but reduced net Sharpe because the extended model trades much more. This is one of the cleaner examples of the gap between forecasting accuracy and strategy performance.
Nikkei is not predictive of next-day VIX trading-hour moves, at least once we control for VIX dynamics directly. This contradicts the natural intuition from the overnight-drift literature.
The honest synthesis: the crypto-VIX relationship is best understood as a small piece of the larger fact that volatility is mean-reverting, and crypto markets — being open 24/7 — happen to register that mean-reversion ahead of when the NYSE does. That’s interesting. It’s not a new strategy. It’s a noisier way of betting on something we already know.
What I’m changing on this site
This post replaces the original Sharpe-2.36 post (I’ll still leave the old one up for a minute).
All numbers here reflect the clean values.
Full corrected data and code —
Data bundle with derived panels, model outputs, strategy P&L, and readme.md
I have not included the raw hourly OHLCV bars from Binance/Bitstamp/Gemini — you can download them directly from CryptoDataDownload.com
Method appendix
Crypto data: Hourly BTC and ETH from cryptodatadownload.com (Binance USDT, Bitstamp USD, Gemini USD). All timestamps UTC. Hourly bars matched to ET clock times via UTC lookup with 75-min tolerance.
Reference data: Daily VIX, ES futures, VIXY, and ^N225 from Yahoo Finance. Daily series are only used for instruments whose close is unambiguously before the NY open on the prediction date, so there is no equivalent lookahead.
Target: vix_trading_d = ln(VIX_close_d / VIX_open_d) — the NYSE-session VIX return.
Standard errors: HAC (Newey-West), 5 lags. OOS: rolling 666-trading-day window, walk-forward one-step-ahead. Strategy: VIXY long if forecast > 0, short if < 0; round-trip cost 25 bps applied to each position change. Diebold-Mariano: squared-loss differential, Newey-West variance, two-sided.
Remember: Alpha is never guaranteed. And the backtest is a liar until proven otherwise.
As you can see, my math can have errors — please let me know if you find any.
The material presented in Math & Markets is for informational purposes only. It does not constitute investment or financial advice.