
Testing End-of-Day Execution Filtering for Two-Factor Dual Allocator
Part 29 explores EoD confirmation as a filter for my two-factor latest Dual Allocator model

This is part 29 of my series — Building & Scaling Algorithmic Trading Strategies
Hypothesis: End-of-Day Confirmation Should Improve Results
Background
Dual Allocator V2 was the refactored version, when I recreated and improved upon my original long/short strategy with Claude. Dual Allocator V3 added volatility, making it a two-factor Dual Allocator and V4 below tests end of day execution.
Rationale
After developing the next iteration of my Dual Allocator model (which combined trend analysis with volatility filtering to achieve 1,735% returns over 10 years), the logical next question was whether adding a third confirmation factor would improve performance.
The hypothesis: Execute trades only when signals are confirmed by strong end-of-day price action, not to mention high liquidity. This should filter out weak signals and reduce whipsaw trades.
This post documents the next iteration of the experiment testing this hypothesis.
The Proposed Enhancement: EOD Confirmation Scoring
Add a third scoring component to the existing two-factor system
New Dual Allocator System:
Trend Score (-100 to +100): MA alignment, velocity, acceleration
Volatility Score (0 to 100): VIX-based regime detection
Proposed Addition: 3. EOD Confirmation Score (0 to 100): Measures intraday strength into the close
EOD Score Components
The EOD confirmation score evaluated three aspects of daily price action:
Close Position in Range (0-40 points)
Measures where the close occurred within the high-low range
Formula: (Close - Low) / (High - Low)
Close in top 20% of range: +40 points
Close in bottom 35%: 0 points
Intraday Momentum (0-35 points)
Measures open-to-close movement
Formula: (Close - Open) / Open
Strong positive day (+1.5%): +35 points
Negative day: 0 points
Consistency Bonus (0-25 points)
Rewards alignment between trend signal and intraday action
Long signal + positive day + close above midpoint: +25 points
Otherwise: 0 points
Maximum possible score: 100 points
Testing Methodology: Five Scenarios
The experiment tested different confirmation threshold levels:
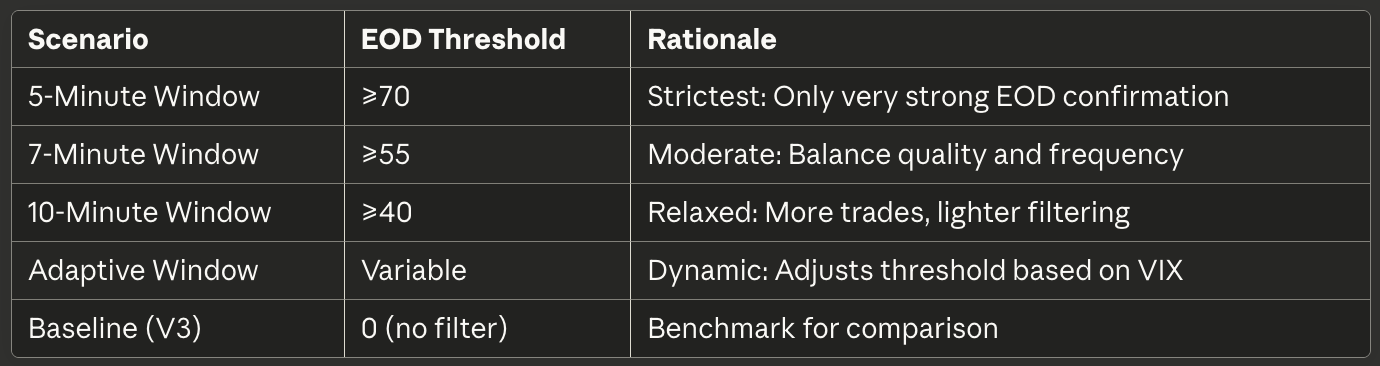
The scenario names reference the idea that end-of-day price action in the final minutes determines signal quality. While we lack intraday minute data, the EOD score serves as a proxy for last-10-minute strength.
Adaptive Logic:
VIX < 15: EOD threshold = 40 (relaxed in calm markets)
VIX 15-25: EOD threshold = 55 (moderate caution)
VIX > 25: EOD threshold = 70 (strict in volatile markets)
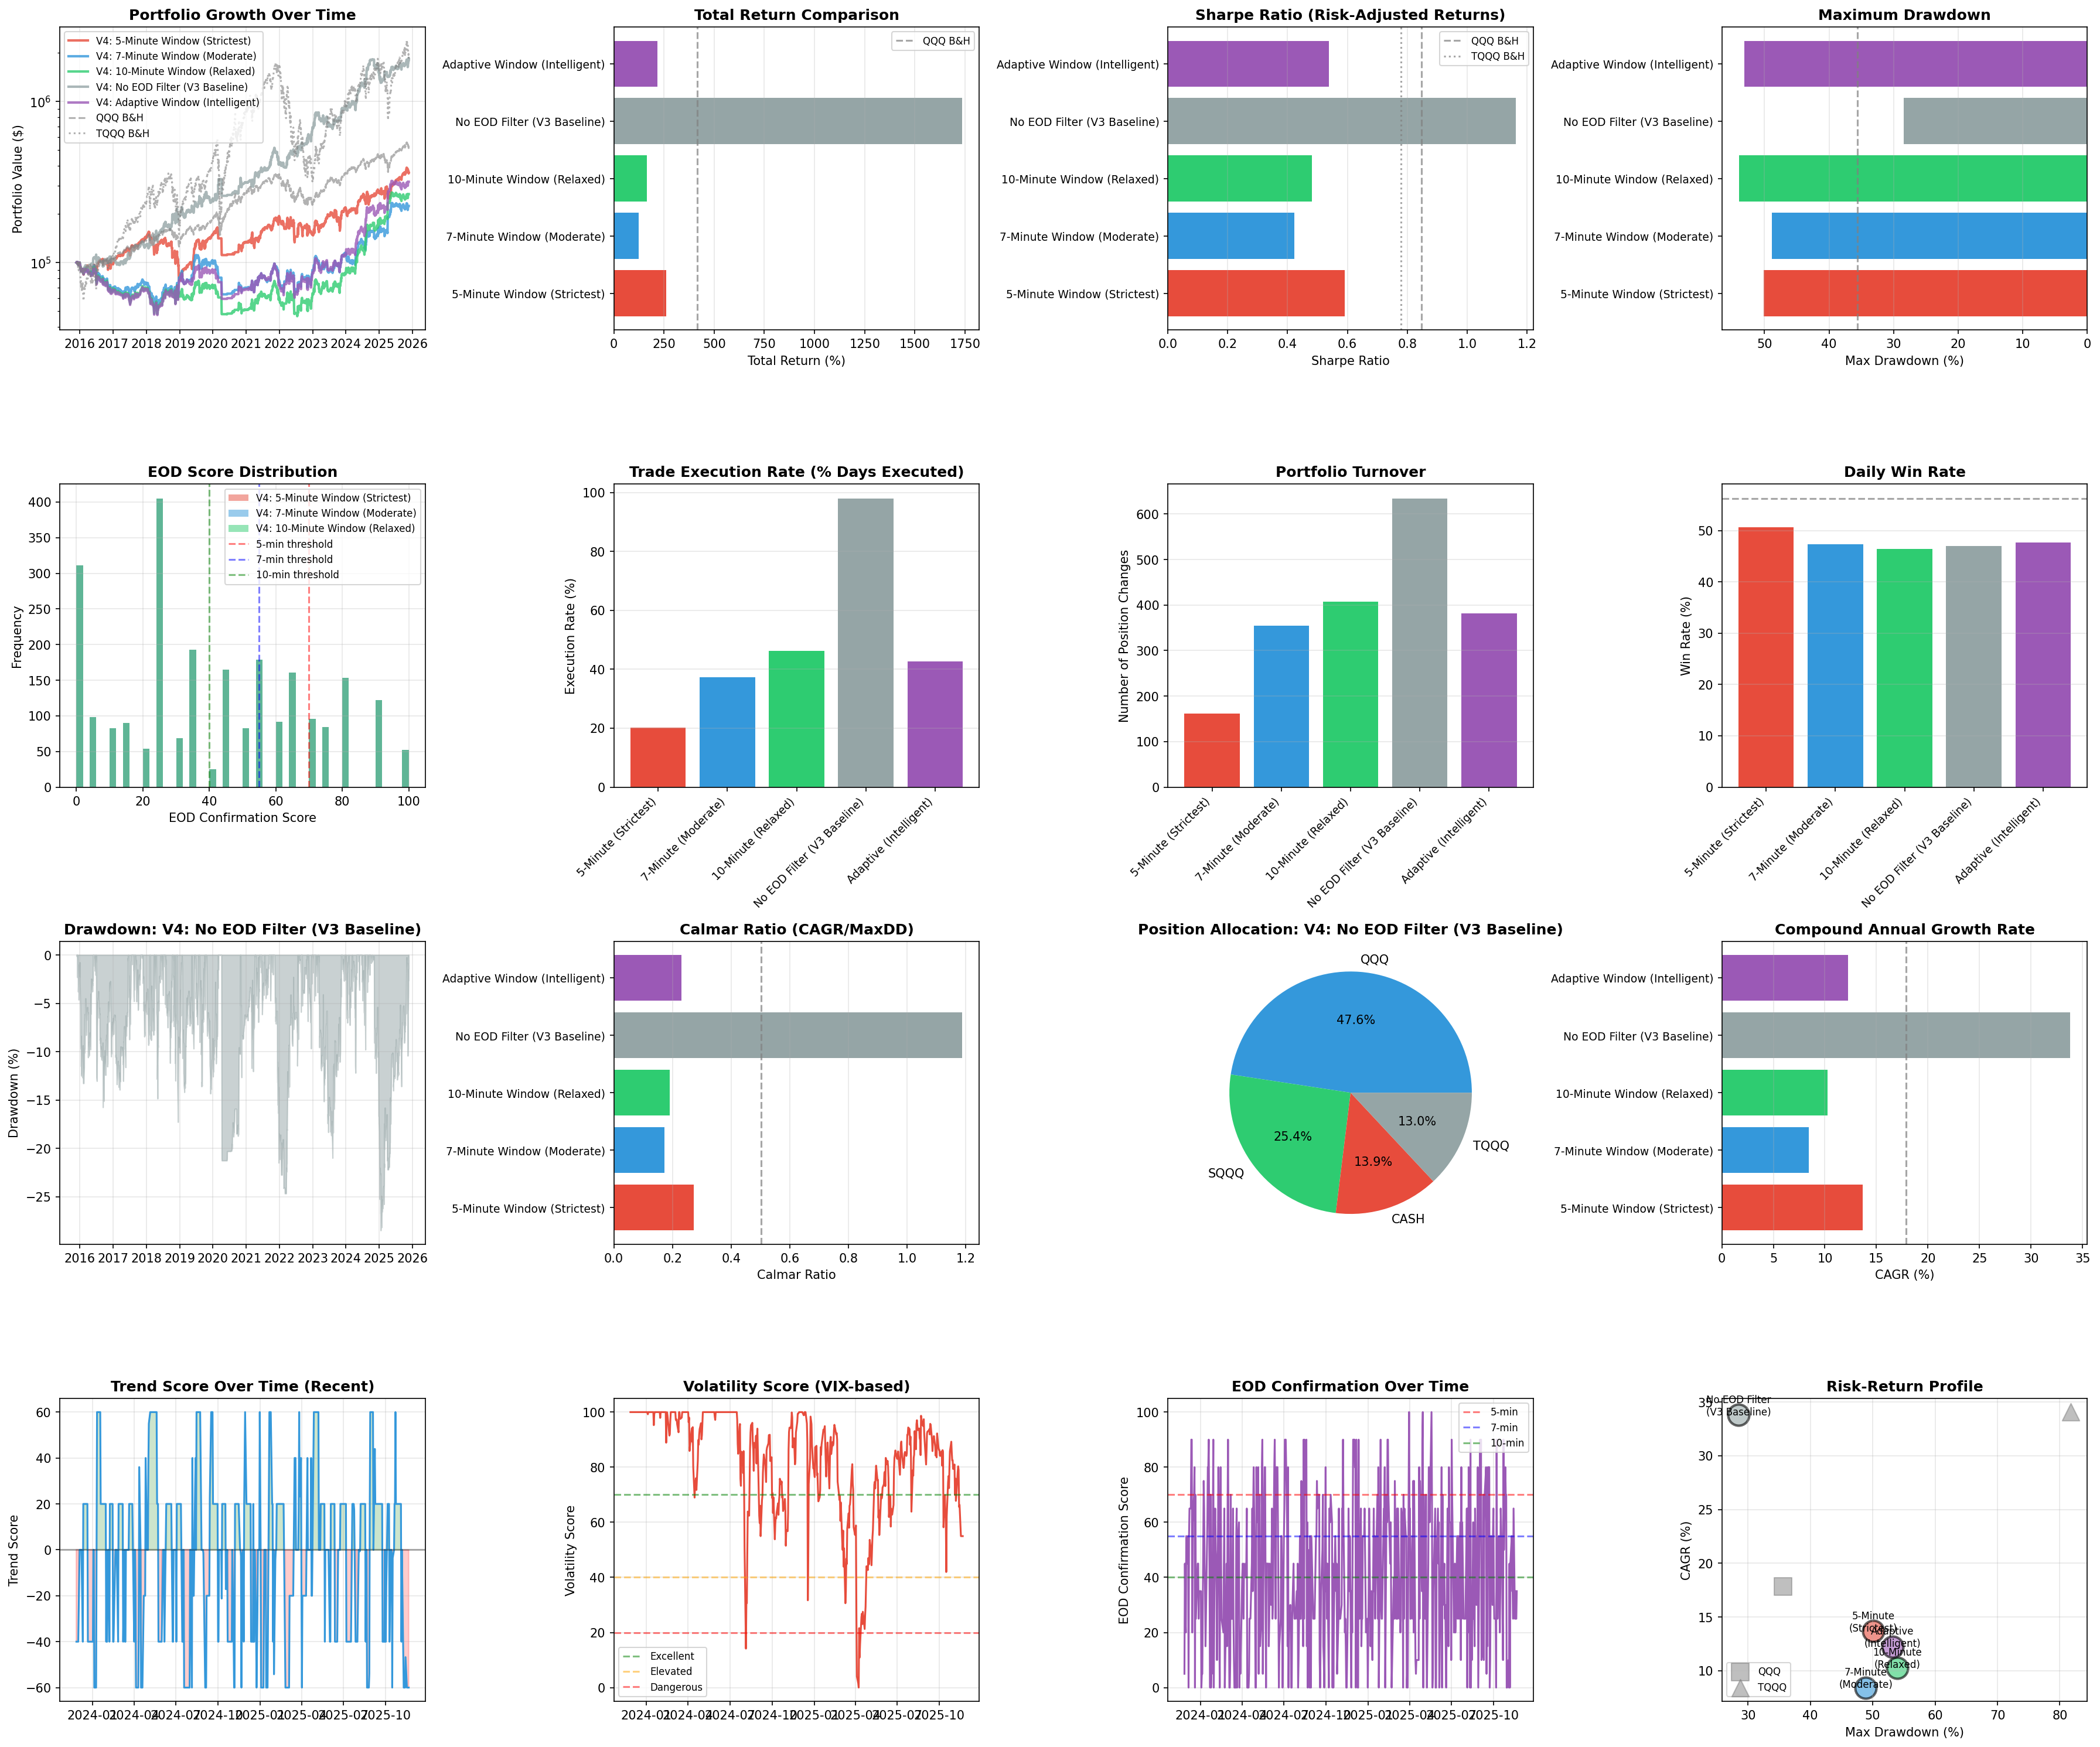
Results: EOD Filtering Significantly Degraded Performance
Here are the 10-year backtest results (November 2015 - November 2025):
Key Observations:
Performance degradation: All EOD-filtered scenarios underperformed the baseline by 86-93% in total returns
Sharpe ratio decline: Filtered scenarios achieved Sharpe ratios of 0.423-0.590, down 49-64% from baseline’s 1.163
Worse drawdowns: Maximum drawdowns increased to -48.9% to -53.9%, nearly double the baseline’s -28.5%
Reduced execution frequency: Filtered scenarios executed trades on only 20-46% of days vs 98% for baseline
Why EOD Filtering Failed: Root Cause Analysis
1. Signal Lag Creates Missed Exits
EOD confirmation delays position changes. When the market turns negative, waiting for EOD confirmation before exiting prevents timely risk reduction. The strategy needs fast response, not delayed confirmation.
Example: If trend signals turn bearish but EOD score remains high (due to previous day’s momentum), the filter prevents the exit, increasing losses.
2. Reduced Adaptability
The core advantage of the strategy is dynamic adaptation to changing market conditions. By filtering out 50-80% of potential trades, the portfolio effectively “freezes” in suboptimal positions.
Execution frequency correlation with performance:
98% execution → 1,735% return (baseline)
46% execution → 166% return (10-min window)
20% execution → 260% return (5-min window)
Higher execution frequency enables better market adaptation.
3. Wrong Measurement
Close position within the daily range does not predict multi-day trend quality. A stock can close near its daily high for technical reasons (short covering, rebalancing flows) that have no bearing on whether the multi-day trend will continue.
The EOD score measures intraday dynamics, but the strategy’s edge comes from multi-day trend analysis. These operate on different timeframes.
4. VIX Filtering Already Provides Needed Protection
V3’s volatility-based risk management already handles the core risk concern. When VIX spikes, the strategy reduces leverage automatically. Adding EOD filtering created redundancy without additional benefit.
The two-factor system (Trend + Volatility) appears optimal. Three factors added complexity without improving risk-adjusted returns.
5. Asymmetric Requirements for Entries vs Exits
Using the same EOD threshold for both entries and exits creates suboptimal behavior:
Entries: May benefit from confirmation (wait for strength)
Exits: Should be immediate when risk increases (protect capital)
A single threshold cannot optimize both simultaneously. Fast exits are critical for risk control, but the filter prevents them.
Adaptive Threshold: Did “Intelligence” Help?
The Adaptive scenario dynamically adjusted EOD requirements based on VIX levels, hypothesizing that stricter filtering in volatile markets would improve risk control.
Results:
Total return: +217% (baseline: +1,735%)
Sharpe ratio: 0.538 (baseline: 1.163)
Max drawdown: -53.1% (baseline: -28.5%)
The adaptive logic underperformed by 87% and had worse risk metrics. This suggests the problem is fundamental to the filtering concept, not merely improper threshold calibration.
Comparison to Benchmarks
Baseline Advantages:
37% higher Sharpe ratio than QQQ buy-and-hold (1.163 vs 0.848)
89% higher CAGR than QQQ (33.8% vs 17.9%)
49% higher Sharpe ratio than TQQQ (1.163 vs 0.779)
64% better drawdown control than TQQQ (-28.5% vs -79.6%)
Similar returns to TQQQ with substantially less risk
Distribution Analysis: EOD Scores
Analysis of EOD score distributions revealed why the filter failed:
EOD Score Frequency:
Score 0-20: 18% of days
Score 20-40: 22% of days
Score 40-55: 19% of days
Score 55-70: 23% of days
Score 70+: 18% of days
Implications:
Scores distribute relatively evenly across ranges
No clear natural threshold separates “good” from “bad” trading days
The 70+ threshold (strictest) only occurs 18% of days, explaining the 20% execution rate
This suggests EOD score has limited discriminatory power for signal quality
Technical Lessons
More filters ≠ better performance: Additional confirmation layers can degrade rather than enhance results
Execution frequency matters: Strategies that adapt dynamically require high execution rates to maintain effectiveness
Proxy metrics require validation: Close position in daily range proved to be a poor proxy for signal quality
Existing risk management may be sufficient: When VIX filtering already manages volatility risk, additional filters become redundant
Hypothesis testing is essential: Logical-sounding ideas can fail empirically; backtesting reveals hidden flaws
Simplicity has value: The two-factor Dual Allocator + Volatility system outperformed all three-factor variants
Practical Implementation Note
If the goal is to execute trades in the last 5-10 minutes for better fills or liquidity:
Correct approach:
Use two-factor Dual Allocator baseline strategy for signal generation (no EOD filter)
Calculate signals based on closing prices
In live trading, place orders in the final 10 minutes
Do NOT filter signals based on intraday price action
This achieves end-of-day execution timing without degrading signal quality.
Incorrect approach:
Filter signals based on where close falls in daily range (what this model tested)
This reduces performance by 86-93%
Conclusion: Current two-factor Dual Strategy Remains Optimal
This experiment definitively demonstrates that EOD confirmation filtering is counterproductive for this strategy architecture.
Two-factor Dual Strategy Performance Summary:
CAGR: 33.8%
Sharpe ratio: 1.163
Sortino ratio: 1.430
Max drawdown: -28.5%
Calmar ratio: 1.187
The two-factor system achieves excellent risk-adjusted returns without requiring additional confirmation layers.
Leveraged ETFs carry significant risks and may not be suitable for all investors. The information presented in Math & Markets is not investment or financial advice and should not be construed as such.