
Testing a Macro Sleeve Strategy: Take Two
Part 35 talks about my attempts at combining macros with equities and volatility

This is part 35 of my series — Building & Scaling Algorithmic Trading Strategies
I had previously written about the first cross-asset indicators I was prototyping.
Following up on that, I built a standalone macro-alpha package that combines macro filters with an equity sleeve (SPY + optional TLT hedge) and a VIX term-structure sleeve. The idea was straightforward: use economic indicators to filter, trade trend signals on equities, and harvest VIX contango when the setup looks good.
The grid search was small, used t+1 execution, and applied simple costs. No VIX borrow modeling yet—that would come later, unfortunately for the initial results.
The Initial Backtest
First pass with split-adjusted VIX data and fresh FRED series:
Total return: +2,789.98% over 5.31 years
CAGR: 88.51%
Sharpe: 0.630
Max drawdown: -12.74%
Best parameters found: 10/40 EMAs, 0.2 TLT hedge ratio, VIX entry at 1.0σ / exit at 0.3σ, 20% VIX scaling, 80/20 equity/VIX weights.
The sleeve breakdown: equity Sharpe -0.169, VIX sleeve Sharpe 0.632.
This looked exceptional. It also looked suspicious.
Data Hygiene Check
Before celebrating, I verified the basics:
SPY/TLT/VIXY/VIXM CSVs: split-adjusted, sorted, deduplicated, ISO dates
Date ranges: SPY from 2016, TLT from late 2015, VIXY/VIXM from mid-2020
Macro data: T10Y2Y daily, PAYEMS/CPI monthly
No duplicate dates found
The data was clean. The problem wasn’t there.
Decomposition
Breaking it apart:
Equity sleeve alone (macro filters + SPY/EMA): Sharpe 0.44, CAGR ~0.57%, total return ~5.8% over 9.9 years
VIX sleeve alone: Sharpe 0.63, total return ~+834x over 5.3 years
Combined result: almost entirely driven by VIX
The equity sleeve was doing very little. The VIX sleeve was doing everything. That’s already a red flag — 834x returns from short-vol carry should not survive contact with reality.
Sanity Checks
I added a 15% annual borrow cost to the VIX sleeve. Total return dropped to +25.2x, Sharpe stayed around 0.62.
Still too high. Borrow alone wasn’t the issue.
Why ROI Was Inflated
Five problems:
VIX sleeve dominated and used 2020–2025 only. Short-vol contango in that window drove massive compounded returns. No stress periods from 2018 or 2015 in the data.
No release-lag modeling for macro series. The signals joined on observation dates, not release dates. This created potential look-ahead bias—using information before it would be tradable in real time.
Minimal costs. No realistic ETN borrow (20–30% annually), no meaningful slippage (5–10 bps one-way), no term-structure decay haircut on long VIX exposure.
Limited history. VIXY/VIXM only go back to mid-2020. Missing critical regime changes and drawdown periods.
Unbounded VIX exposure. No vol targeting, no leverage cap, no position limits.
The backtest had inflated returns because it was trading in a dream world.
Fixing the Model
I updated the code to add realism:
Publication lags for macro data: PAYEMS/CPI shifted by 15 days, slope by 1 day, forward-filled to daily frequency
Price-based EMAs: Computed on price rather than return cumprod to avoid indicator drift
Vol-targeted VIX sleeve: Annual vol target (10%), maximum leverage cap (1.0x), borrow cost (30%/year), slippage (20 bps round-trip)
New grid parameters: same EMA ranges, added vol targeting and cost parameters.
The Critical Test
After adding lags, costs, and vol targeting:
Total return: -1.65%
CAGR: -0.31% per year
Sharpe: -0.138
Max drawdown: -6.54%
Sleeve Sharpes: equity 0.018, VIX -1.166
The previously huge ROI was almost entirely from an unconstrained VIX sleeve operating in a favorable window with unrealistic assumptions. After adding proper constraints, the VIX alpha turned negative and the combined strategy lost money.
From +2,789% to -1.65%. That’s what realism costs.
Attempting Recovery
I tried three mitigations:
Softer costs but still realistic: 20% borrow, 10 bps slippage, 15% vol target
Wider VIX entry/exit bands: Higher thresholds, tighter max exposure (0.5x)
Vol-targeted equity sleeve: 10–12% annual vol target, 1.1–1.2x max leverage
Ran a grid of conservative configs.
Best result:
20/60 EMAs, 10% equity vol target, 1.1x max leverage, 0.25 TLT hedge
VIX: 1.3σ entry / 0.5σ exit, 12% vol target, 0.5x max leverage, 15% borrow, 10 bps slippage
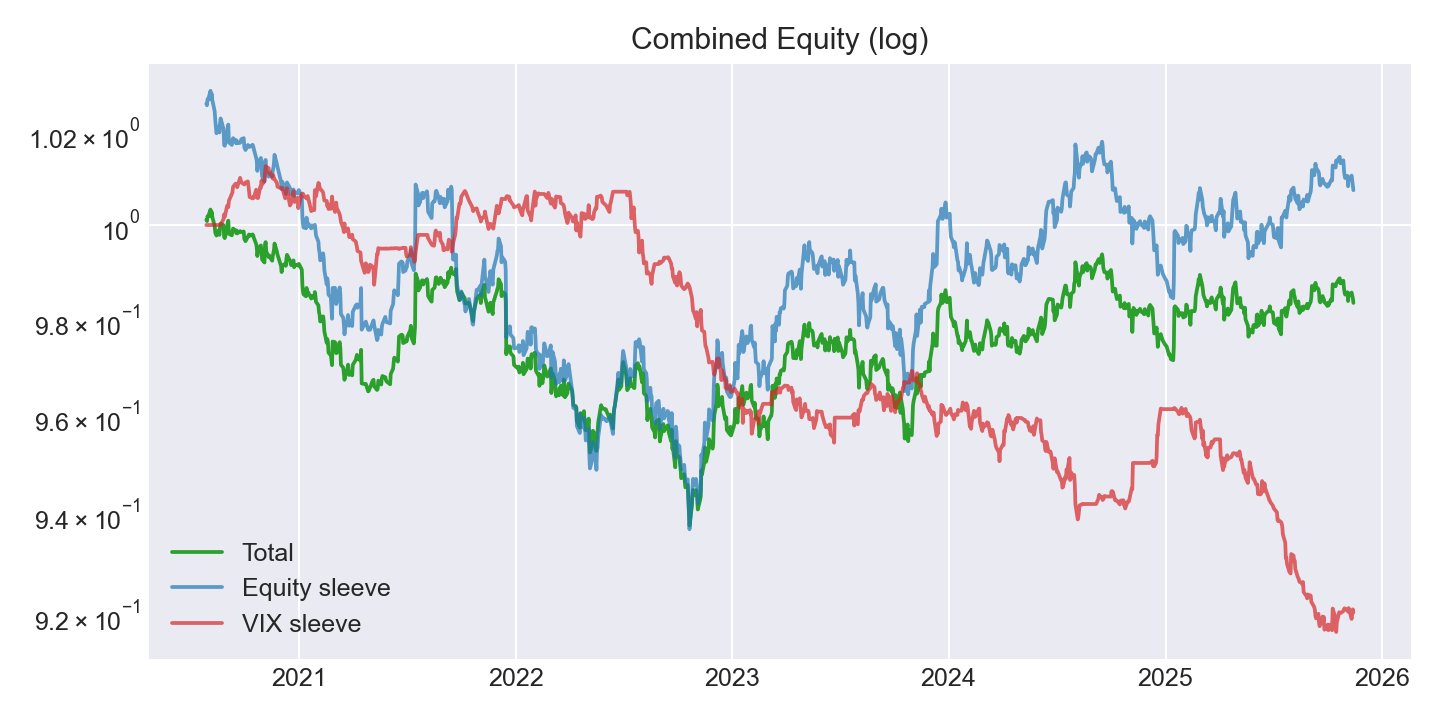
Weights: 92% equity, 8% VIX
Total return: +0.08%, CAGR +0.02%/year, Sharpe 0.024
Max drawdown: -7.84%
Sleeves: equity Sharpe 0.047, VIX Sharpe -0.668
Still not good. The VIX sleeve remained negative Sharpe even with lighter costs.
Equity-Only Config
I tried turning VIX off entirely.
Best equity-only result:
10/40 EMAs, 12% vol target, 1.2x max leverage, 0.1 TLT hedge, no VIX
Total return: +0.53%, CAGR +0.10%/year, Sharpe 0.076
Max drawdown: -3.74% over 5.30 years
Adding a tiny VIX sleeve (5% weight, high thresholds, capped leverage) didn’t beat this.
Conclusion
With realistic publication lags and transaction costs, this macro + SPY/TLT sleeve produces low returns and low Sharpe. The VIX sleeve adds no value—it’s either massively inflated under dream assumptions or negative Sharpe under realistic ones.
The initial 88% CAGR was a measurement artifact, not alpha.
To pursue higher Sharpe or meaningful ROI, I’d need a different alpha source: stronger trend/momentum signals, broader asset mixes (QQQ/TLT rotation, cross-asset carry), or alternative risk overlays beyond the current macro filters. The macro term-structure idea doesn’t survive contact with realistic costs and proper data handling.
Sometimes the answer is “this doesn’t work.” That’s still a result.
The information presented in Math & Markets is not investment or financial advice and should not be construed as such.