
Testing a Hybrid ML Ensemble (arXiv 2510.22348) and Turning It Into a Real Strategy
Part 17 below tests hybrid machine learning ensembles as a risk overlay

This is part 17 of my series — Building & Scaling Algorithmic Trading Strategies
In a recent post, Quantitativo reviewed a rather interesting paper that talked about 41% annual return, Sharpe 2.51 and predicting crashes before they happen.
The authors had built a hybrid ensemble that forecasts near-term equity drawdowns using a series of factors:
cross-asset volatility
entropy / KL divergence
Hurst exponent
yield-curve slopes
vol/FX/rates co-movement
a soft-voting ensemble of MLP + XGBoost (and optionally CatBoost)
The paper suggested that combining these signals can predict 5-day SPY drawdowns, which could then be converted into a probability for a risk overlay. The end result is you get a smoother equity curve with smaller drawdowns.
So of course, I became curious and wanted to test the model to see if I could use it as part of my portfolio of strategies.
Well, turns out maybe I could!
1. Rebuilding the Hybrid Ensemble
I wrote a new experiment script to try and replicate what the paper describes.
A. Build cross-asset features
For each day, compute rolling:
vol / skew / kurtosis
entropy
cross-asset correlations / betas
yield-curve slopes (10y–1y)
FX / rates vol clusters
These get merged into a single “feature matrix” (hundreds of engineered signals).
B. Create the target label
The goal here is to predict whether:
SPY forward 5-day return ≤ –1%
Binary classification is simple — stress vs. normal.
C. Filter the feature space
The pipeline filters by:
variance threshold
correlation pruning
mutual information ranking (top 80 features)
D. Train base learners
MLP grid
XGBoost grid (initial run)
Later: CatBoost (second run)
All tuned via TimeSeriesSplit.
(As an aside, I have been using Scilab to run many of my tests, and then discovered sci-kit. Such a game changer!!)
E. Soft-vote ensemble
Then blend the base learners into a probability forecast.
F. Risk overlay
And finally, trade SPY long when p(risk) < threshold — otherwise move to flat or partial exposure.
2. What the First Run Looked Like
After training on data through 2022 and testing on 2023+ out-of-sample:
Model performance
ROC–AUC: 0.64
Accuracy: 0.68
Recall (stress class): ~0.50
Precision (stress class): ~0.32
Confusion matrix: [[433,162], [ 75, 76]]
Not a perfect classifier — but better than random, and surprisingly useful for a risk toggle.
Strategy performance (simple overlay)
Trade SPY long only when p(risk) < threshold.
With thresholds from 0.4–0.6:
Sharpe: 1.45 → 1.82
Total return: 0.52 → 1.00×
Best: threshold = 0.6
Sharpe: 1.82
MaxDD: 14.8%
This looked really promising and I was very excited.
3. Adding CatBoost + Better Grids + Imbalance Handling
The next iteration added:
CatBoost
Wider parameter grids
scale_pos_weight sweeps
New grid report (MLP + XGBoost + CatBoost)
Results:
Ensemble ROC–AUC: ~0.614
Accuracy: ~0.697
Sharpe (toggle): 1.58–1.64
Best settings: thresholds around 0.45–0.60
Notably:
CatBoost and XGBoost both surfaced similar feature importance patterns.
MLP remained mediocre (ROC–AUC ~0.50).
Ensemble consistently outperformed any single model.
Okay, great so let’s see what happens next.
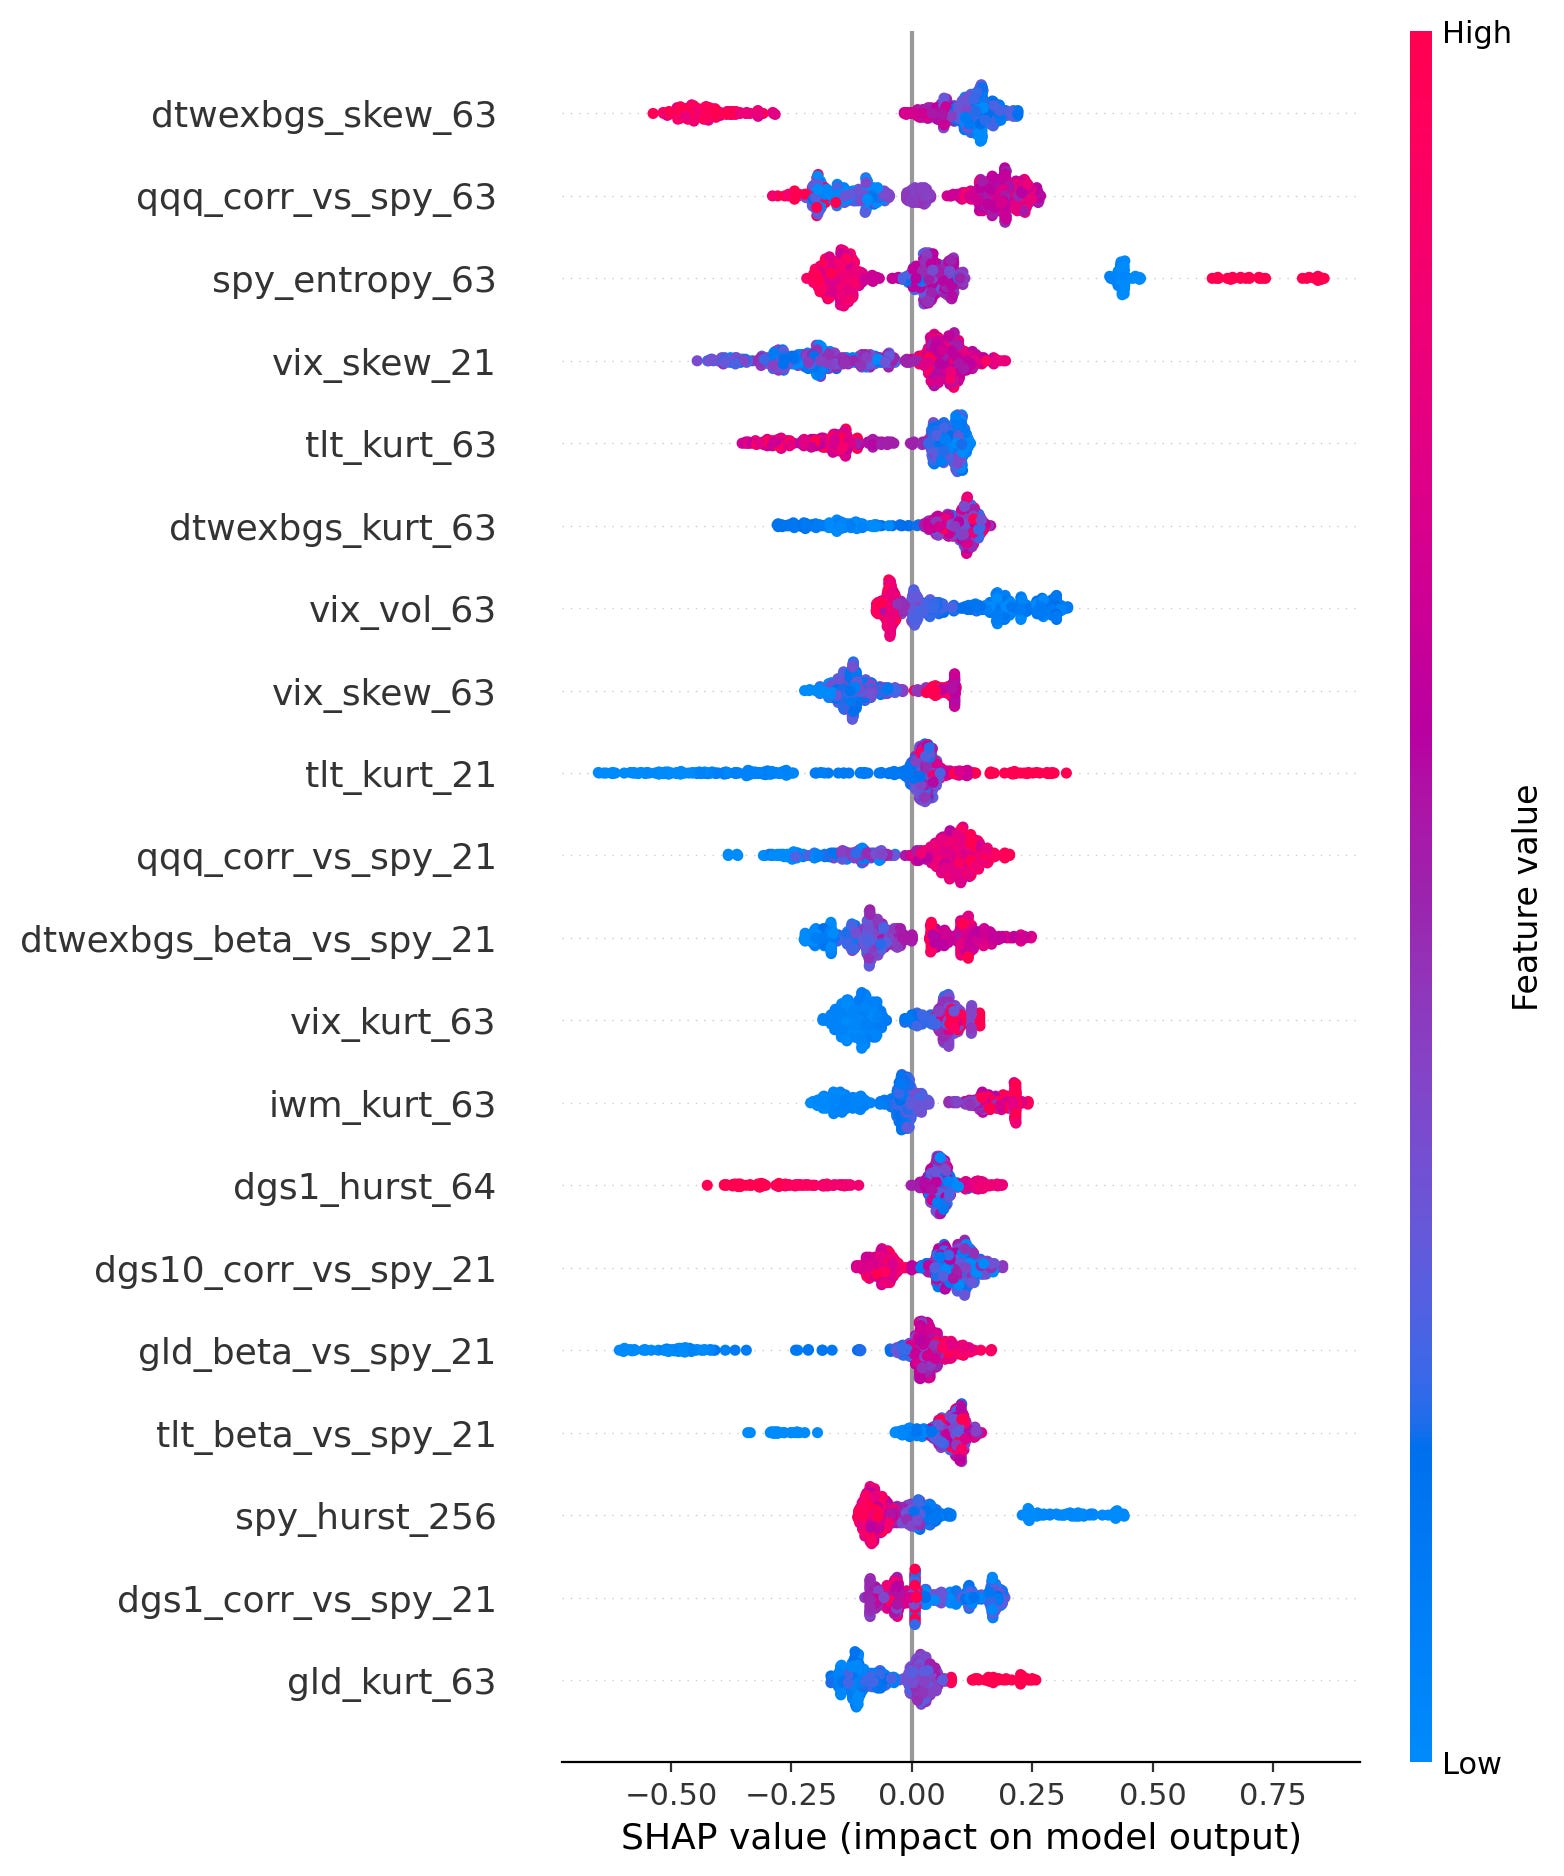
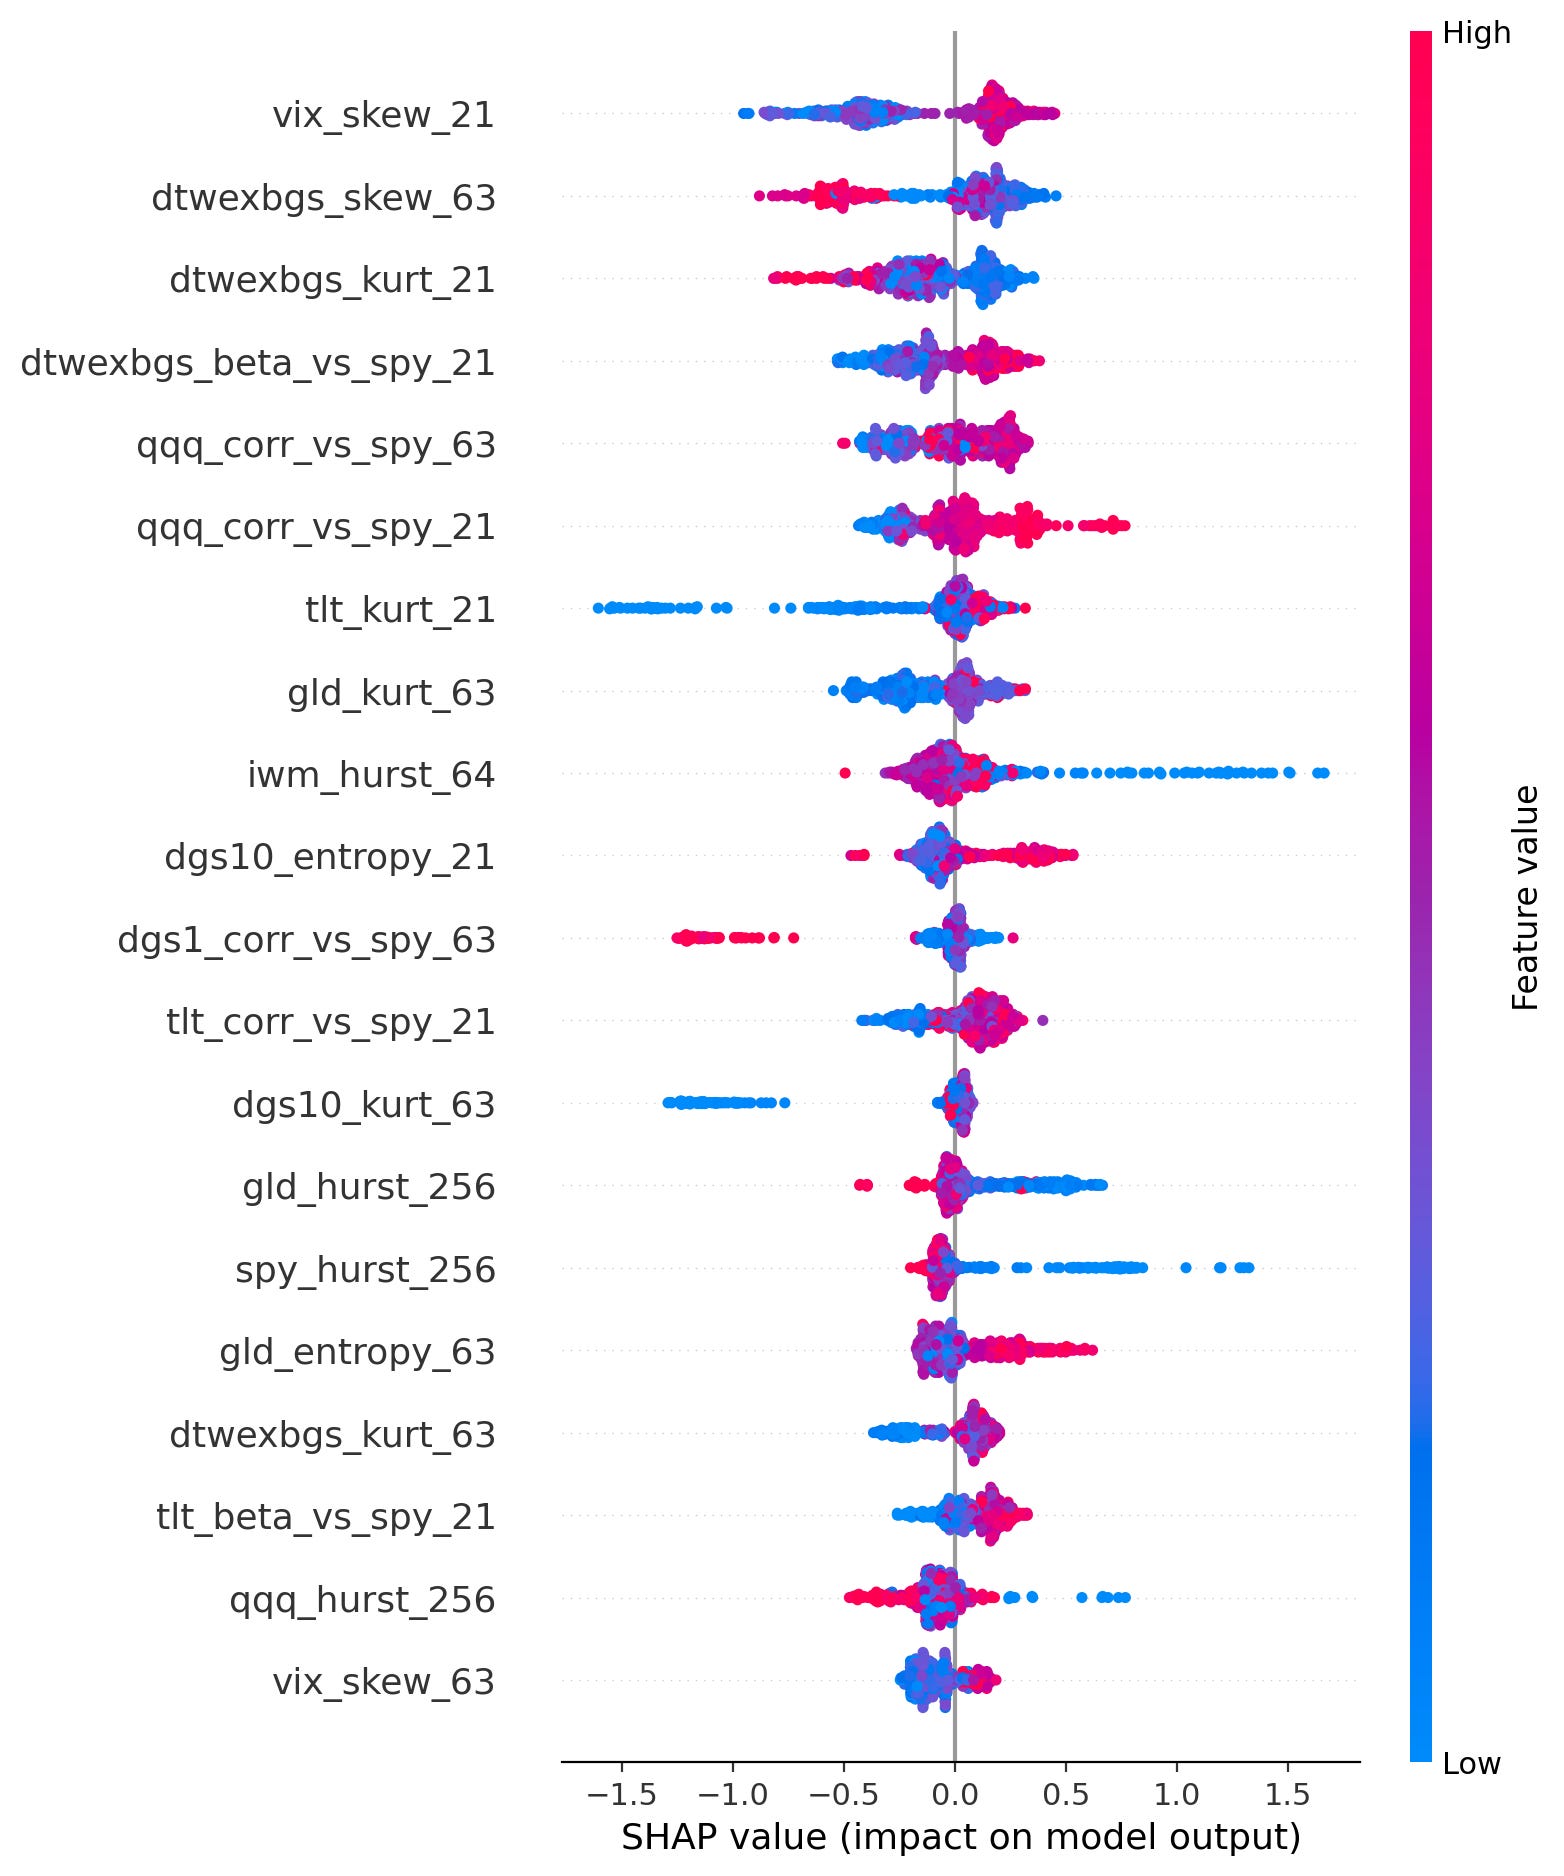
4. Adding SHAP Attributions (Which Signals Actually Matter?)
I then added SHAP reporting and both models highlighted the same dominant features:
Top drivers
Rate-complex volatility (DGS1, DGS10)
Rate kurtosis & entropy
VIX beta / cross-asset correlations
KL divergence between vol clusters
FX/rates entropy
Yield-curve slope dynamics
So basically, stress shows up in the rate complex before it shows up in SPY.
When I saw this, I was incredibly excited because this aligns with macro intuition.
5. Building a Real Trading Sleeve (Hybrid Toggle)
Next step was turning this probability stream into a practical risk toggle that I could use.
So I wrote a script that loads the daily probability stream:
applies thresholds
uses a 3-state exposure map:
p < low_thresh → exposure = 1.0
low_thresh < p < high_thresh → exposure = mid (e.g., 0.5)
p > high_thresh → exposure = flat (0.0)
includes transaction-cost modeling
writes allocations + equity curves
supports full grid scans over threshold combinations
Best performing toggle
With 5 bps transaction costs:
low = 0.45, high = 0.65
mid exposure = 0.5, flat = 0.0
Performance
Sharpe: 1.85
CAGR: 23.5%
ROI: 86.7%
MaxDD: –12.4%
Avg turnover: ~7.2%
Much cleaner than SPY buy-and-hold (Sharpe 1.36).
And importantly, the toggle doesn’t trade the forecast but rather modulates exposure.
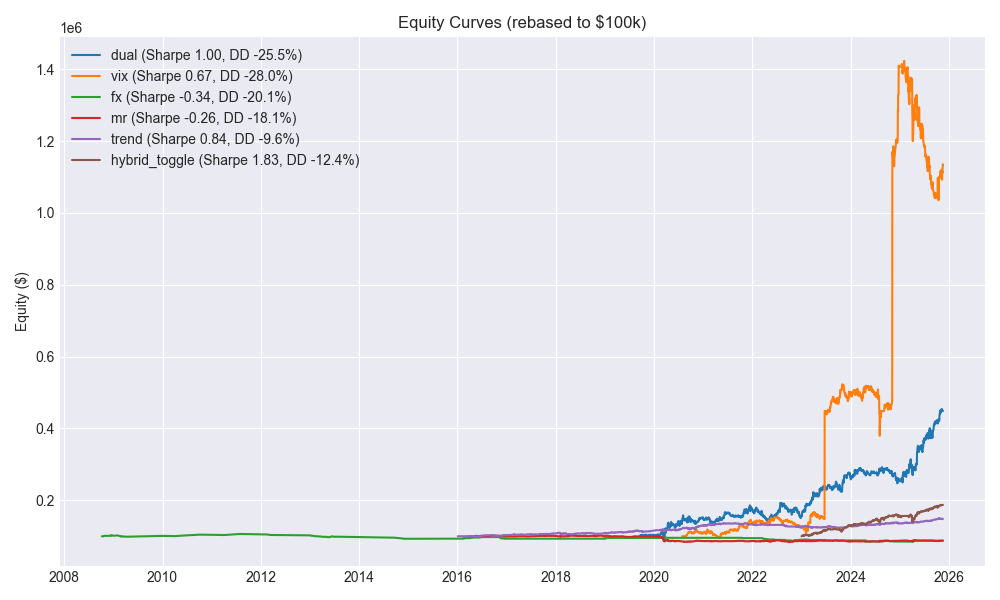
6. Integrating the Hybrid Toggle Into the Dashboard
To compare the ROIs and Sharpe from all my strategies, I had created a strategy dashboard. So I added this strategy as a new sleeve, Now the dashboard shows the following strategies:
dual momentum
VIX sleeve
defensive trend overlay
FX/MR (archived)
hybrid toggle (baseline SPY)
As you can see below, the hybrid toggle has the highest Sharpe of any standalone sleeve.
7. So… How Would I Actually Deploy This?
A. Treat the ensemble as a risk toggle — not a forecaster
This model is not predicting direction but rather it’s predicting stress.
So I treat it to tell me if it thinks the 5 days will be normal. It’s not going to tell me if SPY will go up tomorrow.
But I can use the probability stream to scale risk, not to flip positions.
B. Use exposure brackets
Example:
Probability (risk)Exposure<0.45fully long (1.0×)0.45–0.65partial (0.5×)>0.65flat or hedged (0.0×)
This avoids overreacting to small changes.
C. Use SHAP signals as “explainability alerts”
The nature of SHAP gives me local and global explanations of model outcome, which could then be used in many ways. For example:
If rates vol entropy suddenly spikes → risk model flags high → allocator cuts exposure.
If yield-curve slope becomes the dominant SHAP driver → watch macro duration risk.
These diagnostics help avoid “model did something weird” situations (or at least have a better handle on it!!).
D. Add governance + monitoring
retrain weekly or monthly
monitor ROC–AUC stability
track probability drift
require “confirmation” (e.g., 5-day SMA of probability must cross thresholds)
This makes it production-ready.
E. How can I wire this into the allocator
There are a few things I could do…
Apply the toggle to the core SPY/QQQ sleeve
Apply it to blended books
Use it to allocate between:
dual momentum
defensive trend
capped VIX sleeve
Or even modulate gross and net exposure separately
The nice thing is that the hybrid toggle is agnostic to what I trade since it’s just a probability of stress.
8. Where This Goes Next
Quarterly re-validation of thresholds
Check whether 0.45/0.65 continues to perform.Transaction-cost-aware backtests
Make sure this doesn’t eat too much churn in live trading.Walk-forward training windows
To prevent hidden overfitting.Allocator integration
Hybrid toggle can sit on top of the dual momentum engine.Synthetic data testing
Reduce confirmation bias and improve generalization.
Closing Thoughts
The hybrid ensemble is the first ML-heavy sleeve I’ve built that actually feels practical.
Not because it predicts crises perfectly (it doesn’t and I’d say no model does) but because:
(a) it’s an early warning system
(b) it’s probabilistic (so I can adjust based on my risk appetite) and
(c) it integrates rather nicely with the rest of my system.
I’ll take any edge I can get that’s slightly better than random chance.
As a next step, I really want to generate some synthetic time series data to test this (and other strategies). I want to see how these models perform on data that they haven’t been trained on.
After that, I’d like to integrate the hybrid toggle directly into the dual allocator and test the combined Sharpe/DD. Exciting times.
The information presented in Math & Markets is not investment or financial advice and should not be construed as such.
This is very interesting. Do you have a code so we can see each detail of the implementation? Thanks!