
Three Sleeves, One Thesis: How to Actually Trade the SaaS Dislocation
Part 78 — SaaS Series Part 4 of 4

This is part 78 of my series — Building & Scaling Algorithmic Trading Strategies
Over the past three posts, we reviewed the analytical infrastructure for trading the SaaS selloff. Now comes the fun part: translating all of that into a tradable strategy.
The goal here isn’t to present a backtested system with beautiful equity curves (if you’ve followed my work on the V6 Dual Allocator, you know I’m deeply skeptical of backtests that look too good). So my goal here is to discuss entry and exit criteria, allocations and rebalancing across my 3 hypotheses we previously discussed.
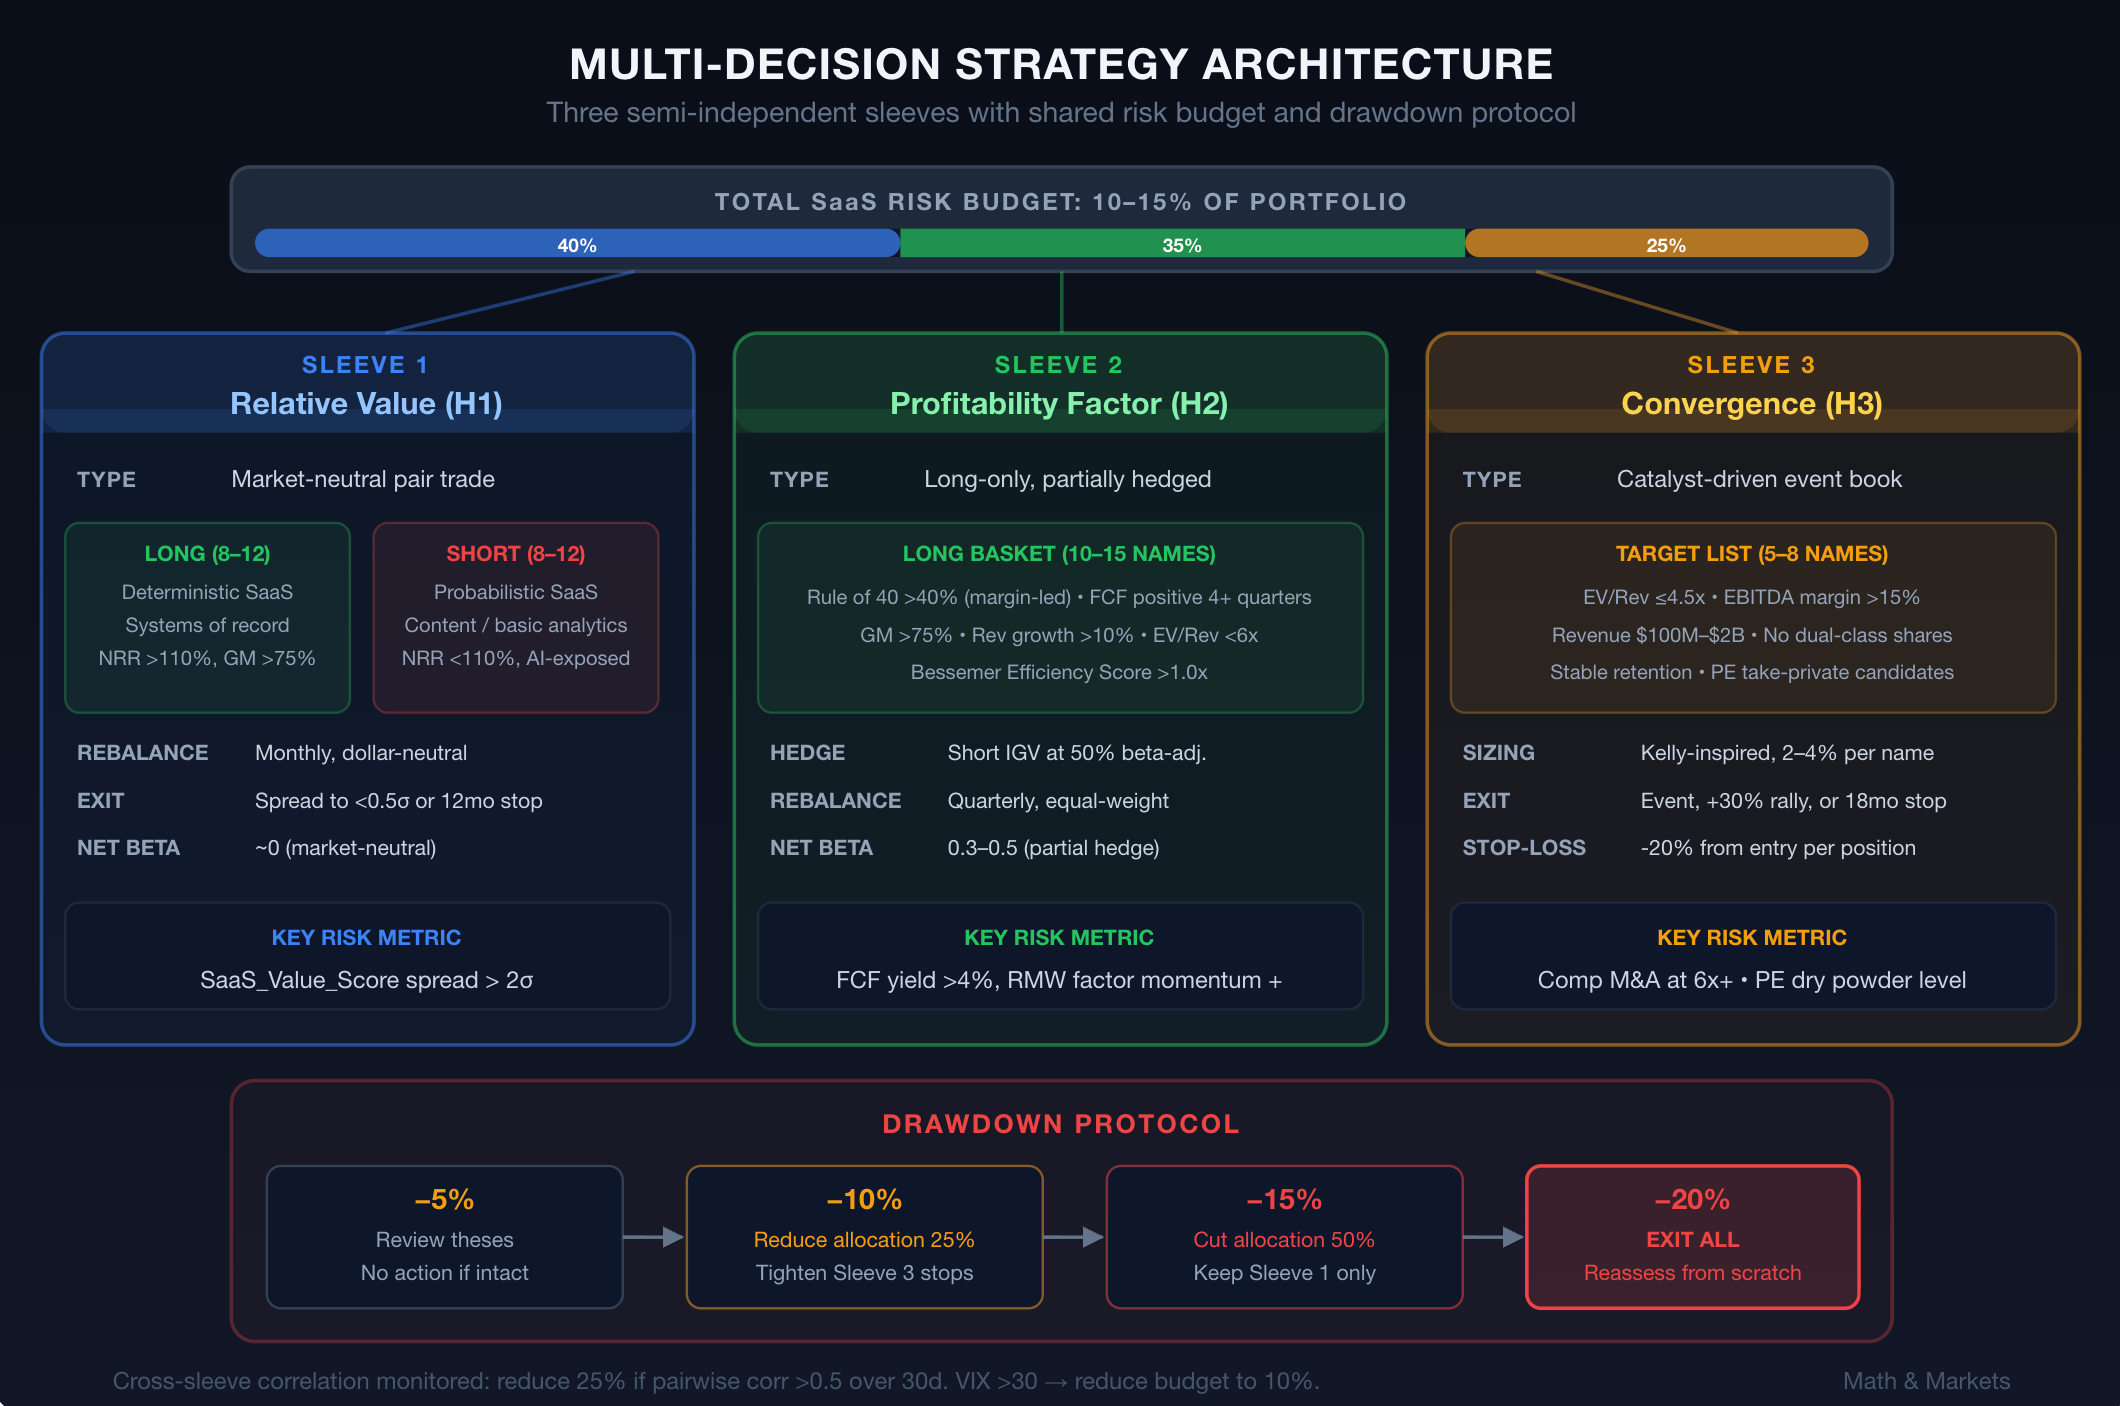
I call this a multi-decision strategy because as far as I’m concerned, the key insight here is that you shouldn’t be making one bet on SaaS. You should be making several orthogonal bets, each linked to a specific hypothesis, each with its own entry/exit criteria, and each sized according to your conviction and the evidence.
Architecture: The Three-Sleeve Approach
The strategy has three sleeves, each mapped to one of the hypotheses from Part 3. The sleeves operate semi-independently but share a common risk budget.
Sleeve 1: Deterministic vs. Probabilistic Relative Value (Hypothesis 1)
Type: Market-neutral pair/basket trade Target allocation: 40% of SaaS risk budget
Sleeve 2: Profitability Factor (Hypothesis 2)
Type: Long-only, factor-tilted basket Target allocation: 35% of SaaS risk budget
Sleeve 3: Private-Public Convergence (Hypothesis 3)
Type: Catalyst-driven event book Target allocation: 25% of SaaS risk budget
The total SaaS risk budget should be sized relative to your overall portfolio. For context: SaaS is a single sector trade with elevated uncertainty. I’d cap it at 10-15% of total portfolio risk under normal conditions, potentially up to 20% if multiple confirmation signals fire simultaneously.
Sleeve 1: Deterministic vs. Probabilistic Relative Value
Long-Short Basket Construction
Long basket: 8-12 high-deterministic SaaS companies Screen criteria:
Core product is a system of record (ERP, financial systems, security, compliance, data infrastructure)
NRR > 110%
Gross margins > 75%
AI integration is additive (embedded in product, enhances workflow, increases switching costs)
EV/Revenue below 10x
Short basket: 8-12 high-probabilistic SaaS companies Screen criteria:
Core product is replicable by LLMs (content generation, basic analytics, simple workflow automation)
NRR < 110% or declining
AI strategy is defensive (bolt-on chatbot, no proprietary model)
EV/Revenue above 4x (to avoid shorting already-collapsed names where the risk/reward has inverted)
Allocation & Position Sizing
Dollar-neutral: long and short baskets equal in notional value. Within each basket, equal-weight the positions. This eliminates market directional risk — the strategy profits from spread widening regardless of whether the overall SaaS sector goes up or down.
Risk target: the long-short basket should have an expected tracking error of 15-20% annualized against a SaaS benchmark. This is high, but it reflects the conviction that the spread is structurally underpriced.
When to Enter
Initiate when:
The SaaS_Value_Score spread (from Part 2) between the long and short baskets exceeds 2 standard deviations from its 6-month rolling mean
At least 3 of 4 confirmation criteria from Hypothesis 1 are trending positive
The IGV ETF has declined >15% from its 52-week high (ensuring we’re entering during sector stress, not during complacency)
All three conditions are met as of today when I’m writing this.
When to Exit / Reduce Exposure:
Close or reduce when:
The spread compresses to within 0.5 standard deviations of the 6-month mean (profit target)
Any 2 of 4 invalidation criteria from Hypothesis 1 trigger
The short basket declines >40% from entry (limited remaining downside, increasing short squeeze risk)
12 months have elapsed without meaningful convergence (time stop)
When to Rebalance
Monthly rebalancing to maintain dollar-neutrality and refresh the screening. Positions that exit the screen on either side get replaced. Transaction costs matter here — this is a higher-turnover strategy, and I’d est. 50-100bps of drag from execution.
Sleeve 2: Profitability Factor Basket
Long-Only Basket Construction
Long-only basket: 10-15 SaaS companies with demonstrated profitability and reasonable valuations.
Screen criteria (all must be met):
Rule of 40 score > 40%, with margin contribution > 20 percentage points
Free cash flow positive for 4+ consecutive quarters
Gross margins > 75%
Revenue growth > 10% (avoids value traps)
EV/Revenue below sector median (~6x currently)
Bessemer Efficiency Score > 1.0x
This is a quality-value screen. It should surface companies that the market is treating like “boring” SaaS while paying up for unprofitable high-growth names that face more AI disruption risk.
Allocation & Position Sizing
Equal-weight across the basket. Size the total sleeve at 35% of the SaaS risk budget. Within a broader portfolio, this might represent 3-5% of total capital.
Because this is long-only, it carries market beta. To partially hedge, pair the basket with a short position in the IGV ETF sized at 50% of the long basket’s beta-adjusted notional. This creates a “portable alpha” structure: you capture the profitability factor premium while reducing overall market exposure.
Net exposure = Long basket beta × Long notional - 0.5 × Short IGV notionalTarget net beta of 0.3-0.5 relative to the SaaS sector. You want some positive exposure to a recovery, but you don’t want the strategy to be dominated by beta.
When to Enter
Initiate when:
At least 10 companies pass all screening criteria simultaneously
The spread between profitable and unprofitable SaaS EV/Revenue multiples is below the 3-year average
FCF yields for the basket exceed 4% (indicating the profitability is real and sufficient to support current prices even at zero growth)
When to Exit / Reduce Exposure:
Reduce exposure when:
Interest rates decline >150bps (changes the regime toward growth-favoring conditions)
Profitable SaaS basket underperforms the SaaS sector by >10% over 3 months (the factor isn’t working)
Average NRR for the basket falls below 105% (profitability is coming at the expense of growth, which signals customer attrition)
12 months elapsed without outperformance relative to the sector
When to Rebalance
Quarterly. Lower turnover than Sleeve 1 because the profitability factor is stickier — companies don’t become unprofitable overnight. Review screens, replace any names that drop below criteria, and rebalance to equal weight.
Sleeve 3: Private-Public Convergence
Portfolio Construction
This sleeve is event-driven and operates differently from the first two. The thesis is that specific SaaS companies are trading below their private-market fair value, making them take-private candidates or likely to re-rate as the market recognizes the divergence.
Target list: 5-8 companies meeting:
EV/Revenue at or below 4.5x (the long-run median private M&A multiple)
EBITDA margin > 15% (PE needs a margin base to work with)
Revenue between $100M and $2B (sweet spot for PE take-privates — large enough to matter, small enough for a single fund)
Low insider ownership concentration (makes acquisitions easier)
No dual-class share structure (same reason)
Stable or improving retention metrics
Allocation & Position Sizing
This is the most concentrated sleeve. 5-8 positions, sized according to a Kelly-inspired framework where position size scales with the estimated probability of a take-private event and the expected premium.
Position weight = (p × premium - (1-p) × cost_of_carry) / varianceWhere:
p = estimated probability of take-private within 18 months (subjective, but informed by sector M&A velocity, PE dry powder, and company-specific signals)
premium = estimated take-private premium (historical median for software: 30-40%)
cost_of_carry = opportunity cost of capital tied up in a non-performing position
variance = stock’s realized volatility
For most positions, this yields 2-4% allocations per name. No single position should exceed 5% of the SaaS risk budget.
When to Enter
Initiate when:
Company passes all screening criteria
Recent comparable M&A transactions (same sub-sector, similar size) have closed at 6x+ revenue (confirming private market appetite)
No company-specific red flags (accounting irregularities, management instability, pending litigation)
Scale up when:
An activist investor discloses a position
The company initiates a “strategic alternatives” review
Credible M&A rumors surface in trade press (be disciplined about information quality — rumors are cheap)
When to Exit
Exit when:
Take-private announcement (hold through to close, exit at deal price)
Stock rallies >30% without a take-private catalyst (the public market has repriced; the convergence trade has worked through a different mechanism)
18 months elapse without an event (time stop — the thesis requires a catalyst)
Company’s fundamentals deteriorate (NRR drops, margins compress, management turnover)
The position hits a 20% stop-loss from entry (capital preservation)
There isn’t really any rebalancing here tbh.
Cross-Sleeve Risk Management
Portfolio-Level Controls
Maximum SaaS risk budget: 15% of total portfolio capital. Reduce to 10% if the VIX exceeds 30 (elevated volatility compresses expected Sharpe ratios and increases the probability of correlated drawdowns across sleeves).
Correlation monitoring: The three sleeves should exhibit low pairwise correlation by design. Sleeve 1 is market-neutral, Sleeve 2 is partially hedged, Sleeve 3 is event-driven. If realized correlation between sleeves exceeds 0.5 over a rolling 30-day window, reduce the combined allocation by 25%. Correlation convergence in crisis is the number one killer of multi-strategy portfolios.
Regime detection: Using a simplified framework (consistent with the Hidden Markov Model approach I’ve written about in other posts), monitor two state variables:
SaaS sector implied volatility relative to realized volatility (IV/RV ratio). When IV/RV > 1.5, the market is pricing more risk than is being realized — this favors mean-reversion strategies (Sleeves 1 and 2). When IV/RV < 0.8, the market is underpricing risk — reduce overall exposure.
Factor momentum — the trailing 3-month return of the profitability factor (RMW) within the SaaS universe. When RMW factor returns are positive, Sleeve 2 is in regime. When negative, reduce Sleeve 2 allocation and shift to Sleeve 1 (which is market-neutral and less regime-dependent).
Drawdown Protocol
Obviously your risk appetite isn’t the same as mine. But this is how I’d think about drawdown scenarios.
At -5% portfolio-level drawdown from SaaS positions: Review all positions against original theses. I’d say no action needed if the original theses still remain intact.
At -10%: Reduce total SaaS allocation by 25%. Tighten stop-losses on Sleeve 3 positions.
At -15%: Cut total SaaS allocation in half. This is the “something is structurally wrong with the thesis” level. Remaining capital should be concentrated in Sleeve 1 (market-neutral, lowest directional risk).
At -20%: Exit all positions. Reassess the entire framework from scratch. At this level, either the market is pricing something we’re not seeing, or our thesis is wrong. Either way, the right move is to step aside, preserve capital, and re-engage only when we understand why you were wrong.
Decision Tree Summary
To make this actionable, here’s a simple decision tree:
1. Is SaaS under broad sector stress? (IGV down >15% from 52-week high)
   → YES: Proceed to Step 2
   → NO: Monitor. Don't force entry into a strategy designed for dislocations.

2. Run the four-factor screen from Part 2. Do you find:
   a) A meaningful spread between deterministic and probabilistic baskets?
      → YES: Initiate Sleeve 1 (relative value)
   b) At least 10 companies passing the profitability screen?
      → YES: Initiate Sleeve 2 (profitability factor)
   c) At least 5 companies trading below private M&A floor values?
      → YES: Initiate Sleeve 3 (convergence)

3. Size each sleeve according to the allocations above.
   Apply correlation and volatility overlays.

4. Monthly: rebalance Sleeve 1, review Sleeve 3 catalysts.
   Quarterly: rebalance Sleeve 2, refresh all screens.

5. Monitor confirmation/invalidation criteria for each hypothesis.
   If 2+ invalidation criteria trigger on any hypothesis → exit that sleeve.
   If 2+ confirmation criteria trigger → consider adding to that sleeve.

6. Apply drawdown protocol if portfolio-level losses hit thresholds.
My Big Caveat
I only have one caveat: this does not capture tail scenarios.
If AI disrupts deterministic SaaS (currently low probability but non-zero), or if a credit crisis freezes the PE take-private market, or if a new technology paradigm makes the entire framework obsolete, the strategy will fail. The drawdown protocol limits the damage, but it can’t prevent it.
Closing Thoughts
The SaaSpocalypse is either the beginning of a structural re-rating or a capitulation-driven overshoot. Both are possible and both require quite different responses. The framework I’ve laid out here is designed to profit from either scenario by maintaining multiple, partially hedged exposures across different sub-theses.
The key mental model is probabilistic, not deterministic (ironically enough, given Hypothesis 1). You’re not making one big call on SaaS. You’re making several small, calibrated bets across the distribution of outcomes, with explicit rules for when to add, when to cut, and when to walk away.
JP Morgan’s Q4 2025 Factor Views concluded that “the equity value factor remains attractive globally.” BofA called the selloff “an indiscriminate selloff” resembling the DeepSeek overreaction. The Jefferies trader who coined “SaaSpocalypse” also noted that “the pendulum has swung so far to the sell-everything side suggests there will be super-attractive opportunities.”
I’ll follow up with a data post running the actual screens once I have the numbers.
As always: Alpha is never guaranteed. And the backtest is a liar until proven otherwise.
The material presented in Math & Markets is for informational purposes only. It does not constitute investment or financial advice.