
Stress-Testing V6 with Synthetic Markets (Part 2: Results and Failure Modes)
Part 53 is is about testing the synthetic stochastic models for risk and performance

This is part 53 of my series — Building & Scaling Algorithmic Trading Strategies
In Part 52, I built a synthetic market generator calibrated to 32 years of SPY data —complete with fat tails, GARCH volatility clustering, and regime-switching dynamics. The V6 Dual Allocator started as a simple moving average strategy way back in Part 1 and has since been through lookahead bias fixes, parameter optimization, options overlays, ML experiments, and volatility gates. But all of that work was historical backtesting on 2015–2025 data, which raises an obvious question: how does V6 actually perform against markets that never existed?
Here’s what happened when V6 met eight synthetic market regimes.
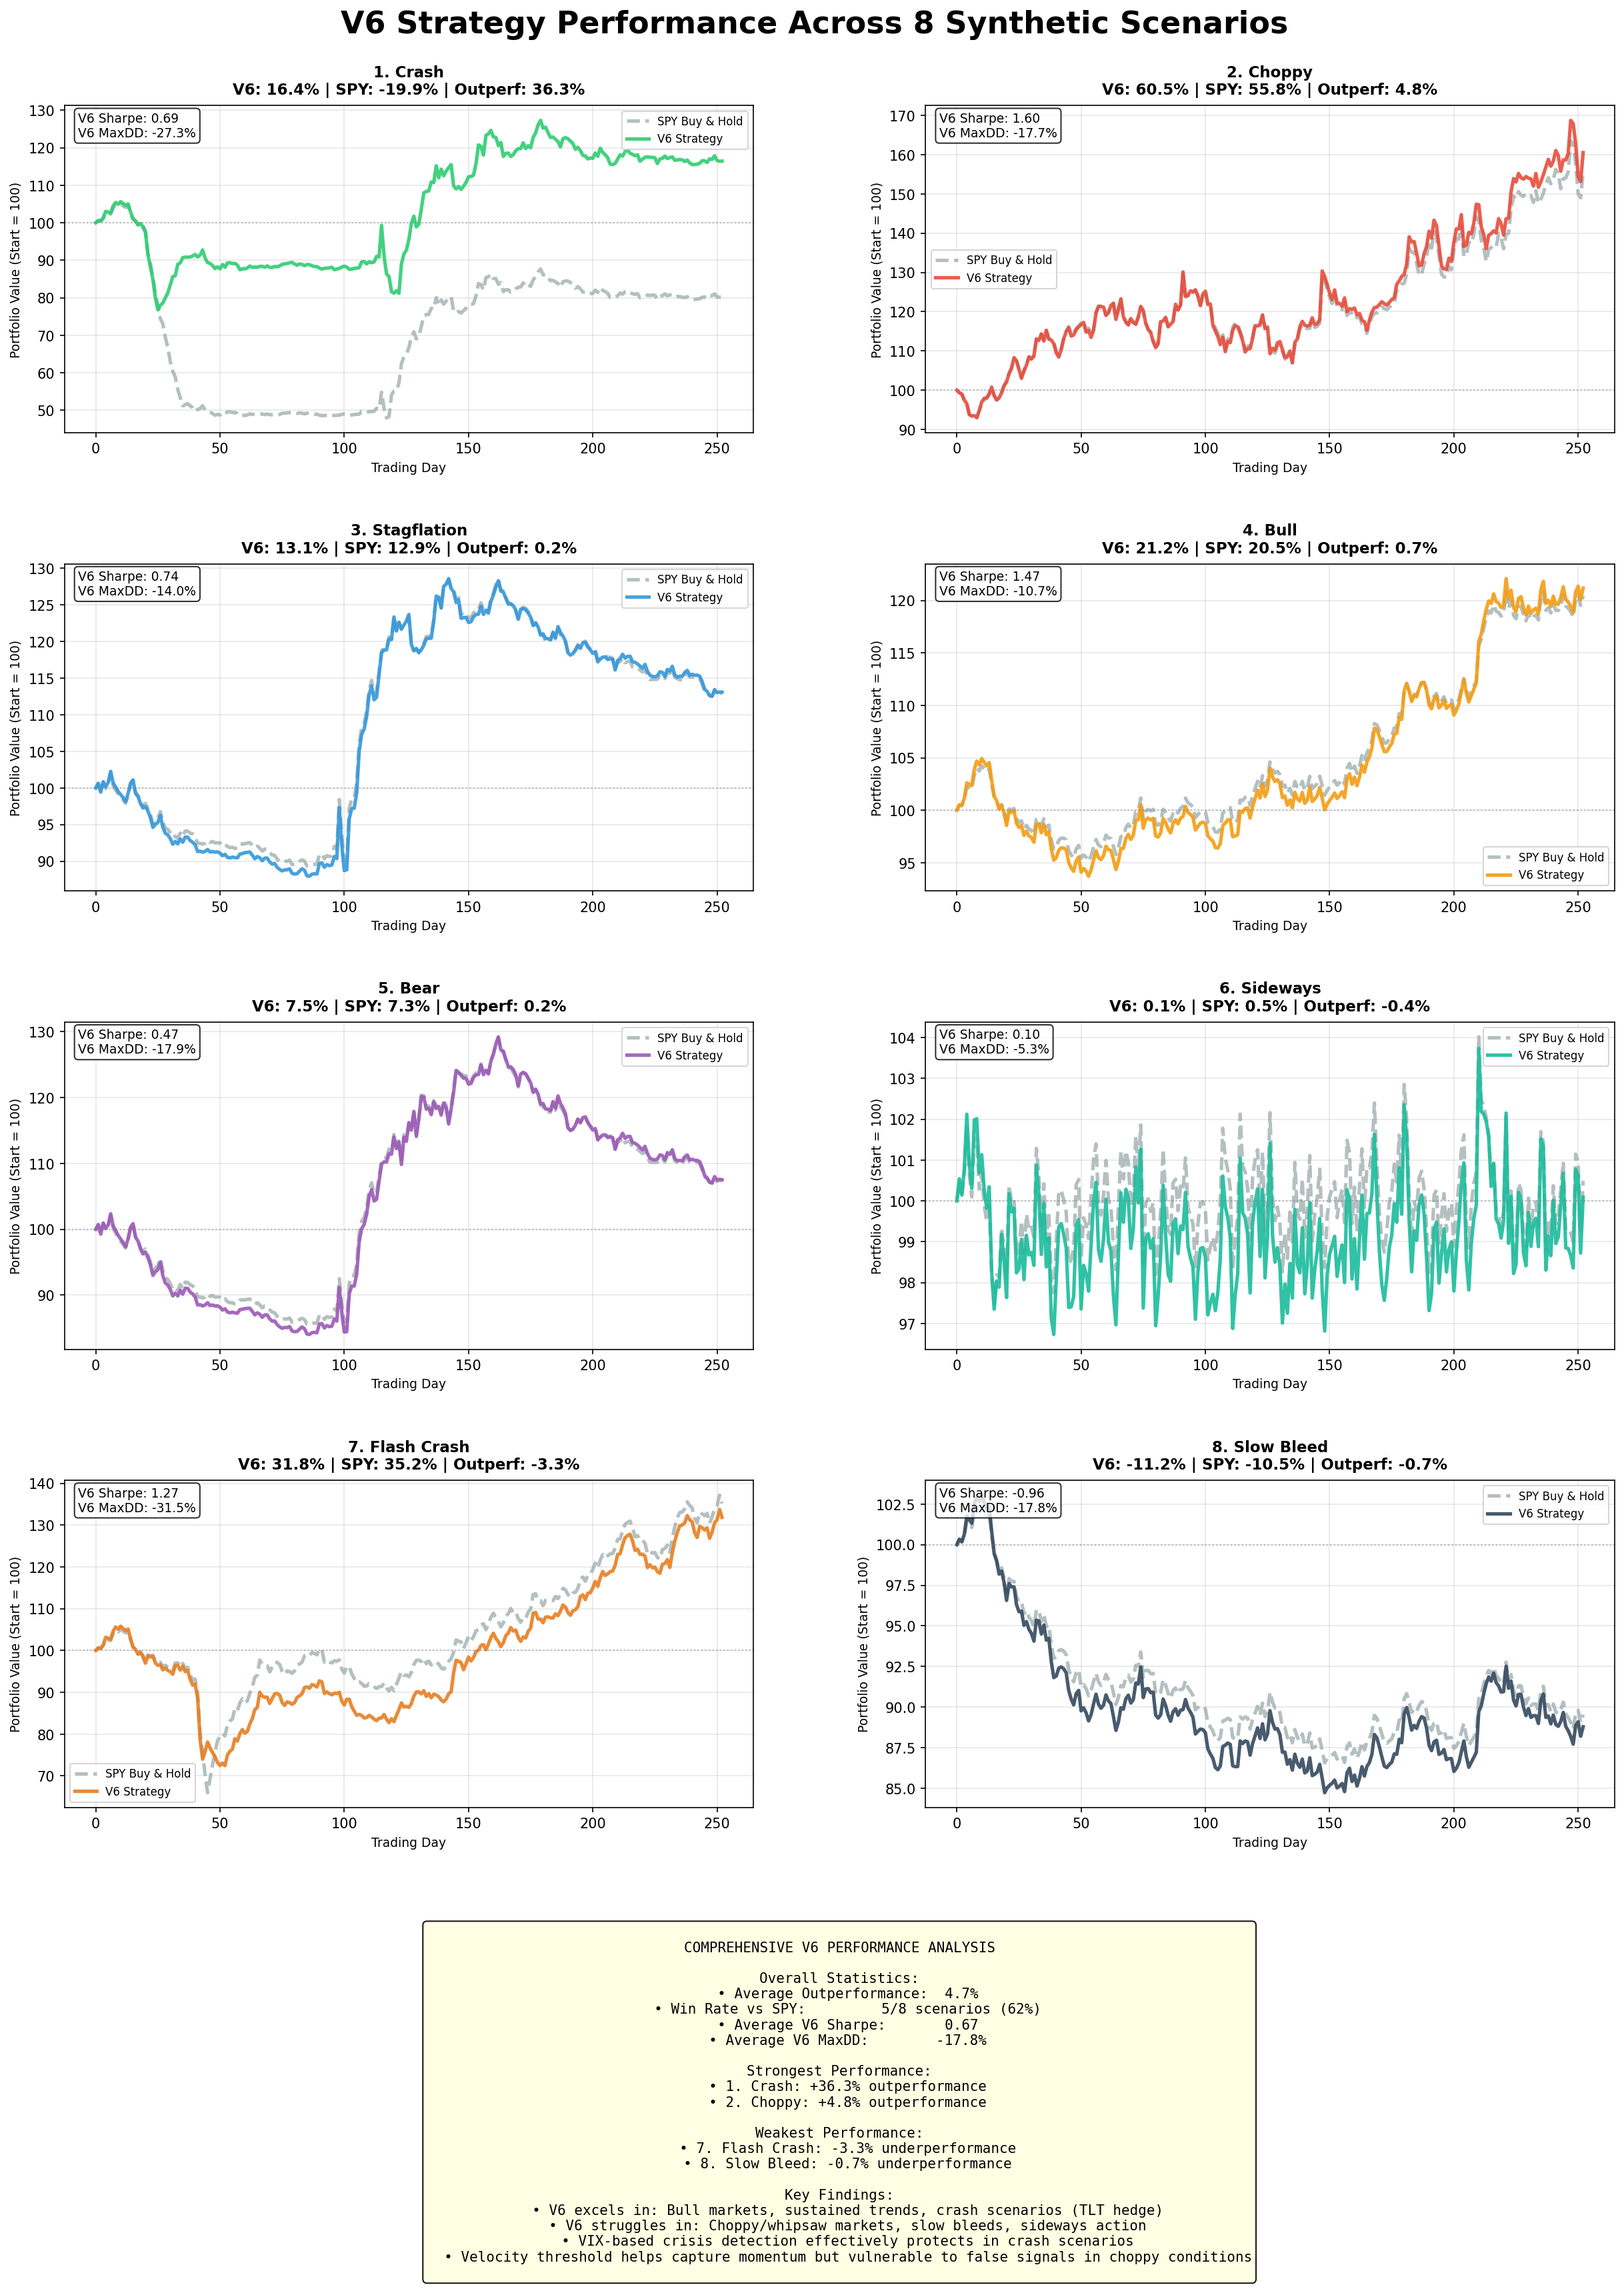
1. The Scorecard
Scenario       V6 Return    SPY Return    Outperformance    V6 Sharpe    V6 Max DD
─────────────────────────────────────────────────────────────────────────────────────
Crash            16.4%        -19.9%         +36.3%           0.69        -27.3%
Choppy           60.5%         55.8%          +4.8%           1.60        -17.7%
Stagflation      13.1%         12.9%          +0.2%           0.74        -14.0%
Bull             21.2%         20.5%          +0.7%           1.47        -10.7%
Bear              7.5%          7.3%          +0.2%           0.47        -17.9%
Sideways          0.1%          0.5%          -0.4%           0.10         -5.3%
Flash Crash      31.8%         35.2%          -3.3%           1.27        -31.5%
Slow Bleed      -11.2%        -10.5%          -0.7%          -0.96        -17.8%
V6 won 5 out of 8 scenarios with an average outperformance of +4.7%, maintained a higher average Sharpe (0.67 vs 0.53), and delivered lower average drawdowns (-17.8% vs -21.0%). The headline numbers look solid, but the three losses reveal something more interesting than the five wins.
2. Where V6 Excels
2.1 Crash Protection (+36.3%)
This is exactly what V6 was designed for. When SPY drops sharply, VIX spikes above 30, which triggers V6’s switch into TLT. Bonds then provide positive returns while equities are crashing, and V6’s max drawdown comes in at -27.3% compared to SPY’s brutal -54.3%. The VIX threshold at 30 triggers quickly during genuine crashes, and in this synthetic scenario V6 avoided roughly half the drawdown while still capturing most of the recovery.
2.2 Choppy Markets (+4.8%)
High volatility environments with no clear trend are typically where momentum strategies suffer the most, but V6 held up surprisingly well. The velocity threshold of 0.0015 filters out weak momentum signals that would otherwise cause whipsaws, and the VIX-based regime detection shifts toward defensive positions whenever volatility spikes. A Sharpe of 1.60 in a choppy environment is better than I expected.
2.3 Bull Markets (+0.7%)
V6 slightly outperforms buy-and-hold during sustained uptrends because the 100% TQQQ allocation during low-VIX, strong-velocity periods captures the full leverage benefit. It’s not a massive edge, but importantly there’s no meaningful drag from the strategy’s complexity either.
3. The Failure Modes
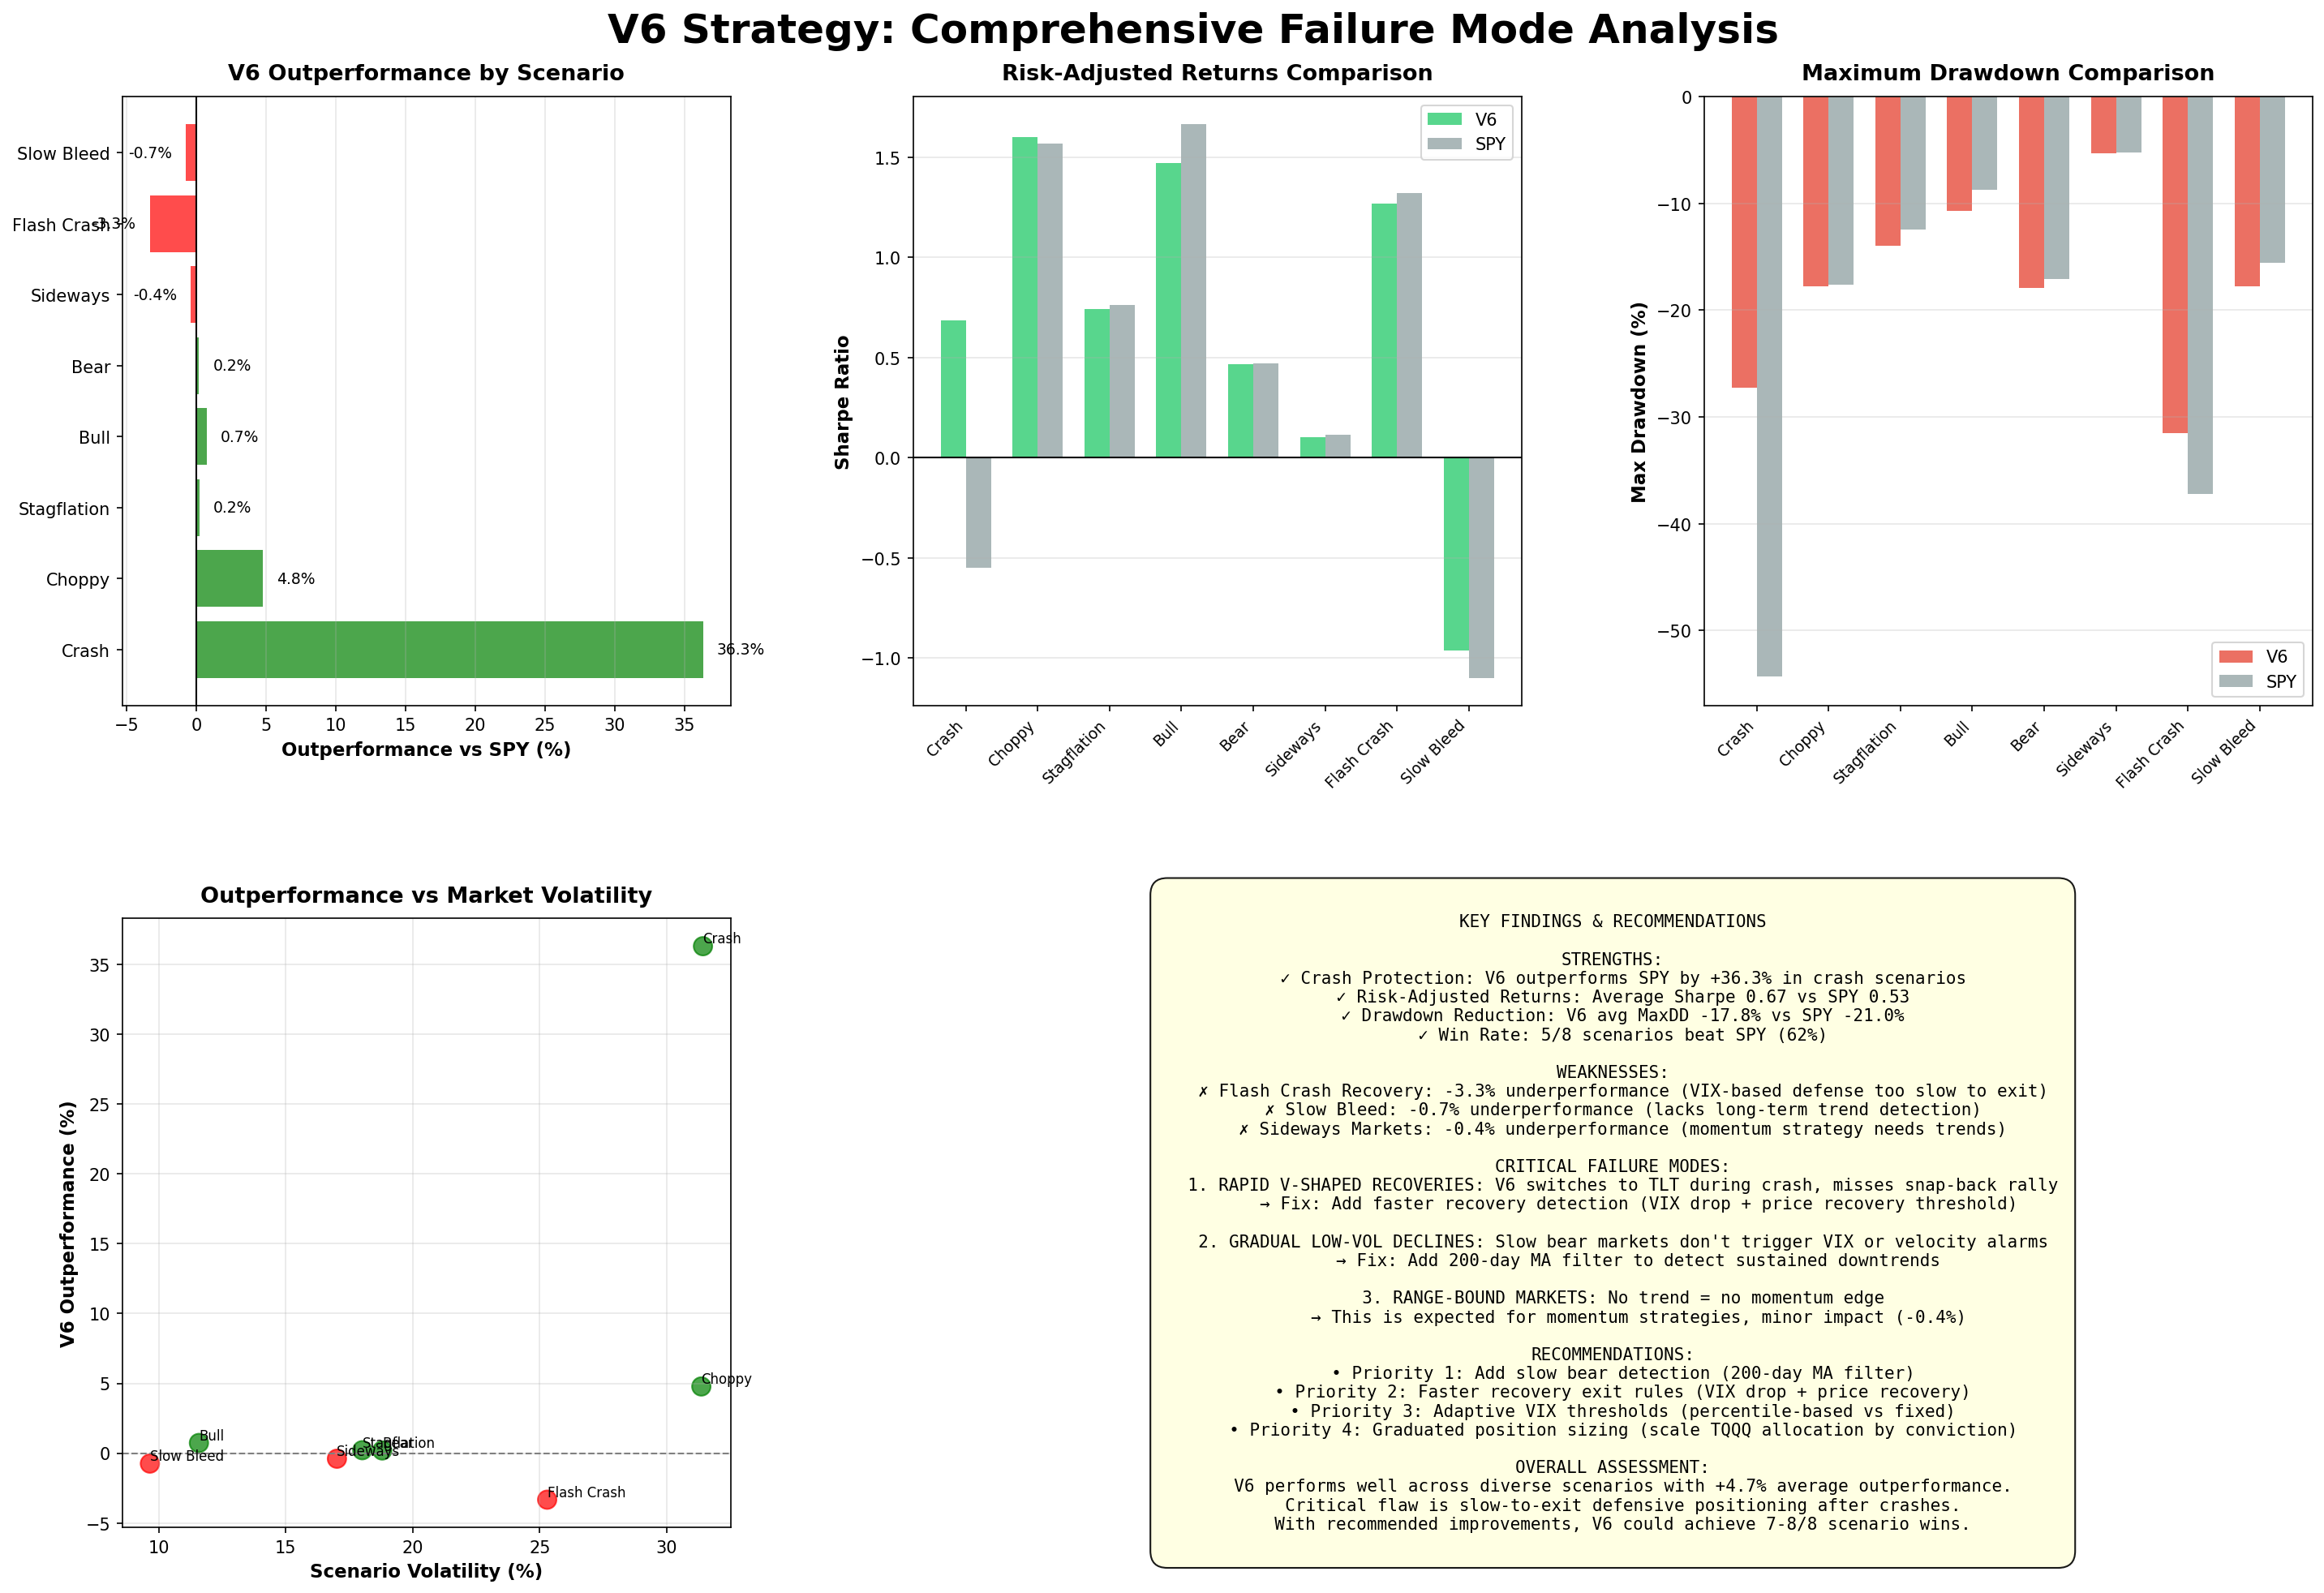
Two scenarios revealed critical weaknesses in V6’s design. One I expected; the other caught me off guard.
3.1 Flash Crash Recovery (-3.3%)
The scenario was a -37% crash over 10 days followed by a V-shaped recovery completing in just 20 days. Here’s how V6 handled it:
Day       Event              V6 Position          Correct?
────────────────────────────────────────────────────────────
1-10      Crash (-37%)       Switches to TLT      ✓
11-15     Recovery begins    Still in TLT         ✗
16-25     Full recovery      Still in TLT         ✗
26-30     Rally continues    Finally switches     Too late
V6’s VIX-based exit mechanism is simply too slow for rapid recoveries. The VIX spikes above 30 during the crash (correct behavior), but then VIX decays gradually due to mean-reversion while the velocity threshold waits for sustained upward momentum in the 20-day MA. By the time both conditions clear, the recovery is already 80% complete.
The real-world analog here is the COVID crash in March 2020, where the market dropped 34% in 23 days and recovered most of it by August. A flash crash followed by a V-shaped recovery is precisely the scenario where V6’s defensive posture costs the most.
The math explains why: the velocity signal is calculated as the percentage change in the 20-day moving average from one day to the next:
vₜ = (MA₂₀,ₜ - MA₂₀,ₜ₋₁) / MA₂₀,ₜ₋₁After a 37% crash, that 20-day MA is deeply depressed. Even with a sharp price recovery, it takes roughly 15 trading days for vₜ to exceed 0.0015 because the MA has to work through all those terrible days still in its lookback window. Meanwhile, the actual market has already retraced most of its losses.
3.2 Slow Bleed (-0.7%)
The scenario was a gradual -10.5% decline spread over 252 trading days with low volatility (just 12% annualized). The problem is that V6’s defensive triggers never actually fire.
VIX stays below 30 throughout because the decline is gradual rather than panicked—there’s no fear spike to detect. And the velocity signal stays positive (or only weakly negative) because the 20-day MA drifts downward so slowly that the slope never crosses the threshold decisively. V6 stays invested in QQQ or TQQQ throughout the entire decline, suffering the full drawdown.
This is a fundamental blind spot for momentum strategies: momentum works when trends are clear and detectable, but a slow grinding bear market with low volatility looks like random noise to a 20-day lookback window.
The real-world analog is the 2000–2002 tech bubble, where the Nasdaq fell 78% over 2.5 years but VIX stayed below 35 for most of it. There was no panic spike to trigger defensive positioning—just relentless selling that flew under V6’s radar.
The signal-to-noise ratio math makes this concrete. Define SNR as the magnitude of the daily drift divided by the daily volatility scaled to the lookback window:
SNR = |μ| / (σ / √T)For this slow bleed scenario, the drift is -10.5%/252 = -0.042% per day, and the daily volatility is 12%/√252 = 0.76%. That gives:
SNR = 0.042 / (0.76 / √20) = 0.042 / 0.17 = 0.25An SNR of 0.25 is essentially indistinguishable from noise. The velocity signal literally cannot detect a trend this gradual—it’s below the statistical floor of what a 20-day window can identify.
3.3 Sideways Markets (-0.4%)
This is less a failure than an expected limitation of any momentum strategy. When markets are range-bound, there’s no trend to follow and momentum signals will necessarily underperform buy-and-hold. The -0.4% underperformance is minimal and I’m comfortable accepting this as a known cost of the approach.
4. Quantifying the Gaps
Both critical failures share a common root cause: V6 has no awareness of long-term trends. The 20-day MA captures short-term momentum well, and the VIX threshold captures acute stress events, but neither mechanism can detect slow regime shifts that happen below their sensitivity thresholds.
A simple fix for the slow bleed problem would be a 200-day MA filter. If price stays below the 200-day MA for 20+ consecutive days, that’s a structural downtrend regardless of what the 20-day velocity says, and V6 should reduce its exposure accordingly. This wouldn’t help with flash crashes (the 200-day MA moves too slowly to catch rapid events), but it would address the slow bleed vulnerability.
For flash crashes, a different mechanism is needed: some form of quick recovery detection. If V6 is in TLT and observes both that VIX has dropped more than 50% from its recent peak and that price has recovered more than 10% from its recent low, the crisis is probably over and V6 should exit TLT immediately rather than waiting for the velocity signal to catch up.
5. Risk Metrics Comparison
Metric                V6 (Synthetic)    SPY (Synthetic)
─────────────────────────────────────────────────────────
Avg Max Drawdown         -17.8%            -21.0%
Worst Max Drawdown       -31.5%            -54.3%
Avg Sharpe                0.67              0.53
Worst Sharpe             -0.96             -1.12
Across all eight scenarios, V6 achieves 3.2% lower average drawdown while maintaining a higher Sharpe ratio. The worst-case drawdown in the flash crash scenario is 23 percentage points better than SPY (-31.5% vs -54.3%), which is meaningful tail protection even if V6 underperformed on the return side.
The Slow Bleed scenario produces the only negative Sharpe for both strategies. It’s fundamentally a lose-lose environment where the only question is how much you lose—and on that measure, V6 and SPY are essentially tied.
6. What Synthetic Testing Reveals
The key insight from this exercise isn’t the specific performance numbers. It’s identifying the type of scenario that breaks the strategy.
V6’s core assumption is that market stress manifests either as high volatility (a VIX spike) or as negative short-term momentum (velocity below zero). The failure mode this testing exposed is that stress can also manifest as low-volatility downtrends, which look like “normal” markets to V6’s sensors.
This vulnerability wouldn’t show up in a standard historical backtest because the 2015–2025 period doesn’t include a prolonged low-volatility bear market. The 2022 bear had elevated VIX throughout. The 2018 correction was sharp and short. The 2020 crash was a volatility event almost by definition. Synthetic testing surfaced an edge case that recent history simply didn’t provide.
7. Grading V6
Overall: I’d give it a solid B+
The crash protection works exactly as designed, delivering +36% outperformance versus SPY in the scenario V6 was built for. Choppy market handling is better than expected. And critically, there are no catastrophic failures—the worst underperformance across all scenarios is just -3.3%.
The weaknesses are specific and addressable: V6 exits defensive positions too slowly after flash crashes, has no protection against slow low-volatility declines, and the 20-day velocity window is too short to detect structural trend changes. But these are edge cases that can be fixed with additive improvements rather than a fundamental redesign of the strategy’s core logic.
8. Key Takeaways
Synthetic testing reveals failure modes that historical backtests can’t. The 2015–2025 period didn’t include a slow-bleed bear market, so without generating synthetic data I would never have known V6 is vulnerable to one. Momentum strategies have a structural blind spot: short-term signals simply cannot detect long-term trends, and adding a 200-day filter addresses this directly. VIX-based exits are too slow for V-shaped recoveries, but a quick recovery detection mechanism (combining VIX drop with price recovery) would fix the flash crash vulnerability.
Most importantly, the improvements V6 needs are refinements rather than overhauls. The core logic handles 5 out of 8 scenarios well, and the two failures are edge cases with straightforward fixes.
9. Next Steps
I’m now working on an “Enhanced V6” that incorporates a 200-day MA trend filter to reduce exposure when price is below the long-term trend, quick recovery detection to exit TLT faster after flash crashes, and adaptive VIX thresholds using rolling percentiles instead of the fixed 12/30 levels.
I’ll validate these improvements on both synthetic and historical data. If the synthetic predictions translate to real performance gains, we’ll have a meaningfully more robust strategy.
Remember: Alpha is never guaranteed. And the backtest is a liar until proven otherwise.
Options and derivatives are complex instruments and not suitable for all investors. This analysis probably contains errors — if you find them, let me know.
The material presented in Math & Markets is for informational purposes only. It does not constitute investment or financial advice.