
Spotting Value in the Rubble: A Quant Framework for SaaS
Part 76 — SaaS Series Part 2 of 4

This is part 76 of my series — Building & Scaling Algorithmic Trading Strategies
In Part 1, I mapped the SaaS landscape: a sector in secular growth deceleration, undergoing a violent re-rating driven by AI disruption fears, with $300 billion in market cap erased in 48 hours. The key insight was that the aggregate numbers hide a bimodal distribution — deterministic-system SaaS is holding up, while probabilistic-system SaaS is collapsing.
Today I want to build the analytical machinery to exploit that dispersion. The question isn’t “is SaaS cheap?” — it’s “what does cheap mean when the income statement might structurally change?”
This requires rethinking how we apply factor models to software companies. The standard toolkit breaks in instructive ways.
Why Traditional Value Metrics Fail in SaaS
Several years ago, I worked for a large institutional bank, where I setup the Data & Analytics business. One of the interesting things we explored was what we could do to inform asset valuations.
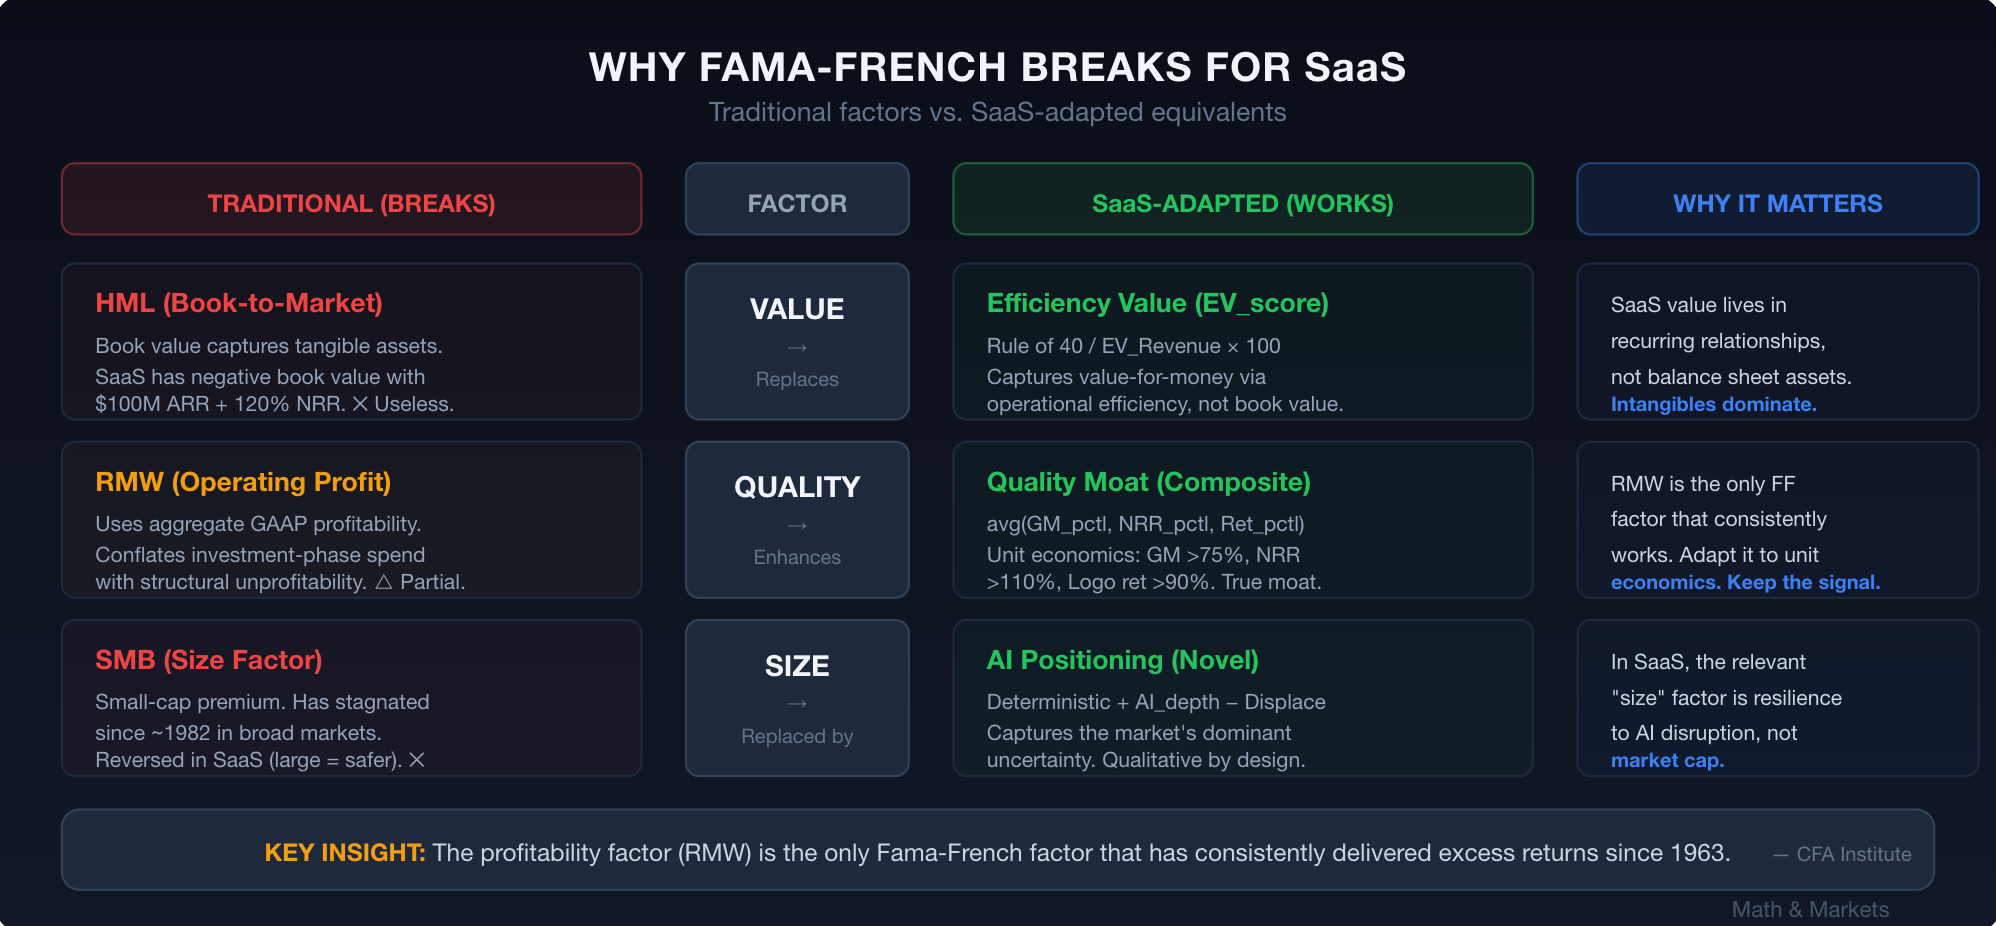
The Fama-French three-factor model (1993) introduced HML — High Minus Low — as the canonical value factor, measured by book-to-market ratio. Their five-factor extension (2015) added profitability (RMW) and investment (CMA). These factors explain over 90% of diversified portfolio returns, a massive improvement over CAPM’s ~70%.
But SaaS companies break the model in three specific ways:
1. Book value is meaningless. SaaS companies’ most valuable assets — recurring revenue relationships, proprietary data, network effects, switching costs — don’t appear on the balance sheet. R&D is expensed, not capitalized. Customer acquisition costs flow through the income statement. A SaaS company with $100M ARR at 120% NRR and 80% gross margins might have negative book value. Traditional HML would classify it as “growth” when it might actually be cheap on any economically relevant metric.
This isn’t a new critique. The CFA Institute’s 2022 analysis of the five-factor model concluded that “the HML factor has largely stagnated over the last 10-15 years,” partly because the modern economy’s value increasingly resides in intangible assets that book value doesn’t capture.
2. The profitability factor (RMW) is the real signal — but it needs modification. RMW — Robust Minus Weak, measuring operating profitability — is the one Fama-French factor that has “consistently delivered excess returns” across all time periods since 1963. For SaaS, this is the right intuition, but the implementation needs rework. SaaS profitability should be measured through unit economics (LTV/CAC, CAC payback, gross margin) rather than aggregate operating margins, because the latter conflates investment-phase spending with structural unprofitability.
3. Growth and value aren’t opposites in recurring revenue models. In traditional manufacturing, high growth often means low current profitability and vice versa. In SaaS, high NRR (Net Revenue Retention) simultaneously indicates growth and customer value — it means existing customers are buying more, which is the cheapest form of revenue. A company with 130% NRR is growing 30% annually from its installed base alone, at near-zero incremental acquisition cost. That’s value, not growth.
Reconstructing the Factor Model for SaaS
Given these limitations, I propose a modified four-factor model for SaaS equity returns. This isn’t novel theory — it’s an engineering exercise in mapping established factor premia to SaaS-native metrics.
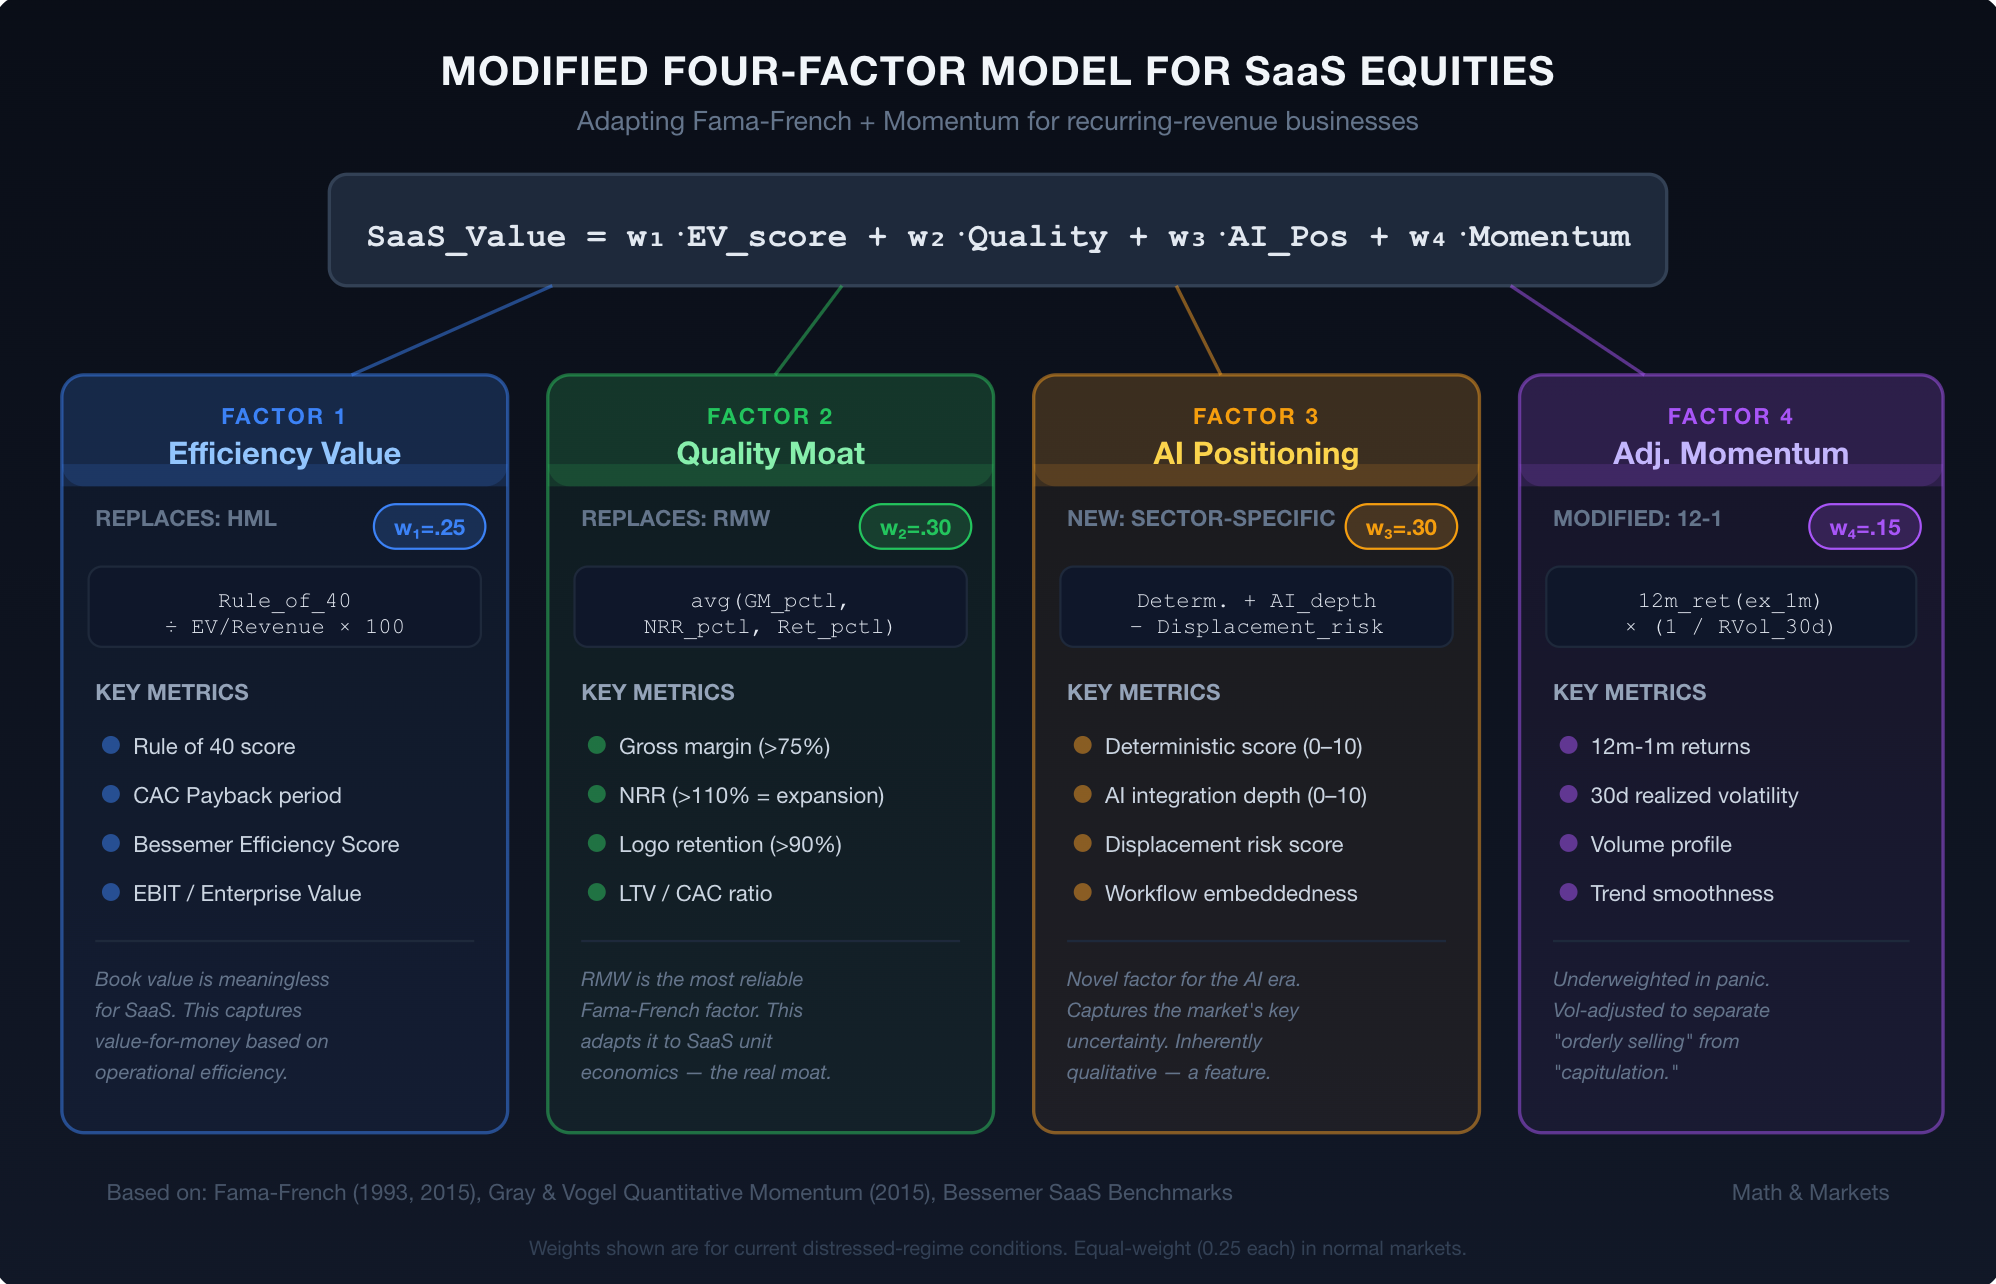
Factor 1: Efficiency Value (Replacing HML)
The Rule of 40 has become the industry’s de facto efficiency metric. It requires the sum of revenue growth rate + EBITDA margin ≥ 40%. Companies exceeding this threshold consistently command premium multiples.
But Rule of 40 is binary and crude. A better measure is what I’ll call Efficiency Value (EV_score):
EV_score = (Rule_of_40_score / EV_Revenue_Multiple) × 100This normalizes efficiency against what you’re paying for it. A company with a Rule of 40 score of 55% trading at 5x revenue has an EV_score of 11.0. A company at 40% trading at 10x has an EV_score of 4.0. The first is meaningfully cheaper per unit of efficiency.
Bessemer’s “Good, Better, Best” benchmarks provide the building blocks:
CAC Payback: 12-18 months (good), 6-12 months (better), 0-6 months (best)
Bessemer Efficiency Score (Net New ARR / Net Burn): <0.5x (good), 0.5-1.5x (better), 1.5x+ (best)
Net Revenue Retention: 100% (good), 110% (better), 120%+ (best)
Factor 2: Quality Moat (Replacing RMW)
Traditional RMW uses operating profitability. For SaaS, I’d replace this with a composite score built from:
Gross margin (>75% = high quality, reflects pricing power and delivery efficiency)
NRR (>110% = expansion, >120% = exceptional)
Logo retention (>90% = good, >95% = exceptional)
The formula:
Quality_Moat = (Gross_Margin_percentile + NRR_percentile + Logo_Retention_percentile) / 3Ranked against the SaaS universe, this gives you a 0-100 composite where high scores indicate businesses that retain customers, expand within accounts, and deliver software at high margins. These are the businesses where the recurring revenue model actually works as advertised.
Why does this matter for returns? Because NRR above 120% compounds. If you retain 120% of revenue annually, you’re doubling your revenue base from existing customers every ~3.8 years with zero new sales. That’s the closest thing to a guaranteed return in software investing, and it’s what makes SaaS quality fundamentally different from quality in other sectors.
Factor 3: AI Positioning (New Factor — Sector-Specific)
This is the novel factor in the current environment. Following the Bain framework from Part 1, I classify each SaaS company on two dimensions:
Deterministic score (0-10): How much does the product rely on precision, state management, compliance, and audit trails? High scores for ERP, financial systems, security. Low scores for content tools, basic analytics.
AI integration depth (0-10): How deeply has the company embedded proprietary AI into its product? Not “we have a chatbot” — genuine workflow-level AI that increases switching costs.
AI_Position = Deterministic_score + AI_Integration_depth - AI_Displacement_riskWhere AI_Displacement_risk captures the degree to which third-party AI tools (Claude, GPT, etc.) can replicate the core functionality. This is inherently subjective, which is a limitation I’ll address.
The SEG 2026 Report provides empirical backing: AI-referenced M&A targets commanded premiums, and sectors like Data Infrastructure (24.4x EBITDA) and DevOps (36.5x EBITDA) — both high on the deterministic + AI integration scale — far outperformed the broader software average.
Factor 4: Momentum (Modified 12-1)
The classic momentum factor — 12-month returns excluding the most recent month — remains relevant but needs careful application in the current environment. Research from Alpha Architect (Gray & Vogel, 2015) shows that “quality” momentum — smooth, consistent uptrends — outperforms “junky” momentum — volatile, whipsaw price action.
In the current SaaS selloff, momentum is almost universally negative. But the quality of that negative momentum varies enormously. A stock down 25% on steady selling over three months is different from a stock down 25% on a two-day panic. The former may have further to fall; the latter may be an overreaction.
I’d modify the momentum factor as:
Adjusted_Momentum = 12_minus_1_return × (1 / realized_volatility_30d)This penalizes volatile drawdowns and rewards (or at least less-penalizes) steady price action. In a capitulation environment, this helps you distinguish between “the market doesn’t like this” and “the market is panicking about this.”
Putting the Factors Together: A Screening Framework
Combining all four factors into a composite score:
SaaS_Value_Score = w1 × EV_score + w2 × Quality_Moat + w3 × AI_Position + w4 × Adj_MomentumThe weights (w1 through w4) are calibration parameters. In “normal” markets, I’d weight them roughly equally. In the current environment — dominated by AI disruption uncertainty and capitulation selling — I’d overweight Factor 3 (AI Positioning) and underweight Factor 4 (Momentum), since momentum signals are noisy during panics.
Suggested weights for current conditions:
w1 (Efficiency Value): 0.25
w2 (Quality Moat): 0.30
w3 (AI Position): 0.30
w4 (Adjusted Momentum): 0.15
What the Academic Literature Tells Us About Multi-Factor Approaches
The QVM (Quality, Value, Momentum) framework, backtested across 13 years by Quant Investing, “significantly outperformed both European and North American market indices, growing investments by over 10x.” The key insight from that research — start by excluding poor quality (negative free cash flow, low ROA, large cash-profit discrepancies), then layer value (earnings yield via EBIT/EV), then momentum — maps directly to the SaaS-adapted framework above.
Gray and Vogel’s “Quantitative Momentum” (2015) documented that systematic momentum investing has historically been “potentially more potent than value investing,” but with critical caveats: it’s 25%+ more volatile than passive equity investing, and career risk from tracking error deviation is extreme. In their backtests from 1927 to 2014, the top momentum decile dramatically outperformed — but the return path was violent.
This volatility concern is amplified in SaaS. The BVP Cloud Index has experienced drawdowns of 40%+ while the broader Nasdaq fell only 15%, because SaaS is inherently a high-beta sector (longer-duration cash flows, multiple-dependent pricing). Any factor strategy in SaaS needs to explicitly account for this.
J.P. Morgan’s Q4 2025 Factor Views noted that the “equity value factor remains attractive globally with an especially strong opportunity in the U.S.” and that “momentum is now generally aligned with the upward move of expensive stocks,” which “may indicate greater potential for a sharp momentum slide.” This supports the case for overweighting value and quality factors relative to momentum in the current environment.
The Fama-French research itself offers one more critical insight: the profitability factor (RMW) has been the single most reliable factor across all time periods. As the CFA Institute analysis concluded: “RMW is the single factor that has consistently delivered excess returns... going long high quality stocks and shorting their low quality counterparts has been a great investment strategy.” For SaaS, where profitability at the unit-economics level (not just the GAAP income statement) is the ultimate quality signal, this should anchor any systematic approach.
Practical Screening: What Falls Out
Without running the full model on live data (that’s an exercise for you, the reader, and also a future post), I can describe what the framework should surface in the current environment:
High SaaS_Value_Score characteristics:
Rule of 40 score above 40%, trading below 7x forward revenue
NRR above 115%, gross margins above 75%
Core product is deterministic (systems of record, compliance, financial workflows)
Active AI integration that enhances rather than cannibalizes the core product
Stock down 15-25% from recent highs but on lower-than-average volume (suggesting orderly selling, not capitulation)
Low SaaS_Value_Score characteristics:
Rule of 40 score below 30%, still trading above 5x forward revenue
NRR below 105%, gross margins below 70%
Core product is probabilistic (content generation, basic analytics, template workflows)
AI strategy is “we added a chatbot” — no proprietary model, no data moat
Stock down 30%+ on massive volume with insider selling
The framework should also flag false value traps — companies that look cheap on EV/Revenue but whose unit economics are deteriorating. A company at 3x revenue with declining NRR and rising churn is not cheap; it’s a melting ice cube being priced accordingly.
Limitations and Honest Caveats
Several things about this framework are uncomfortable:
Factor 3 (AI Positioning) is subjective. Deterministic vs. probabilistic classification requires qualitative judgment. This is a feature, not a bug — the market is mispricing precisely because it’s applying a blanket discount rather than doing this work — but it introduces analyst bias.
Historical backtests of multi-factor models in SaaS don’t exist at scale. The academic literature on factor investing covers broad equity markets, not sector-specific applications. We’re extrapolating from general principles, which works until it doesn’t.
Regime dependence. Multi-factor models can exhibit sharp underperformance during regime changes. The AI disruption narrative might represent exactly such a regime change, in which case factors calibrated on historical relationships could mislead.
Momentum crashes. The academic literature documents that momentum strategies experience severe crashes, particularly during market turns. A SaaS-focused momentum factor during the current selloff is especially treacherous.
These are real limitations. The framework is a starting point for systematic thinking, not a black box.
Update: Python Code for Updated Four-Factor Model
I pulled together a working Python implementation of the four-factor model.
Key things to note:
Regime detection auto-selects distressed weights (0.25/0.30/0.30/0.15) given the current IGV drawdown and elevated IV/RV ratio
FNSYS (financial systems of record archetype) scores highest at 85 — deterministic, profitable, reasonably priced
TMPL (template/design tool) scores lowest at 23 — high displacement risk, negative AI positioning
The Sleeve 3 convergence filter catches 5 names trading below the 4.5x PE floor, all hitting the Kelly cap at 5%
Full script: The complete implementation is available in saas_factor_model.py (link in the GitHub repo).
To use with real data, swap build_sample_data() for a DataFrame from Capital IQ / Bloomberg with the same column schema. The AI Positioning scores (deterministic, integration, displacement) are the one piece that requires manual judgment — which is the point.
All code is open source — use it, modify it, build on it. No guarantees about correctness or performance. Test everything yourself before deploying with real capital.
What’s Next
In Part 3, I’ll use this framework to propose three specific value hypotheses for the current SaaS environment — each with a clear thesis, the data that would confirm or invalidate it, and the timeframe for resolution.
In Part 4, I’ll structure these hypotheses into a multi-decision trading strategy with explicit entry/exit rules, position sizing, and risk management.
The model is only as good as your inputs. The framework gives you structure; the edge comes from doing the qualitative work on AI positioning that the market is currently too scared to do.
Disclaimer: This is analysis, not investment advice. Do your own work.
The material presented in Math & Markets is for informational purposes only. It does not constitute investment or financial advice.