
Satellite Port Monitoring: Scaling to 48 Ports and First Time Series Data
Part 42 talks about scaling the satellite port monitoring strategy and compiling time series data

This is part 42 of my series — Building & Scaling Algorithmic Trading Strategies
Yesterday, I posted about using free Sentinel-2 satellite imagery to monitor ship congestion at 32 global ports. Vancouver was #1 by density, Shanghai dominated volume, and the detection method worked at 97% of locations.
This is the follow-up. The network is now at 48 ports, and more importantly, we have time series data for five ports—actual before/after observations showing how activity changes over time.
What’s New Since Last Post
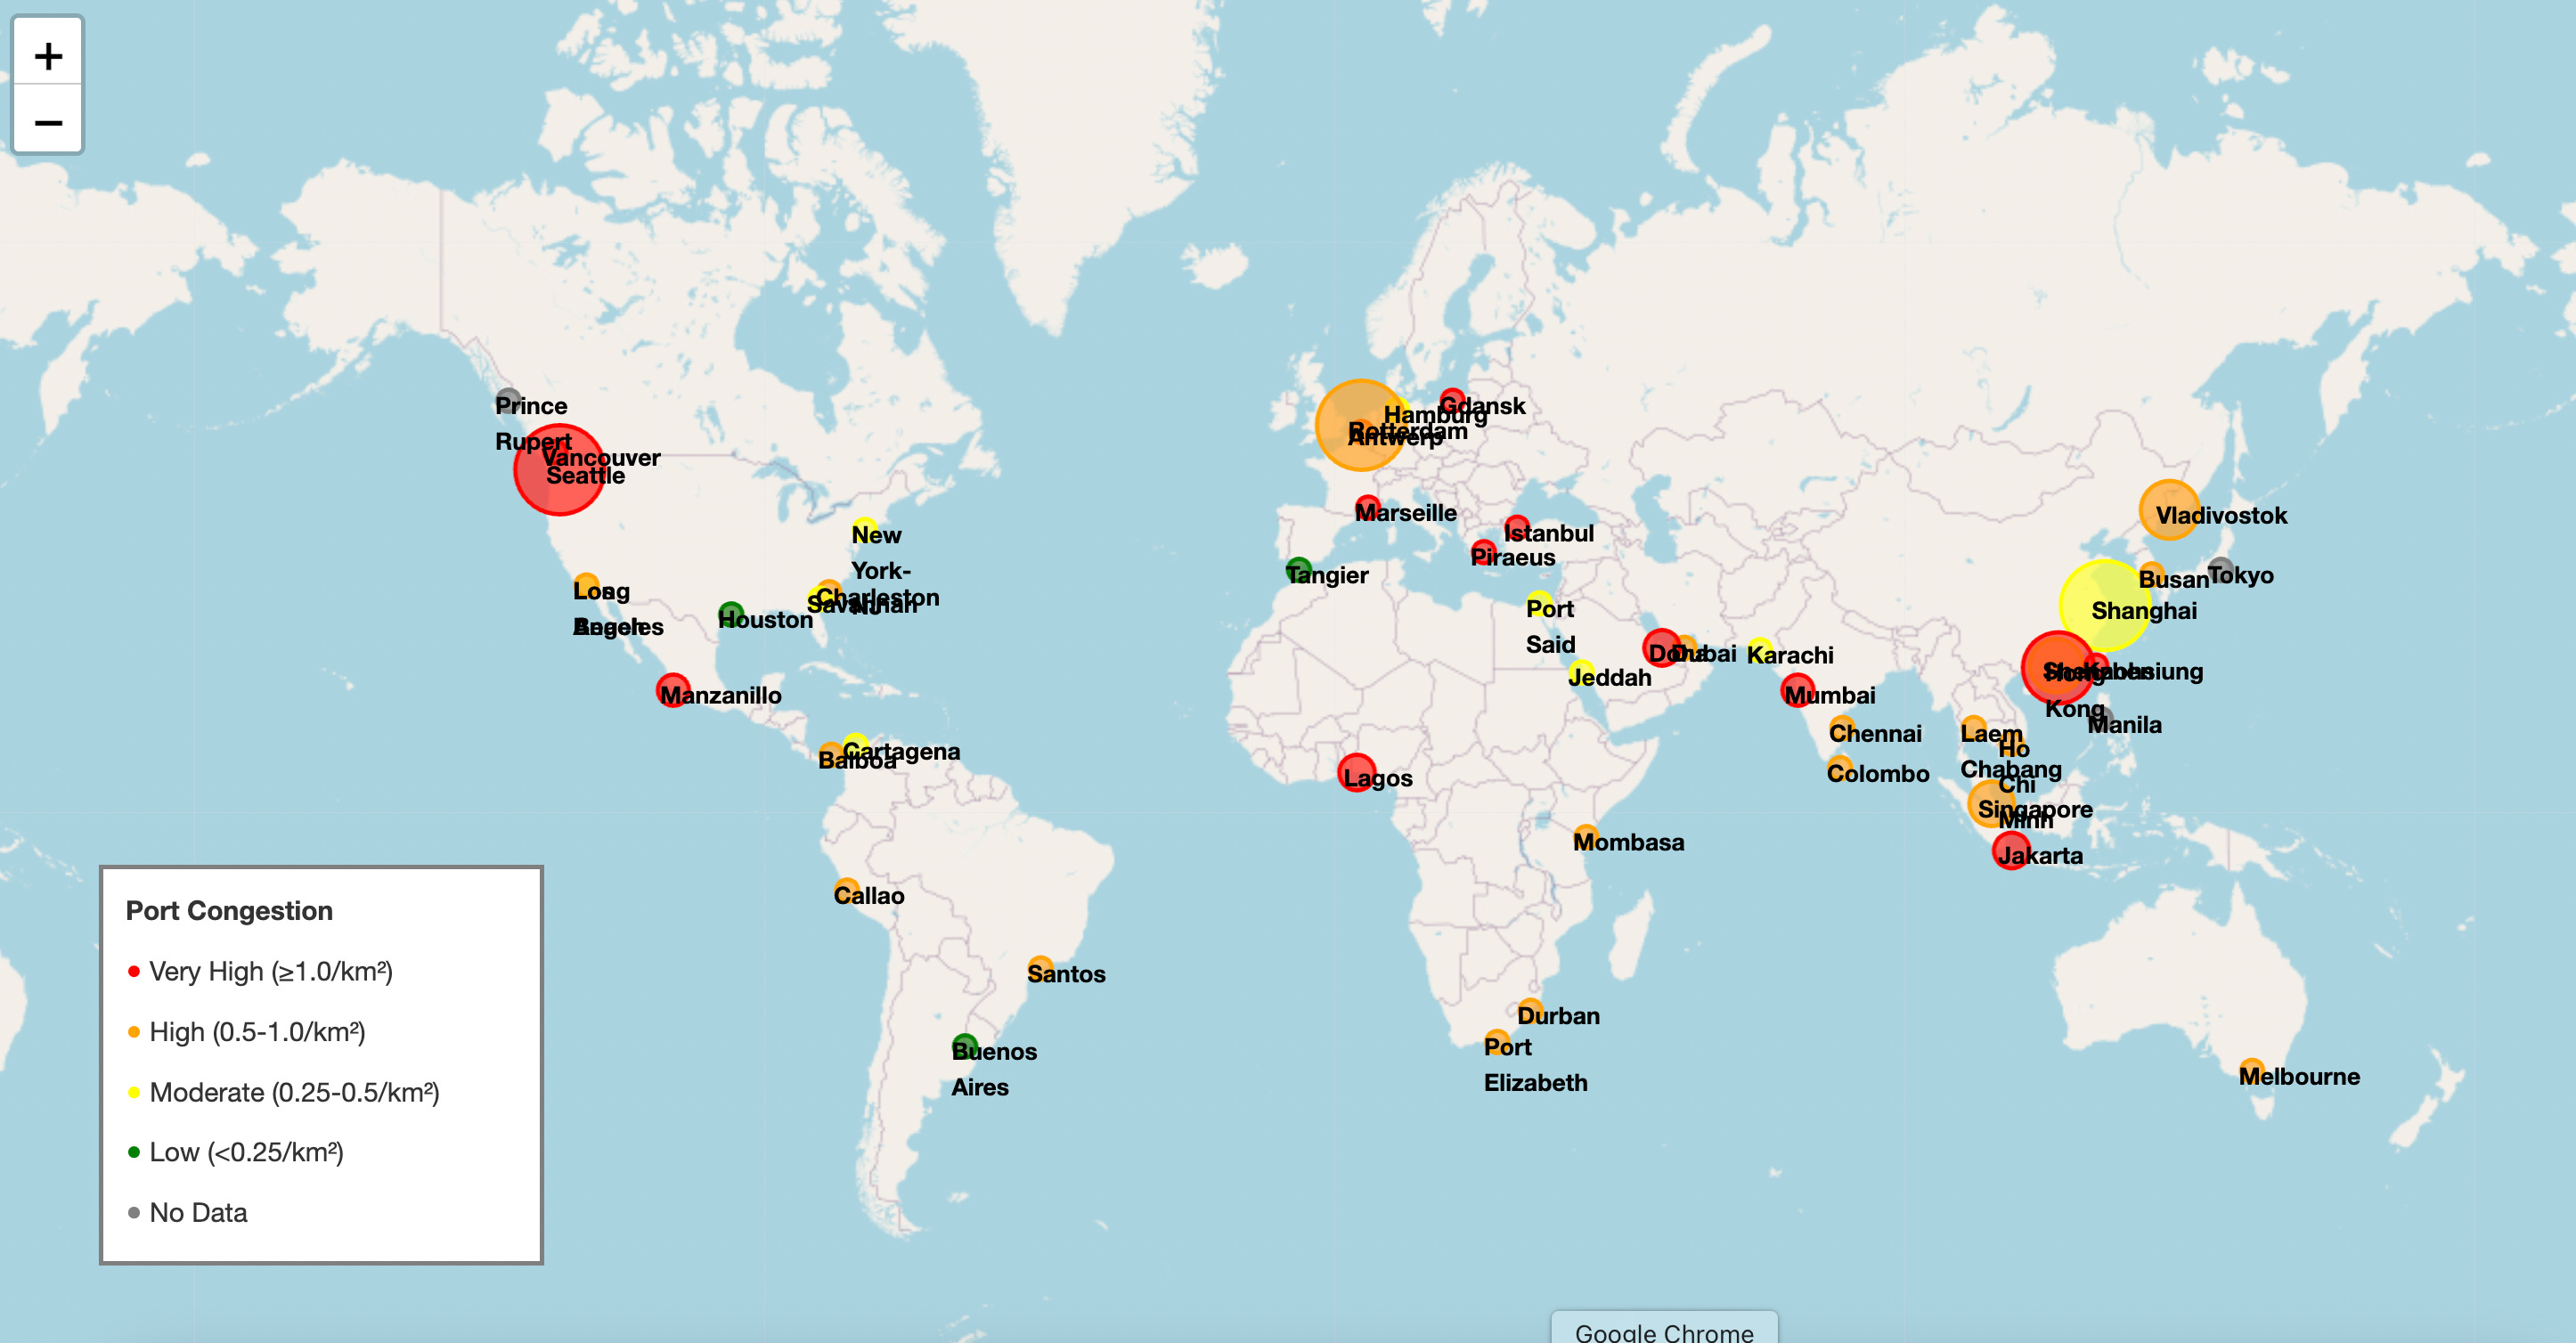
16 additional ports, bringing the total to 48:
New Ports Added:
────────────────────────────────────────────────────────
Europe: Marseille, Gdansk, Istanbul
Asia: Hong Kong, Kaohsiung, Colombo
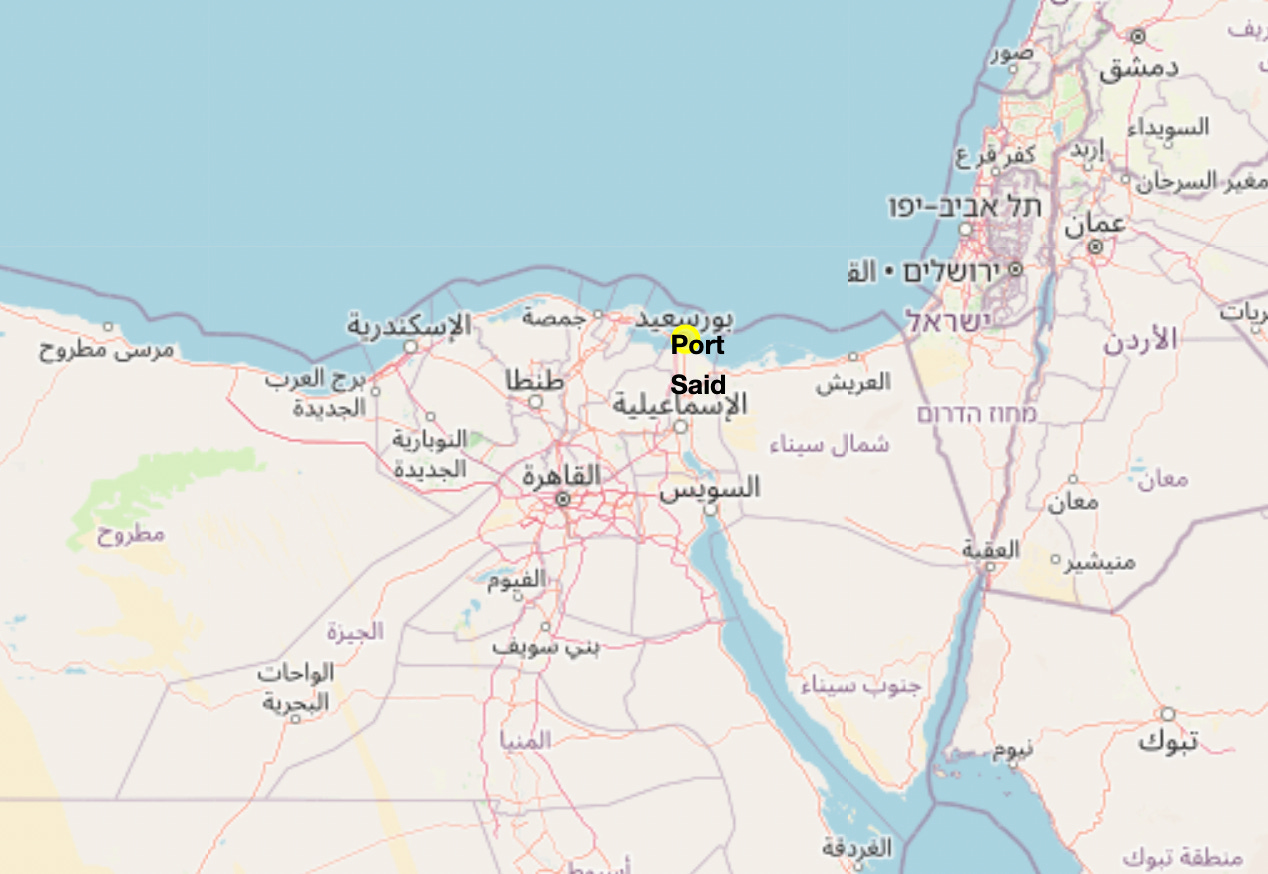
Middle East: Doha (Hamad), Port Said (Suez)
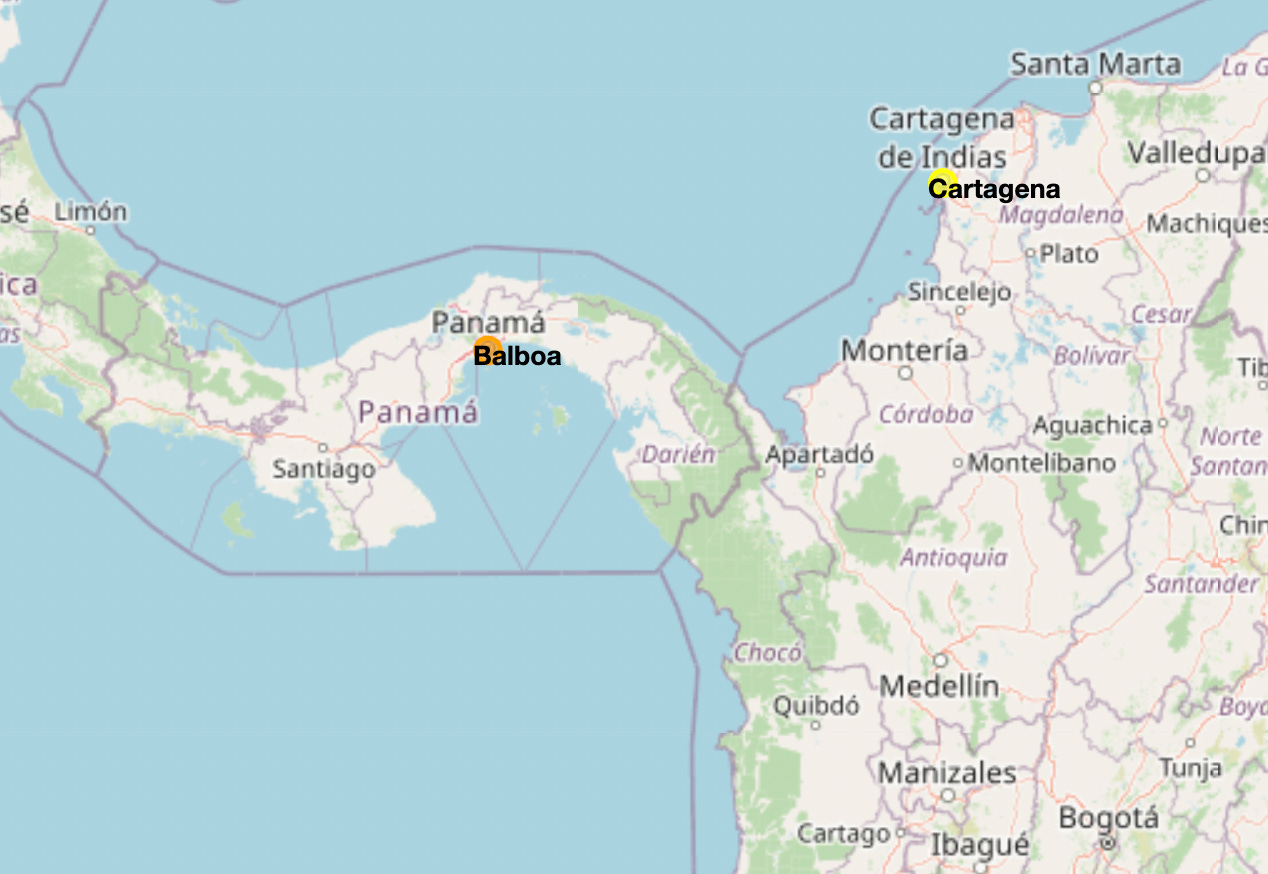
North America: Prince Rupert, Balboa (Panama Canal)
+ 6 others across regions
────────────────────────────────────────────────────────
Time series observations for 5 ports (2 data points each). This is the first glimpse at how congestion changes over time.
Chokepoint monitoring now covers all five critical maritime bottlenecks: Suez, Panama, Bosporus, Malacca, and Hormuz.
Updated Rankings: Two New Leaders
The expanded network reshuffled the top of the leaderboard:
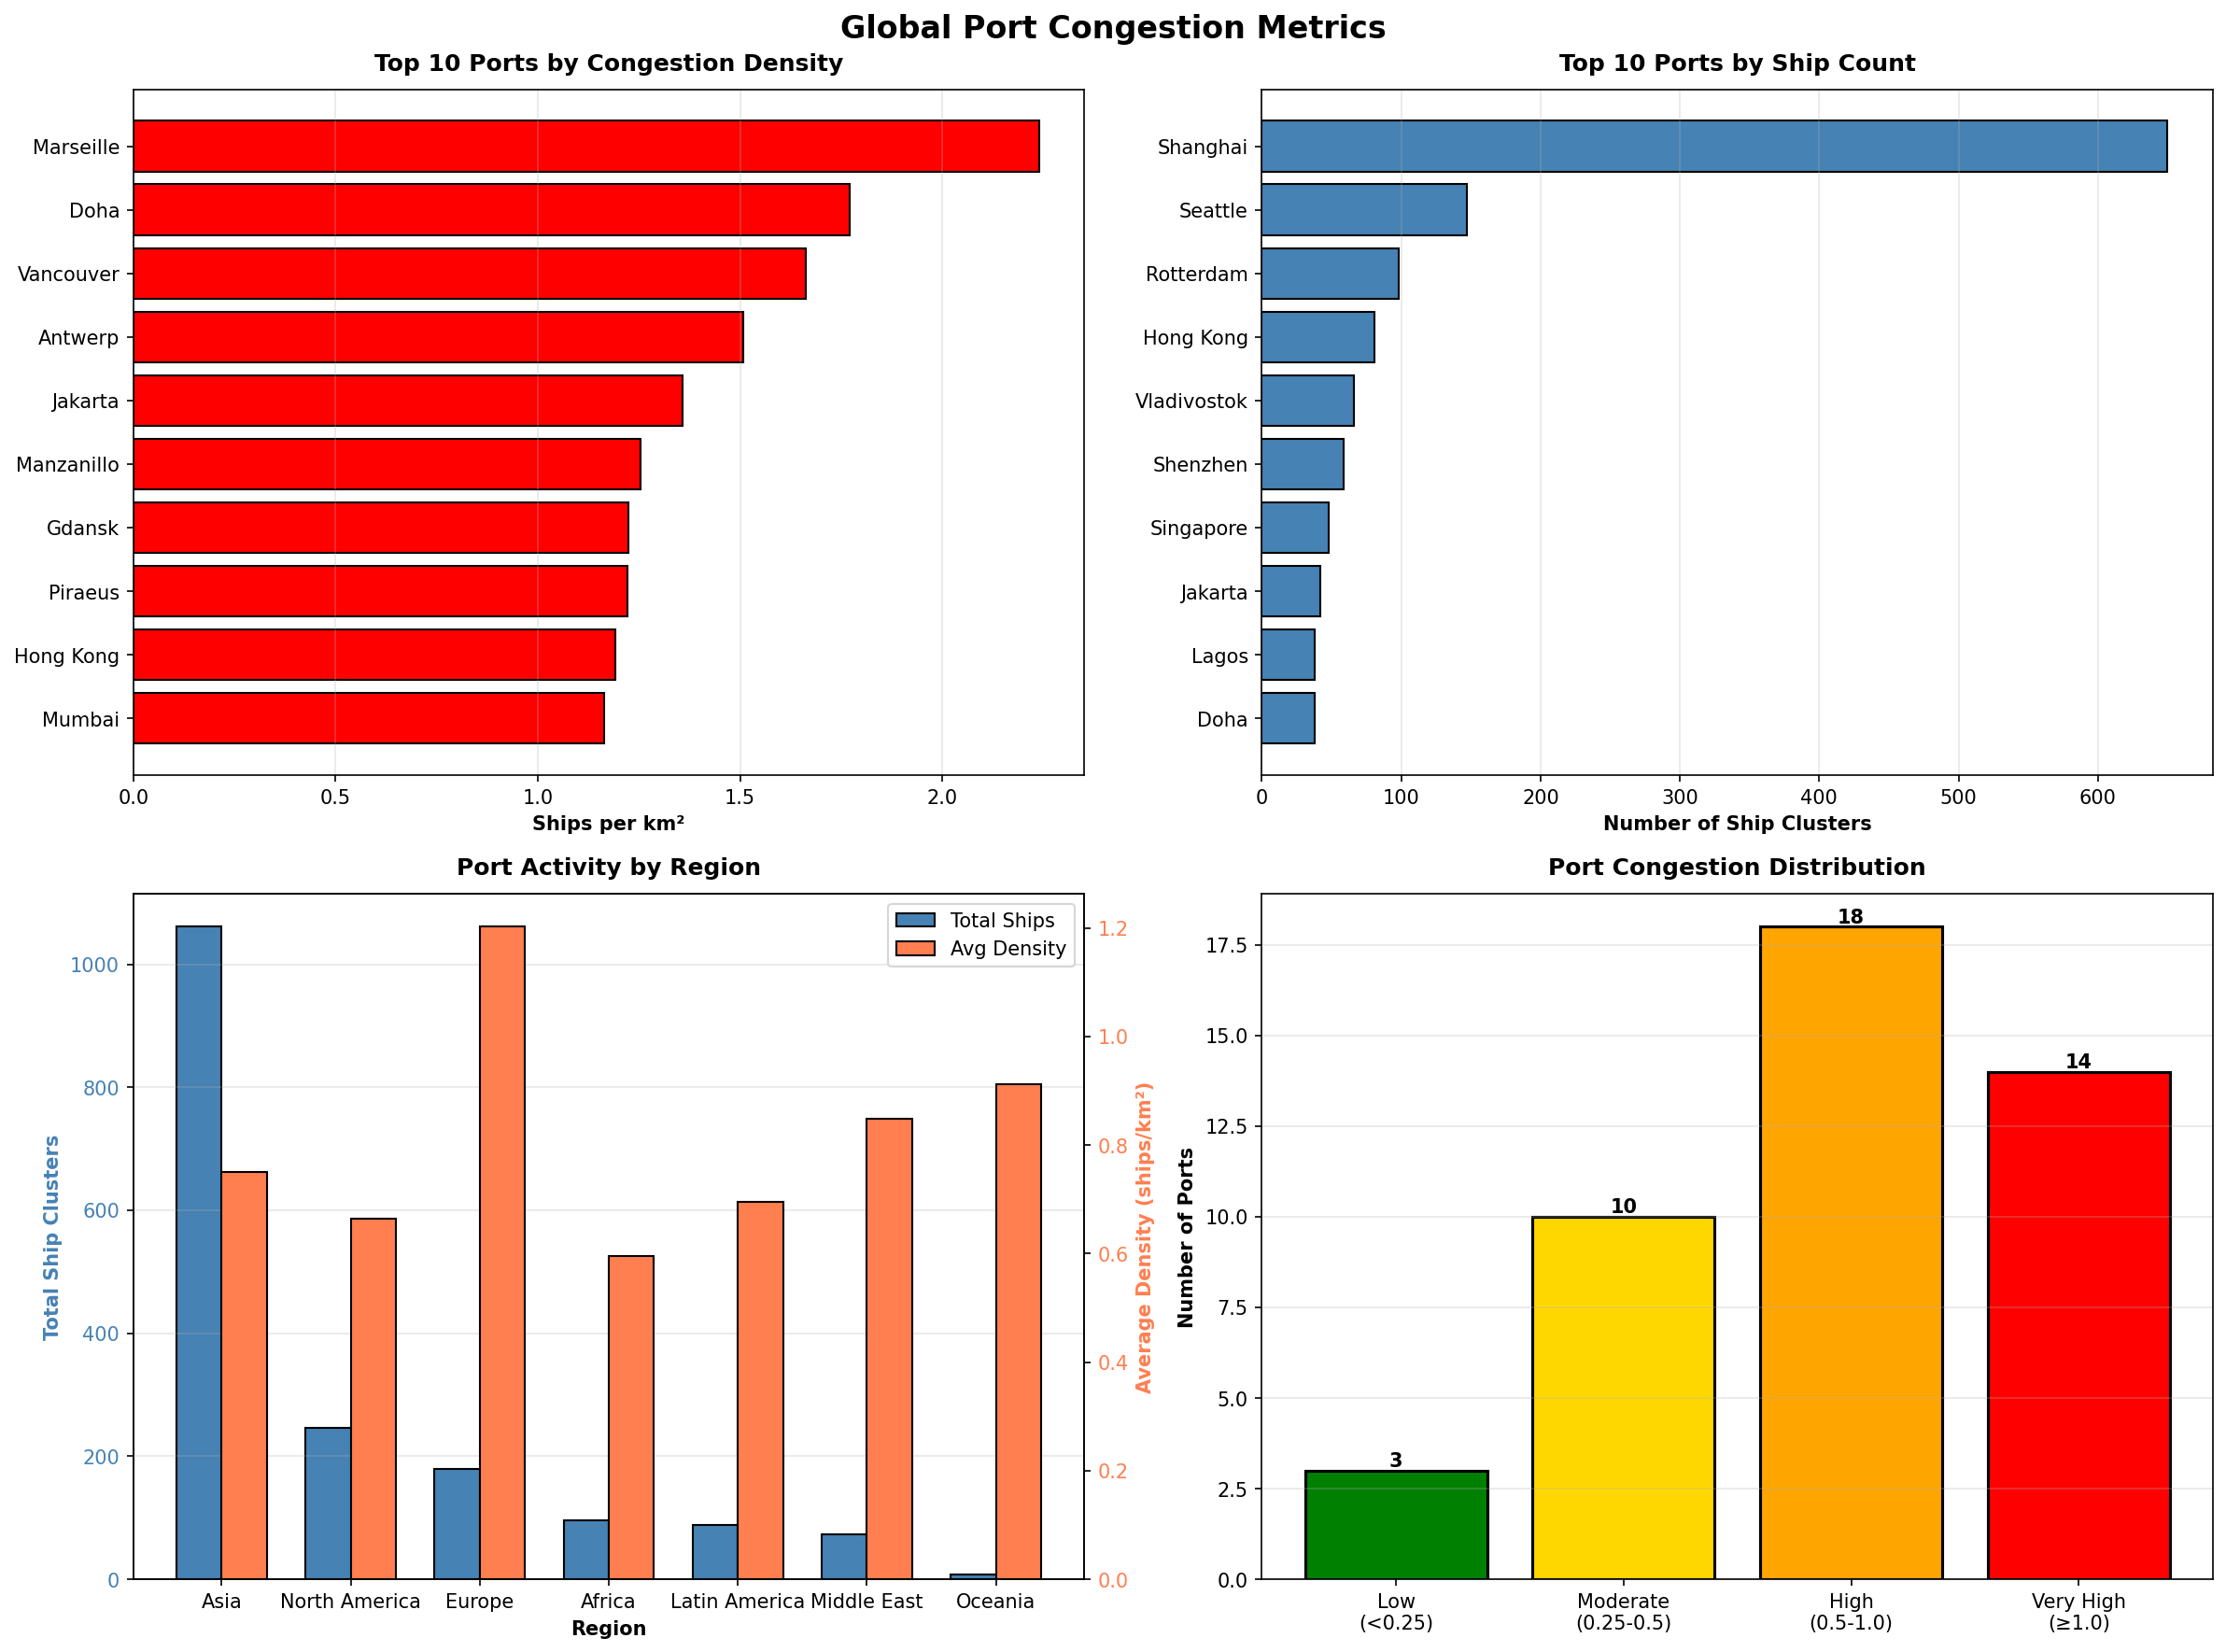
Top 10 by Congestion Density (Updated)
────────────────────────────────────────────────────────────
Rank  Port              Density     Ships   Change from 32-port
────────────────────────────────────────────────────────────
 1    Marseille         2.24/km²      12    NEW - #1
 2    Doha              1.77/km²      38    NEW - #2
 3    Vancouver         1.66/km²      16    was #1
 4    Antwerp           1.51/km²       3    was #2
 5    Jakarta           1.36/km²      42    was #3
 6    Manzanillo        1.25/km²      33    was #4
 7    Gdansk            1.22/km²      16    NEW
 8    Piraeus           1.22/km²       4    was #5
 9    Hong Kong         1.19/km²      81    NEW
10    Mumbai            1.16/km²      37    was #6
────────────────────────────────────────────────────────────
Marseille at 2.24 ships/km² is the new density leader—34% higher than Vancouver. That’s a Mediterranean port I hadn’t been tracking. Doha (Qatar’s main port) came in at #2 with 1.77/km².
The previous top 5 (Vancouver, Antwerp, Jakarta, Manzanillo, Piraeus) all dropped 2 ranks but their numbers didn’t change—they just got leap-frogged by new additions.
By volume, Shanghai extended its lead:
Top 5 by Ship Count (Updated)
────────────────────────────────────────────────────────────
Rank  Port              Ships    Previous   Change
────────────────────────────────────────────────────────────
 1    Shanghai           650       418      +232 (+55%)
 2    Seattle-Tacoma     147       147      unchanged
 3    Rotterdam           98       153      -55 (-36%)
 4    Hong Kong           81       n/a      NEW
 5    Vladivostok         66        66      unchanged
────────────────────────────────────────────────────────────
Shanghai jumped from 418 to 650 ships between observations. Rotterdam dropped from 153 to 98. These aren’t just new ports—these are real changes over time.
Time Series: The Interesting Part
Five ports now have two observations each. This is thin data, but it’s the first look at dynamics rather than snapshots.
Shanghai: +55% in 5 days
Nov 28:  418 ships, 0.30/km²
Dec 3:   650 ships, 0.41/km²
Change:  +232 ships (+55%)
A 55% jump in ship count at the world’s busiest port is significant. Possible explanations: year-end export push ahead of Chinese New Year, inventory restocking by Western retailers, or just measurement variation. Need more data points to know which.
Rotterdam: -36% over ~2 months
Sep 29:  153 ships, 1.11/km²
Dec 3:    98 ships, 0.71/km²
Change:  -55 ships (-36%)
Europe’s main gateway down by a third. This is consistent with soft European demand, but the Sep-Dec comparison spans seasonal effects. Year-over-year would be cleaner.
Tangier-Med: -70% in 5 days
Nov 28:  20 ships, 0.54/km²
Dec 3:    6 ships, 0.16/km²
Change:  -14 ships (-70%)
Sharp drop at Morocco’s Mediterranean hub. Could be temporary (weather, operational) or signal weakening Atlantic-Med trade. Worth watching.
Dubai (Jebel Ali): Stable
Nov 28:  13 ships, 0.68/km²
Dec 3:   16 ships, 0.68/km²
Change:  +3 ships, density unchanged
Gulf traffic holding steady. No drama.
Port Said (Suez Canal): Resumed from zero
Nov 30:  0 ships, 0.00/km²
Dec 3:   5 ships, 0.49/km²
Change:  +5 ships
Suez showed zero ships on Nov 30, then 5 on Dec 3. This is actually useful—it shows the system detects genuine low-activity periods and their recovery. The Nov 30 zero wasn’t a detection failure; it was real.
Chokepoint Status: All Clear
The expanded network now covers all five critical maritime chokepoints:
Chokepoint            Port           Ships  Density   Status
────────────────────────────────────────────────────────────────
Suez Canal            Port Said         5   0.49/km²  OPERATIONAL
Panama Canal          Balboa            5   0.62/km²  OPERATIONAL
Bosporus Strait       Istanbul         27   1.05/km²  OPERATIONAL
Strait of Malacca     Singapore        48   0.61/km²  OPERATIONAL
Strait of Hormuz      Dubai            16   0.68/km²  OPERATIONAL
────────────────────────────────────────────────────────────────
No visible disruptions. Istanbul (Bosporus) has the highest density at 1.05/km²—Black Sea trade flowing despite the war.
The Suez zero-to-five transition is worth noting. It shows the chokepoint isn’t continuously saturated; traffic is episodic. A sustained zero reading would be the signal to watch for.
Regional Update
Region           Ports  Ships   Avg Density  vs 32-port
────────────────────────────────────────────────────────────────
Asia               16   1,061    0.75/km²    +323 ships (Shanghai surge)
Europe              7     180    1.20/km²    unchanged (Rotterdam decline offset)
North America       9     246    0.67/km²    +18 ships
Middle East         4      73    0.85/km²    NEW (Doha, Port Said added)
Latin America       6      88    0.70/km²    +8 ships
Africa              5      96    0.60/km²    -1 ship
Oceania             1       7    0.91/km²    unchanged
────────────────────────────────────────────────────────────────
Europe now has the highest average density (1.20/km²) despite lower volume than Asia. European ports are running closer to capacity—more ships packed into less space.
Asia’s total jumped from 738 to 1,061 ships, almost entirely from the Shanghai surge (+232) plus new ports (Hong Kong +81, Kaohsiung +6).
Trading Implications: Getting More Concrete
In the last post I outlined potential asset linkages. With time series data, we can start forming testable hypotheses.
Hypothesis 1: Shanghai as China Export Leading Indicator
Shanghai +55% in 5 days. If this reflects real export activity (not measurement noise):
What to test:
Does Shanghai ship count lead China Caixin Manufacturing PMI by 2-4 weeks?
Does it correlate with container shipping rates (Freightos Baltic Index)?
Does it predict US import data (which lags by 4-6 weeks)?
Potential trades if validated:
Long container shipping (ZIM, Maersk) when Shanghai congestion rises
Long industrial metals (copper, aluminum) as manufacturing proxy
Short USD/CNH when export surge supports RMB
Hypothesis 2: Rotterdam as European Demand Barometer
Rotterdam -36% over 2 months. If this reflects genuine demand weakness:
What to test:
Does Rotterdam correlate with Eurozone Manufacturing PMI?
Does it lead German IFO Business Climate?
Does it predict EUR/USD moves?
Potential trades if validated:
Underweight European equities when Rotterdam congestion declines
Short EUR/USD on sustained Rotterdam weakness
Avoid European consumer discretionary
Hypothesis 3: Density Divergence as Freight Rate Signal
Europe density rising (1.20/km²) while volume falls. Asia volume rising while density moderate. This divergence matters.
Logic:
Rising density at constant volume = capacity constraint = upward pressure on rates
Rising volume at constant density = efficient scaling = stable rates
What to test:
Does density/volume ratio predict regional freight rate changes?
Do ports crossing 1.5 ships/km² see rate spikes?
Hypothesis 4: Chokepoint Risk Premium
All chokepoints operational. Market may be pricing disruption risk that isn’t materializing.
What to test:
Compare satellite chokepoint data against shipping rate risk premiums
When satellite shows clear passage but rates embed risk premium → fade the premium
Hypothesis 5: Mediterranean Cluster
Marseille (2.24), Istanbul (1.05), Piraeus (1.22) all running hot. Mediterranean trade corridor more active than Northern Europe.
What to test:
Southern European GDP vs Northern European GDP
Med shipping routes vs Atlantic routes
Tourism-driven import patterns
What Still Needs Work
Time series is thin. Five ports × 2 observations = 10 data points. Not enough to fit any model. Need 12+ months of weekly data.
Seasonal effects confound. Rotterdam Sep vs Dec comparison mixes signal with seasonality. Year-over-year comparisons needed.
No validation against AIS. I’m counting bright clusters. Without Automatic Identification System cross-reference, I don’t know true positive rate.
Lead-lag structure unknown. Does port data lead economic releases by 2 weeks? 6 weeks? The answer determines tradability.
Three ports still broken. Tokyo, Manila, Prince Rupert showing zero — polygon issues to fix.
Summary: 32 → 48 Ports
Metric                    32-Port      48-Port      Change
────────────────────────────────────────────────────────────────
Ports monitored              32           48        +16
Active ports                 31           45        +14
Detection rate            96.9%        93.8%       -3.1pp
Total ships               ~1,150       1,751       +52%
Avg density             0.79/km²     0.79/km²     unchanged

Top density             Vancouver    Marseille    NEW LEADER
                         1.66/km²     2.24/km²

Top volume              Shanghai     Shanghai     +55%
                           418          650

Chokepoints monitored        0            5        NEW
Ports with time series       0            5        NEW
────────────────────────────────────────────────────────────────
The network scaled, the time series data is emerging, and the chokepoints are covered. I feel that the infrastructure now supports the correlation analysis to see if any of this is tradeable!
My next priority is to automate weekly downloads and start building the historical dataset needed for backtesting.
The imagery is free. The alpha is not guaranteed. As always, the backtest is a liar until proven otherwise.
The information presented in Math & Markets is not investment or financial advice and should not be construed as such.