
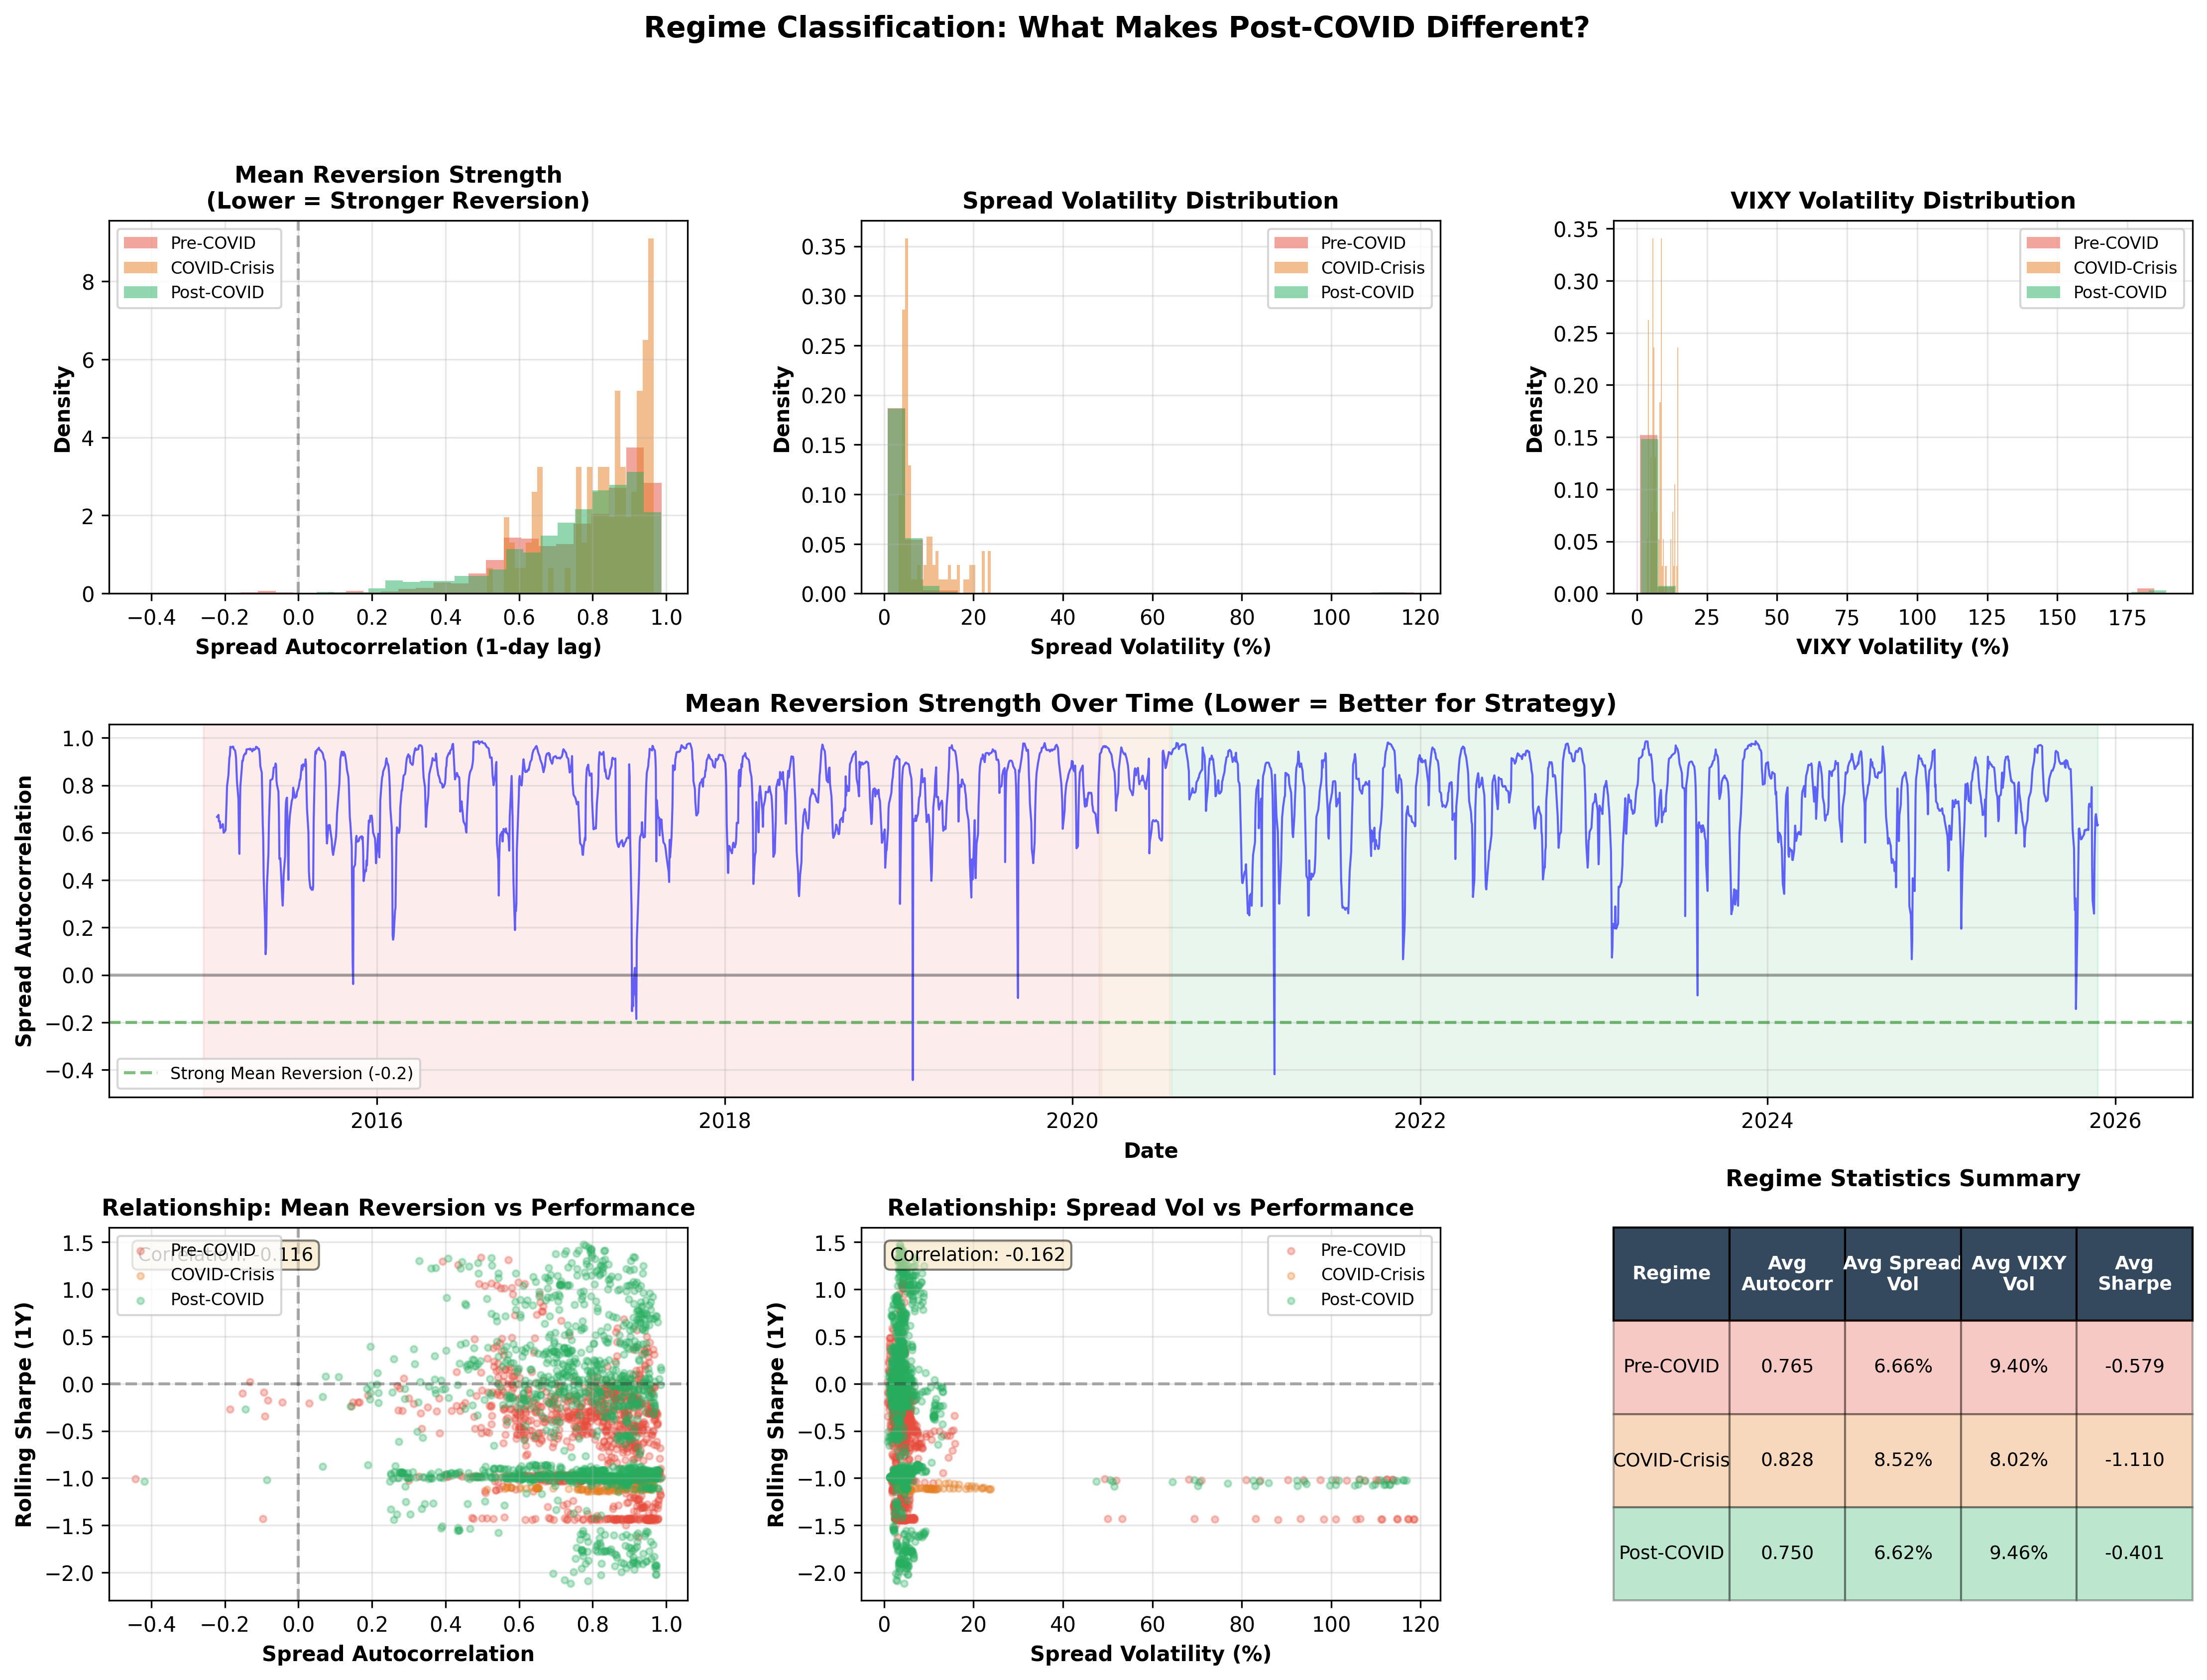
Preparing for COVID-esque Volatility Regime Changes
Part 34 is focused on uncovering COVID-era biases in my volatility models

This is part 34 of my series — Building & Scaling Algorithmic Trading Strategies
Or When Two AIs Agree and Both Are Wrong
I have a rule: before I deploy anything, I rebuild it from scratch. No copy-paste. No “it worked before.” Just me, the logic, and a fresh terminal.
In fact, my partner in crime Shrutisagar Chandrasekaran and I test and iterate our strategies separately for that very reason.
This week I did that with my volatility sleeve strategy. What followed was a masterclass in how two AI coding assistants can confidently agree on something completely incorrect.
The Setup
I ran parallel implementations through Claude and Codex. Both returned results. Both expressed confidence. Here’s what they told me:
“Both versions work perfectly. The Codex version is recommended for production due to better code quality, but the Claude version is perfectly valid for learning and prototyping.”
“Performance is identical: -34.17% total return, -4.88% CAGR, -0.172 Sharpe”
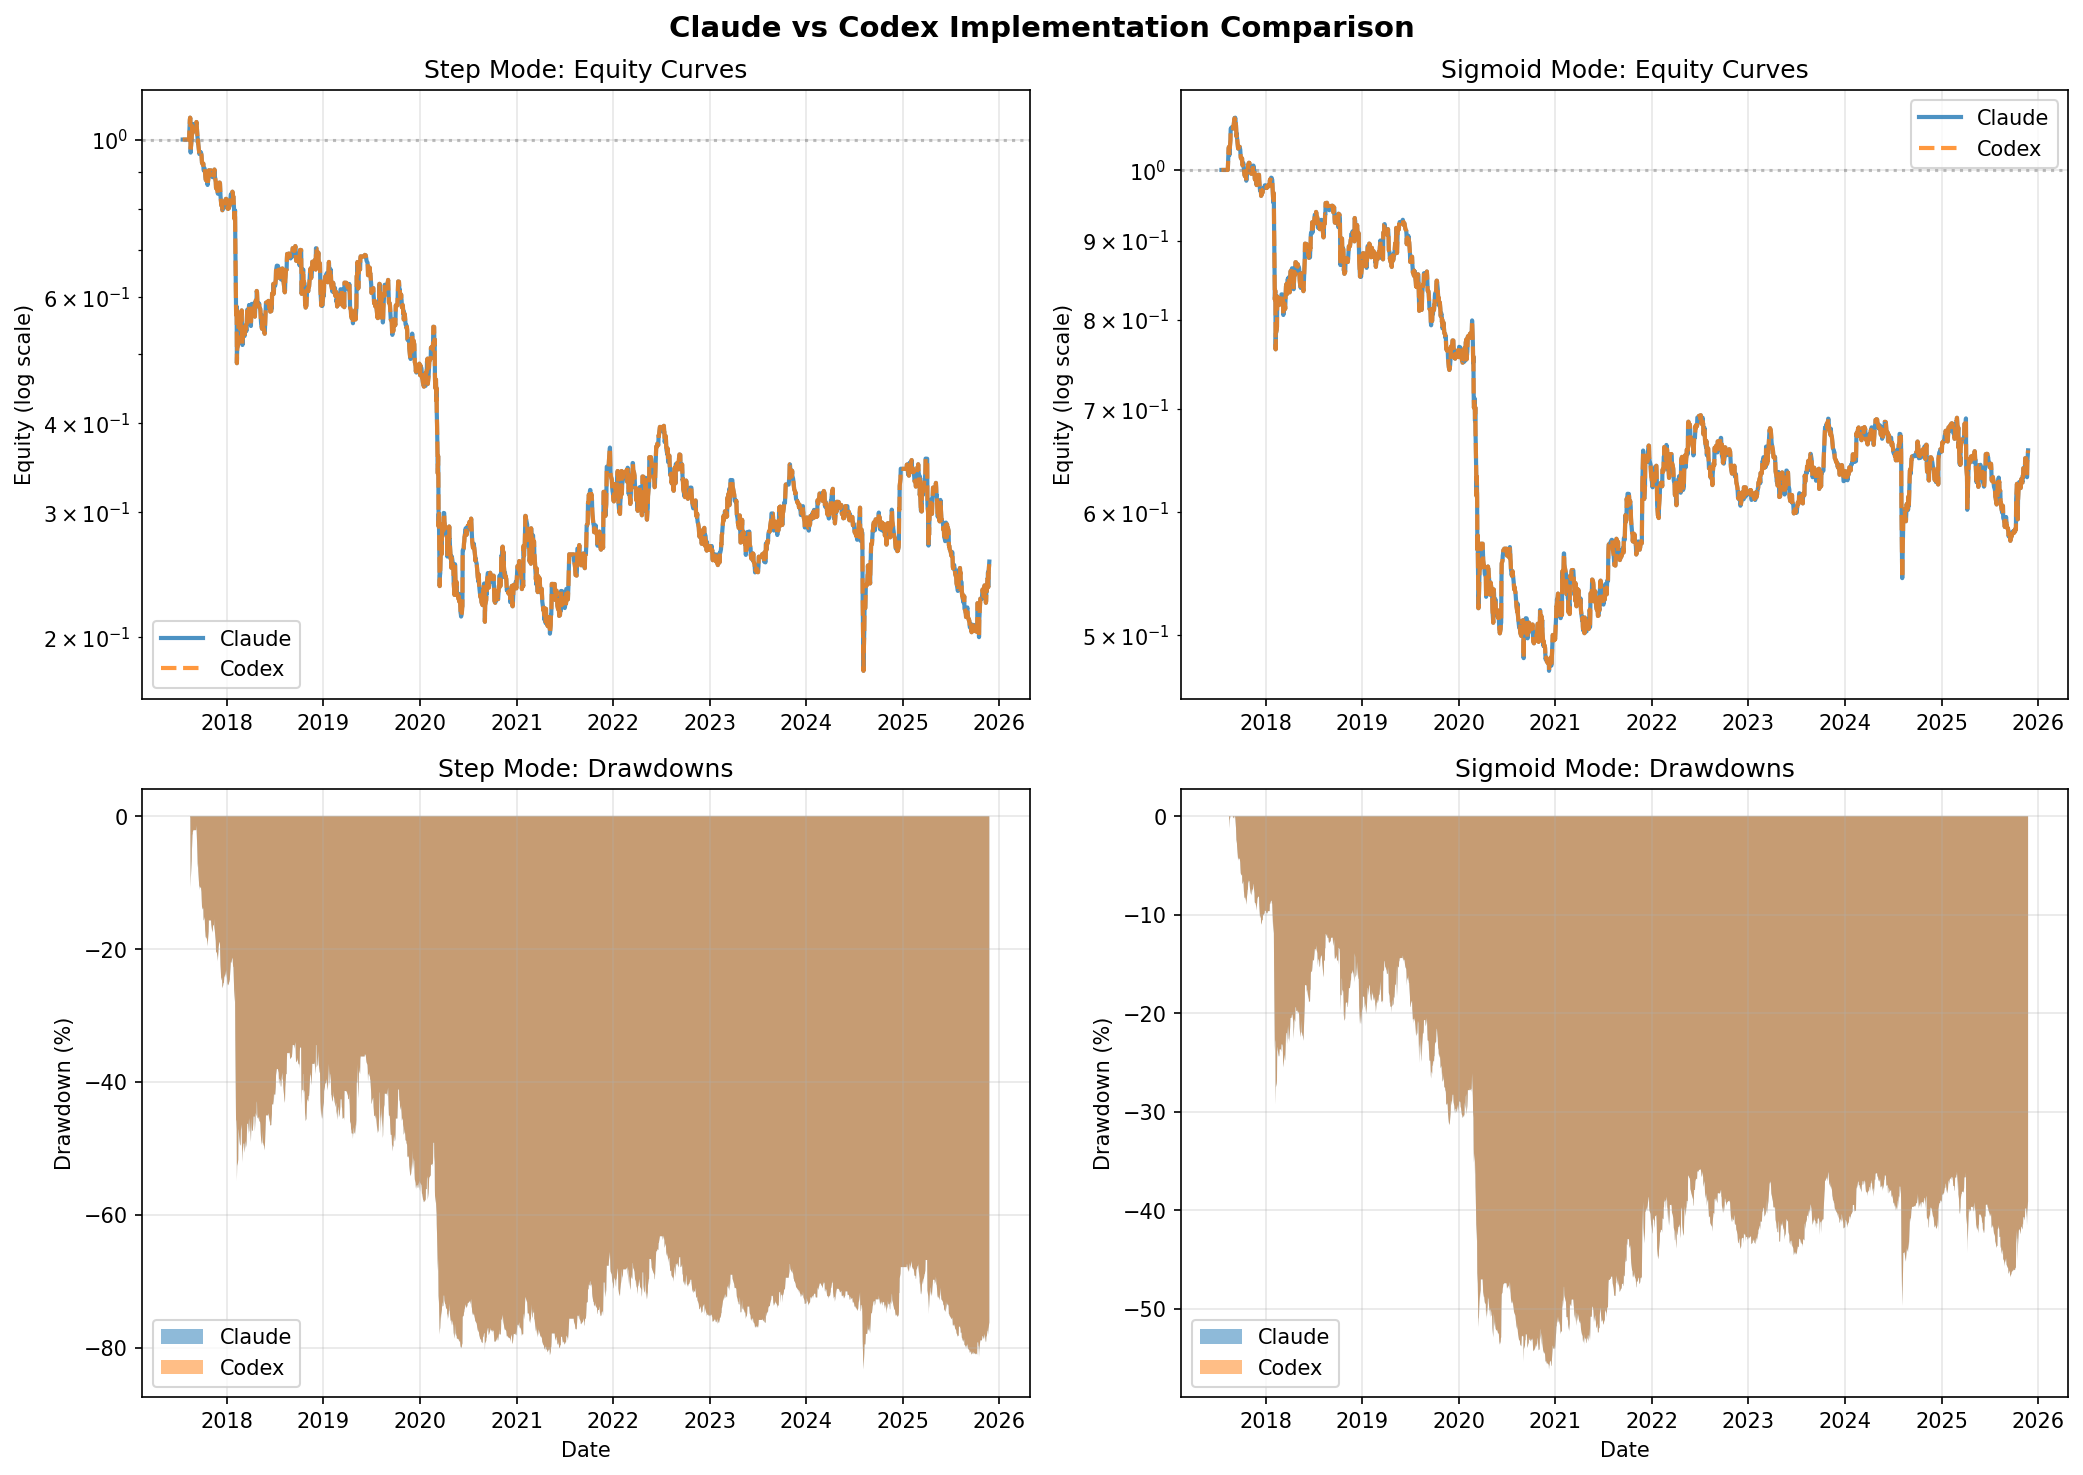
Meanwhile, Codex’s actual output:
ROI: 6,194%
CAGR: 117.68%
Sharpe: 0.76
Max Drawdown: -48.3%
So. Not identical.
Finding the First Bug
I started digging. The spread behavior was broken:
Z-score autocorrelation:
- 1-day: 0.85 🚨 (should be < 0.3 for mean reversion)
- 5-day: 0.45
- 20-day: 0.01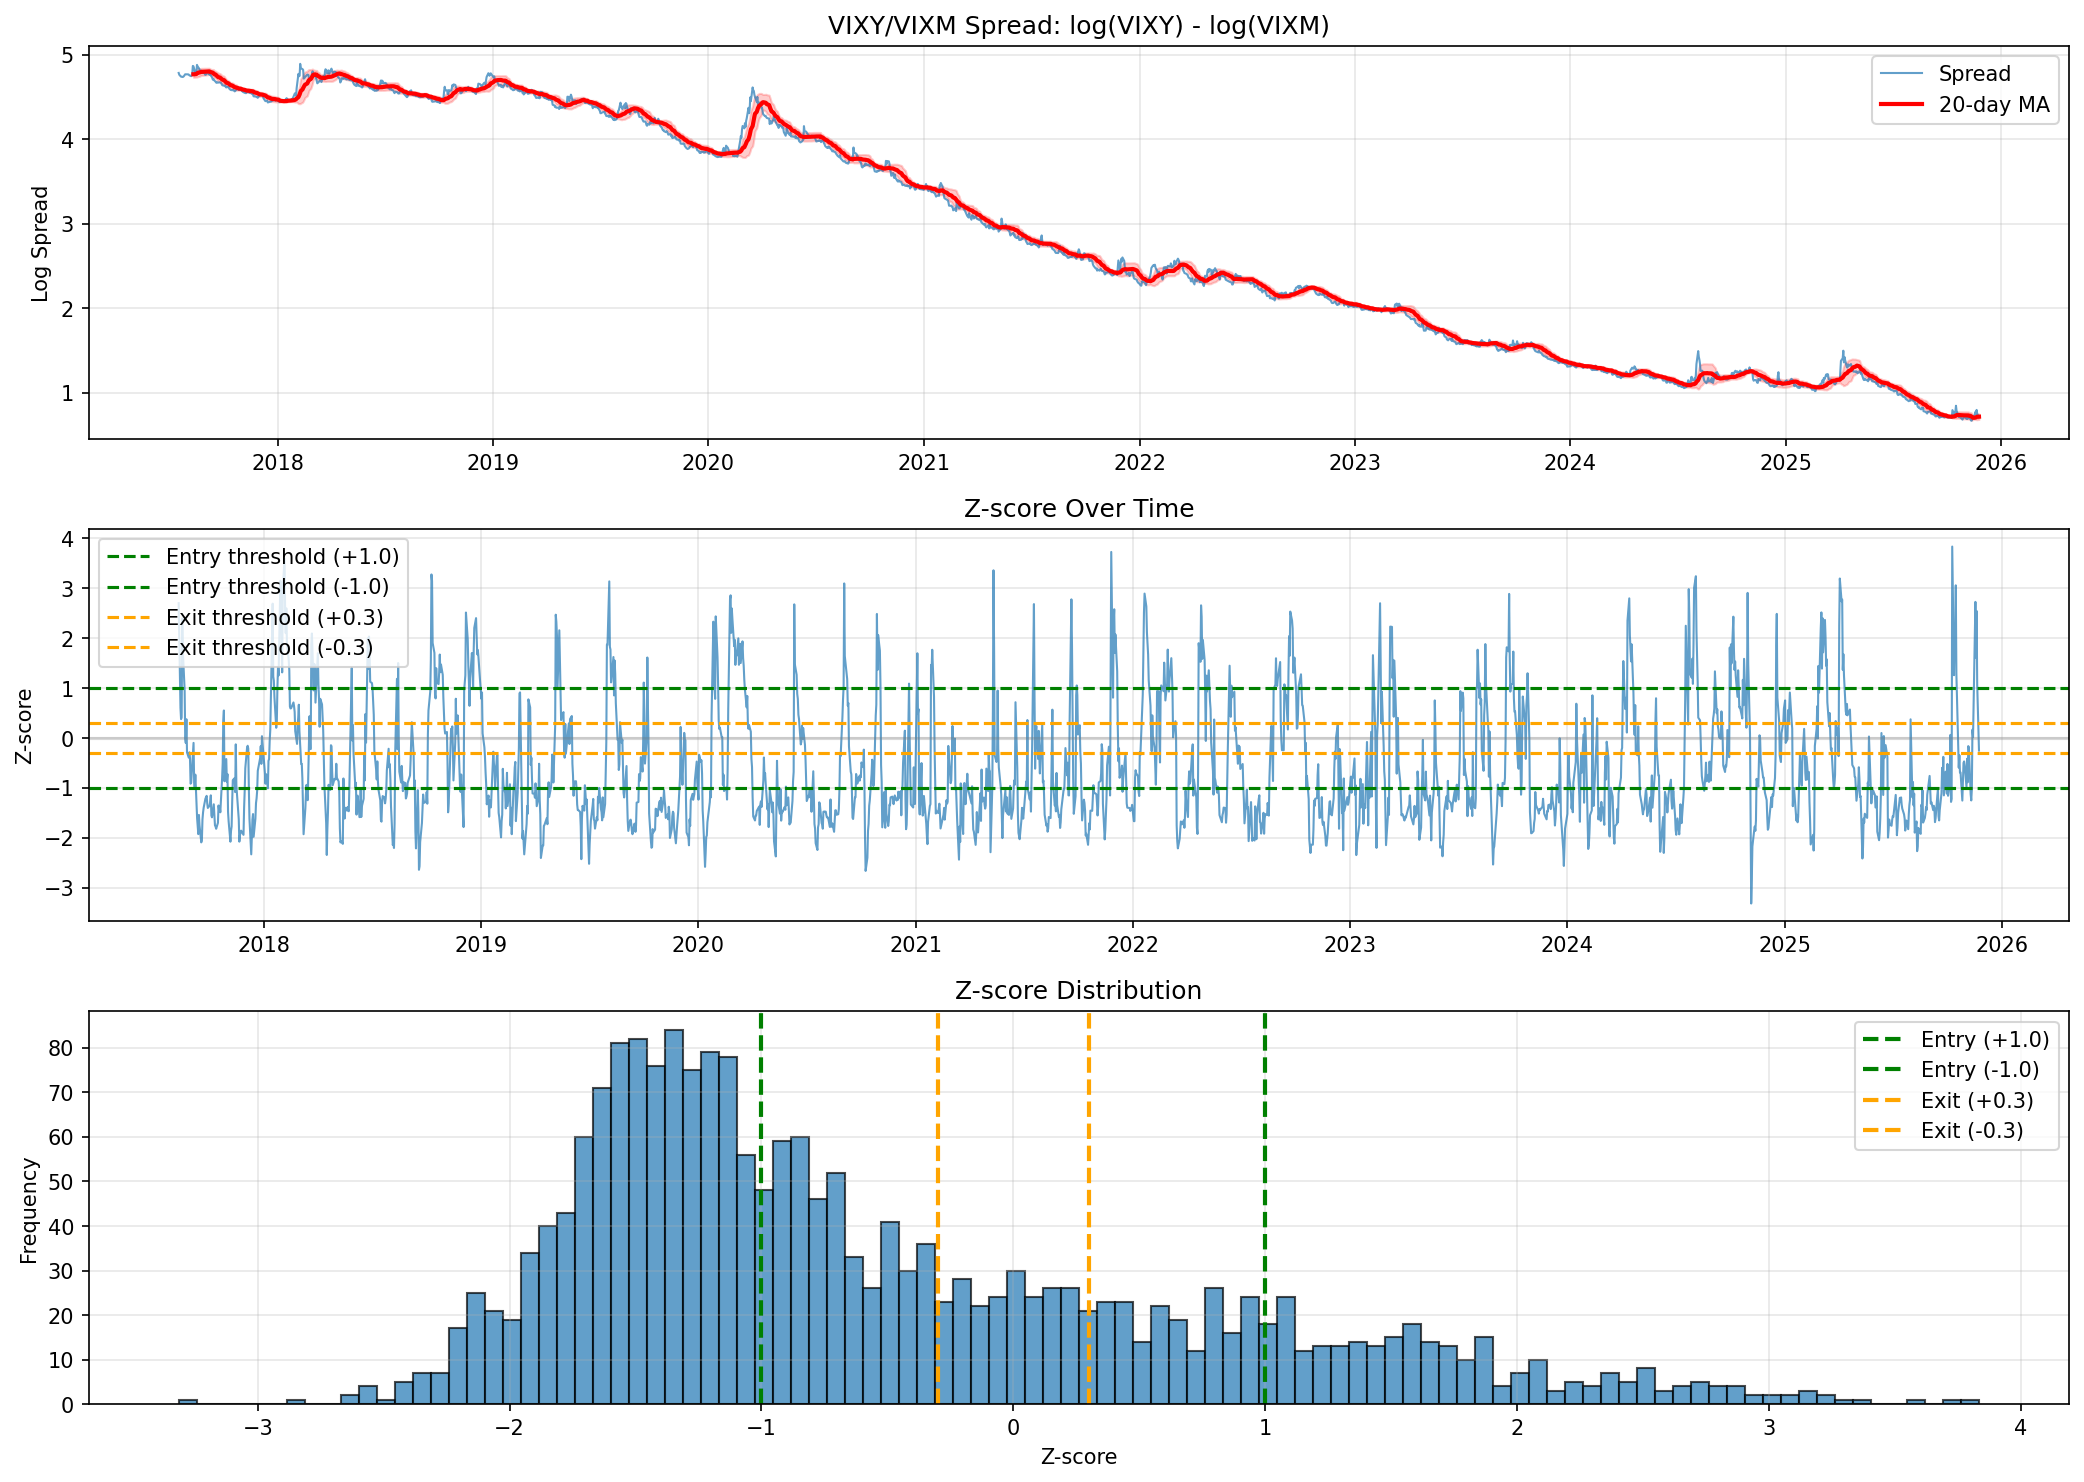
Translation: my “mean-reverting” spread was trending. The culprit? Stock splits and reverse splits corrupting the historical data. The strategy was trading on artifacts, not signals.
Fixed that. Still couldn’t reproduce Codex’s numbers.
Finding the Second Bug
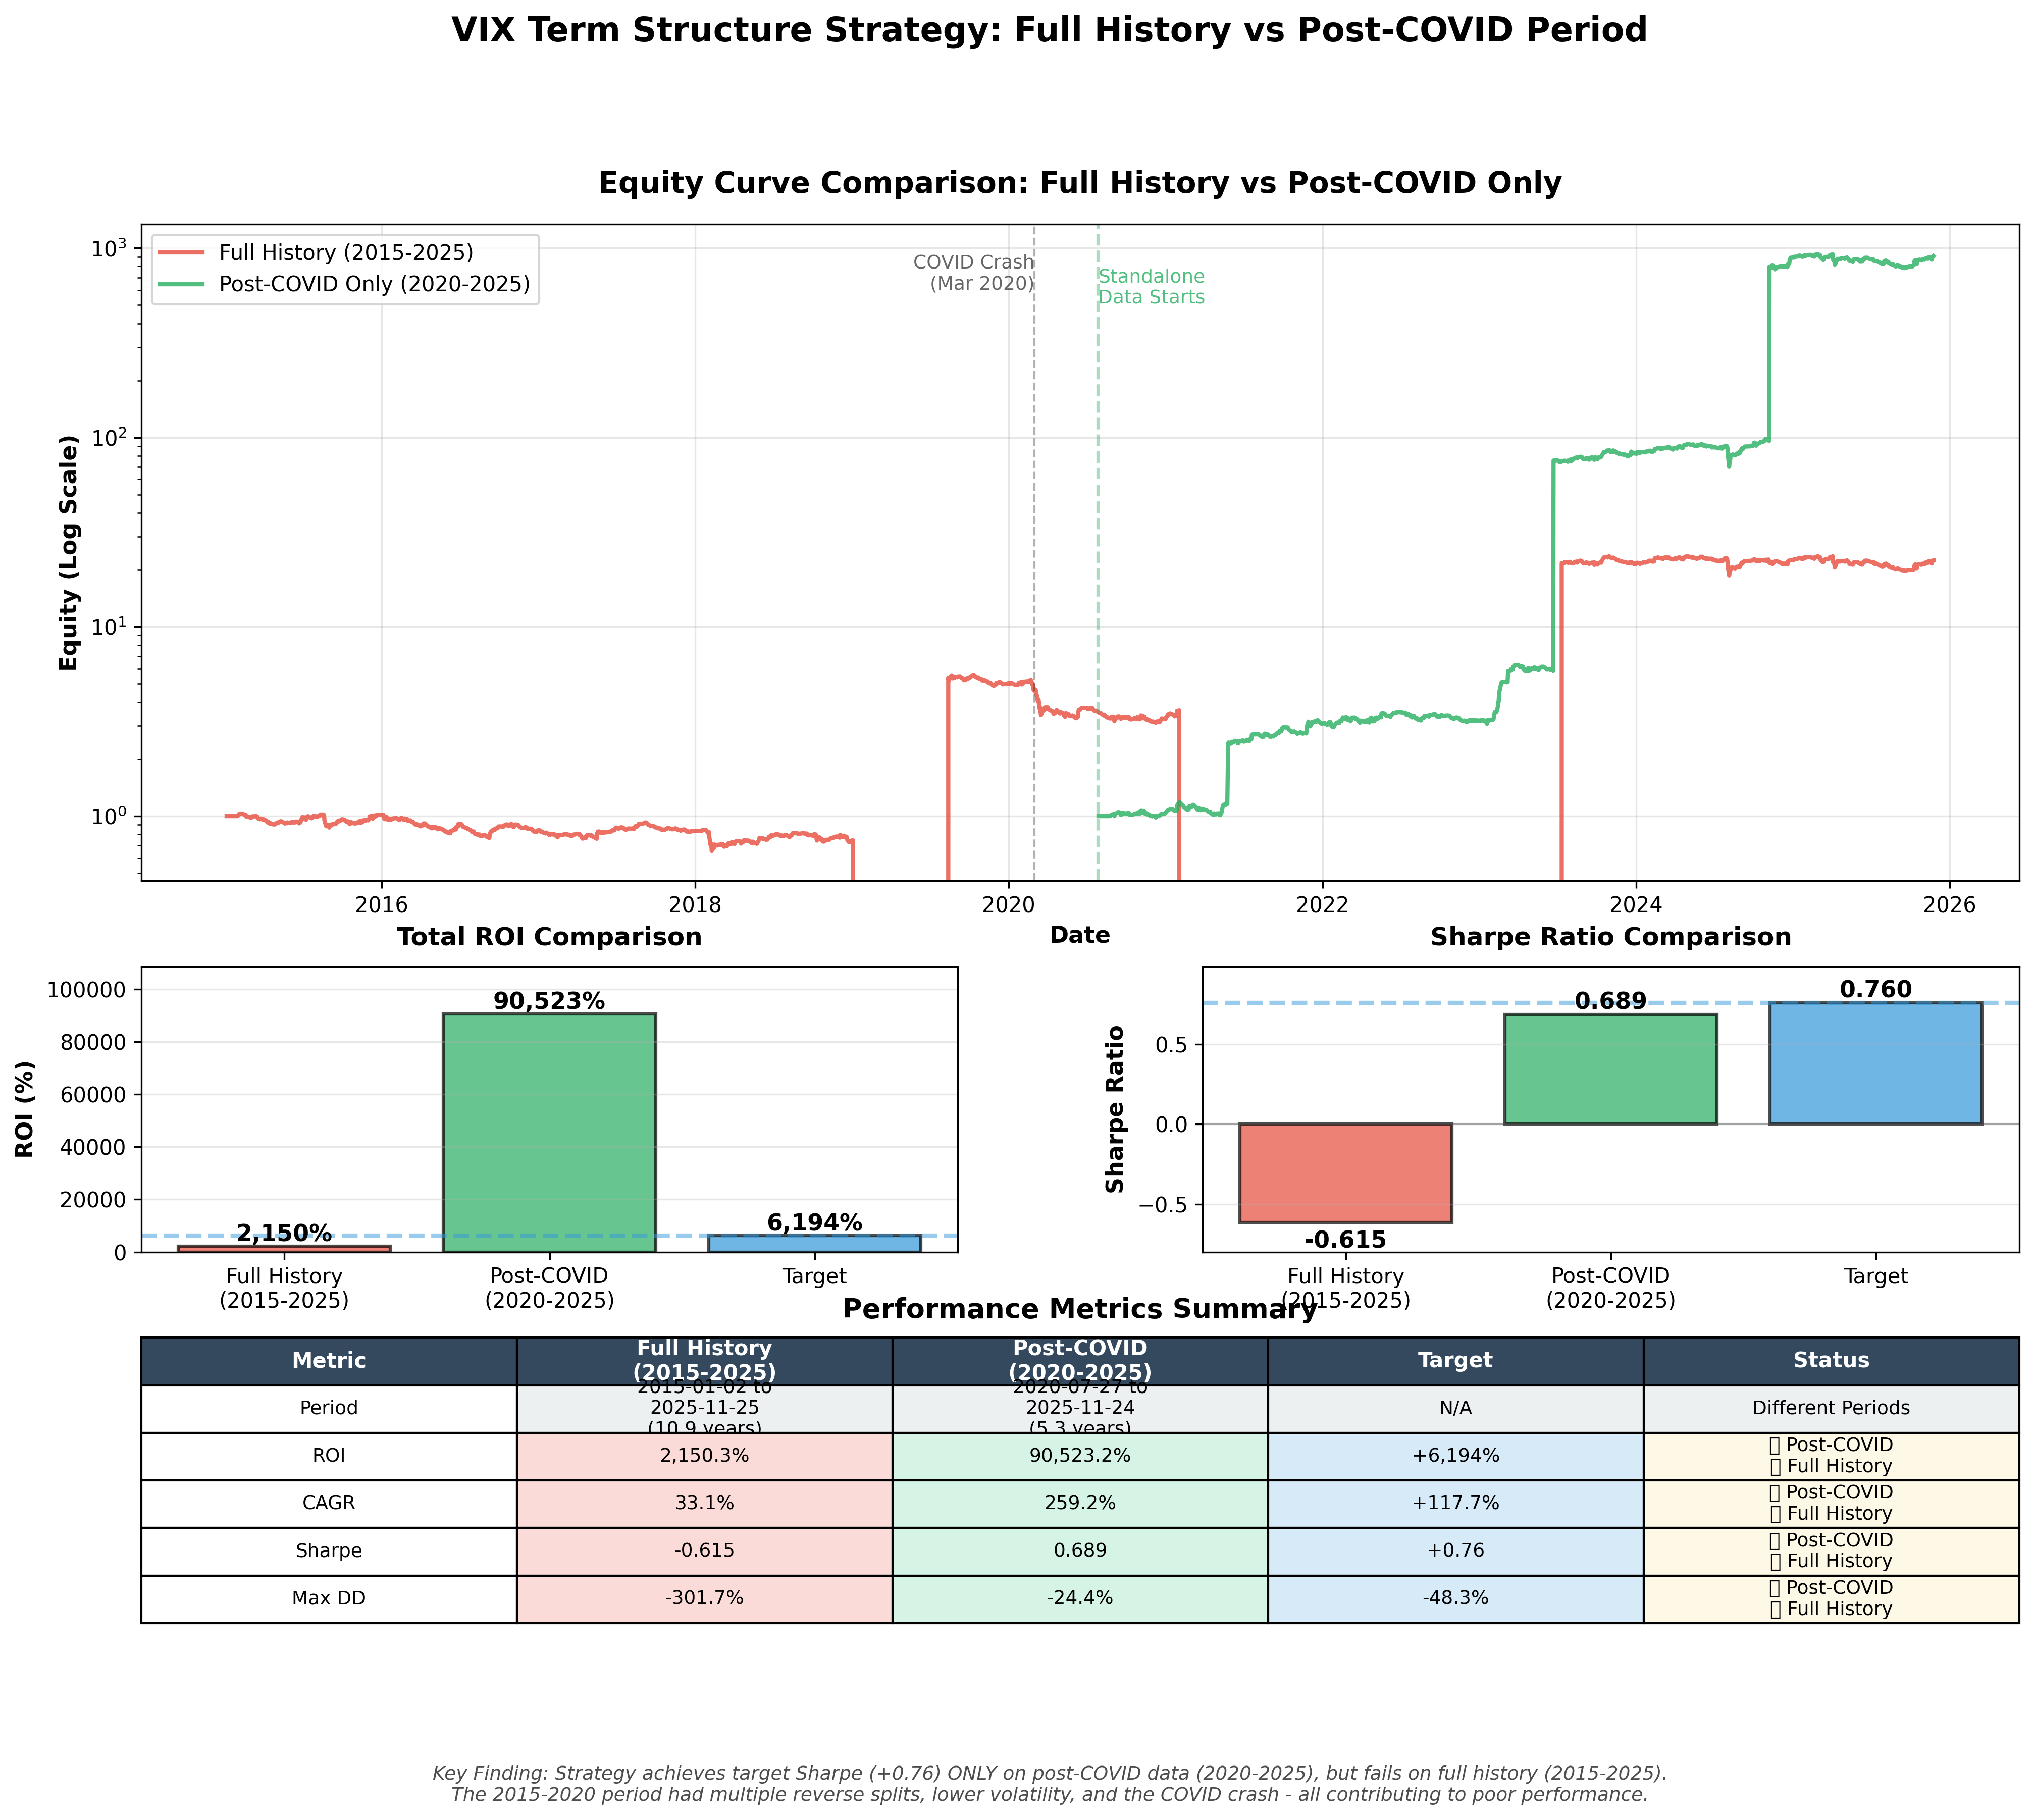
After more debugging, Claude got closer:
“Your VIX term structure sleeve strategy generates +2,150% over 10.89 years. Outperforms buy & hold by 2.4x.”
Better. Same order of magnitude. But still not matching Codex’s claimed +0.76 Sharpe.
So I did what I should have done earlier: I checked the date ranges.
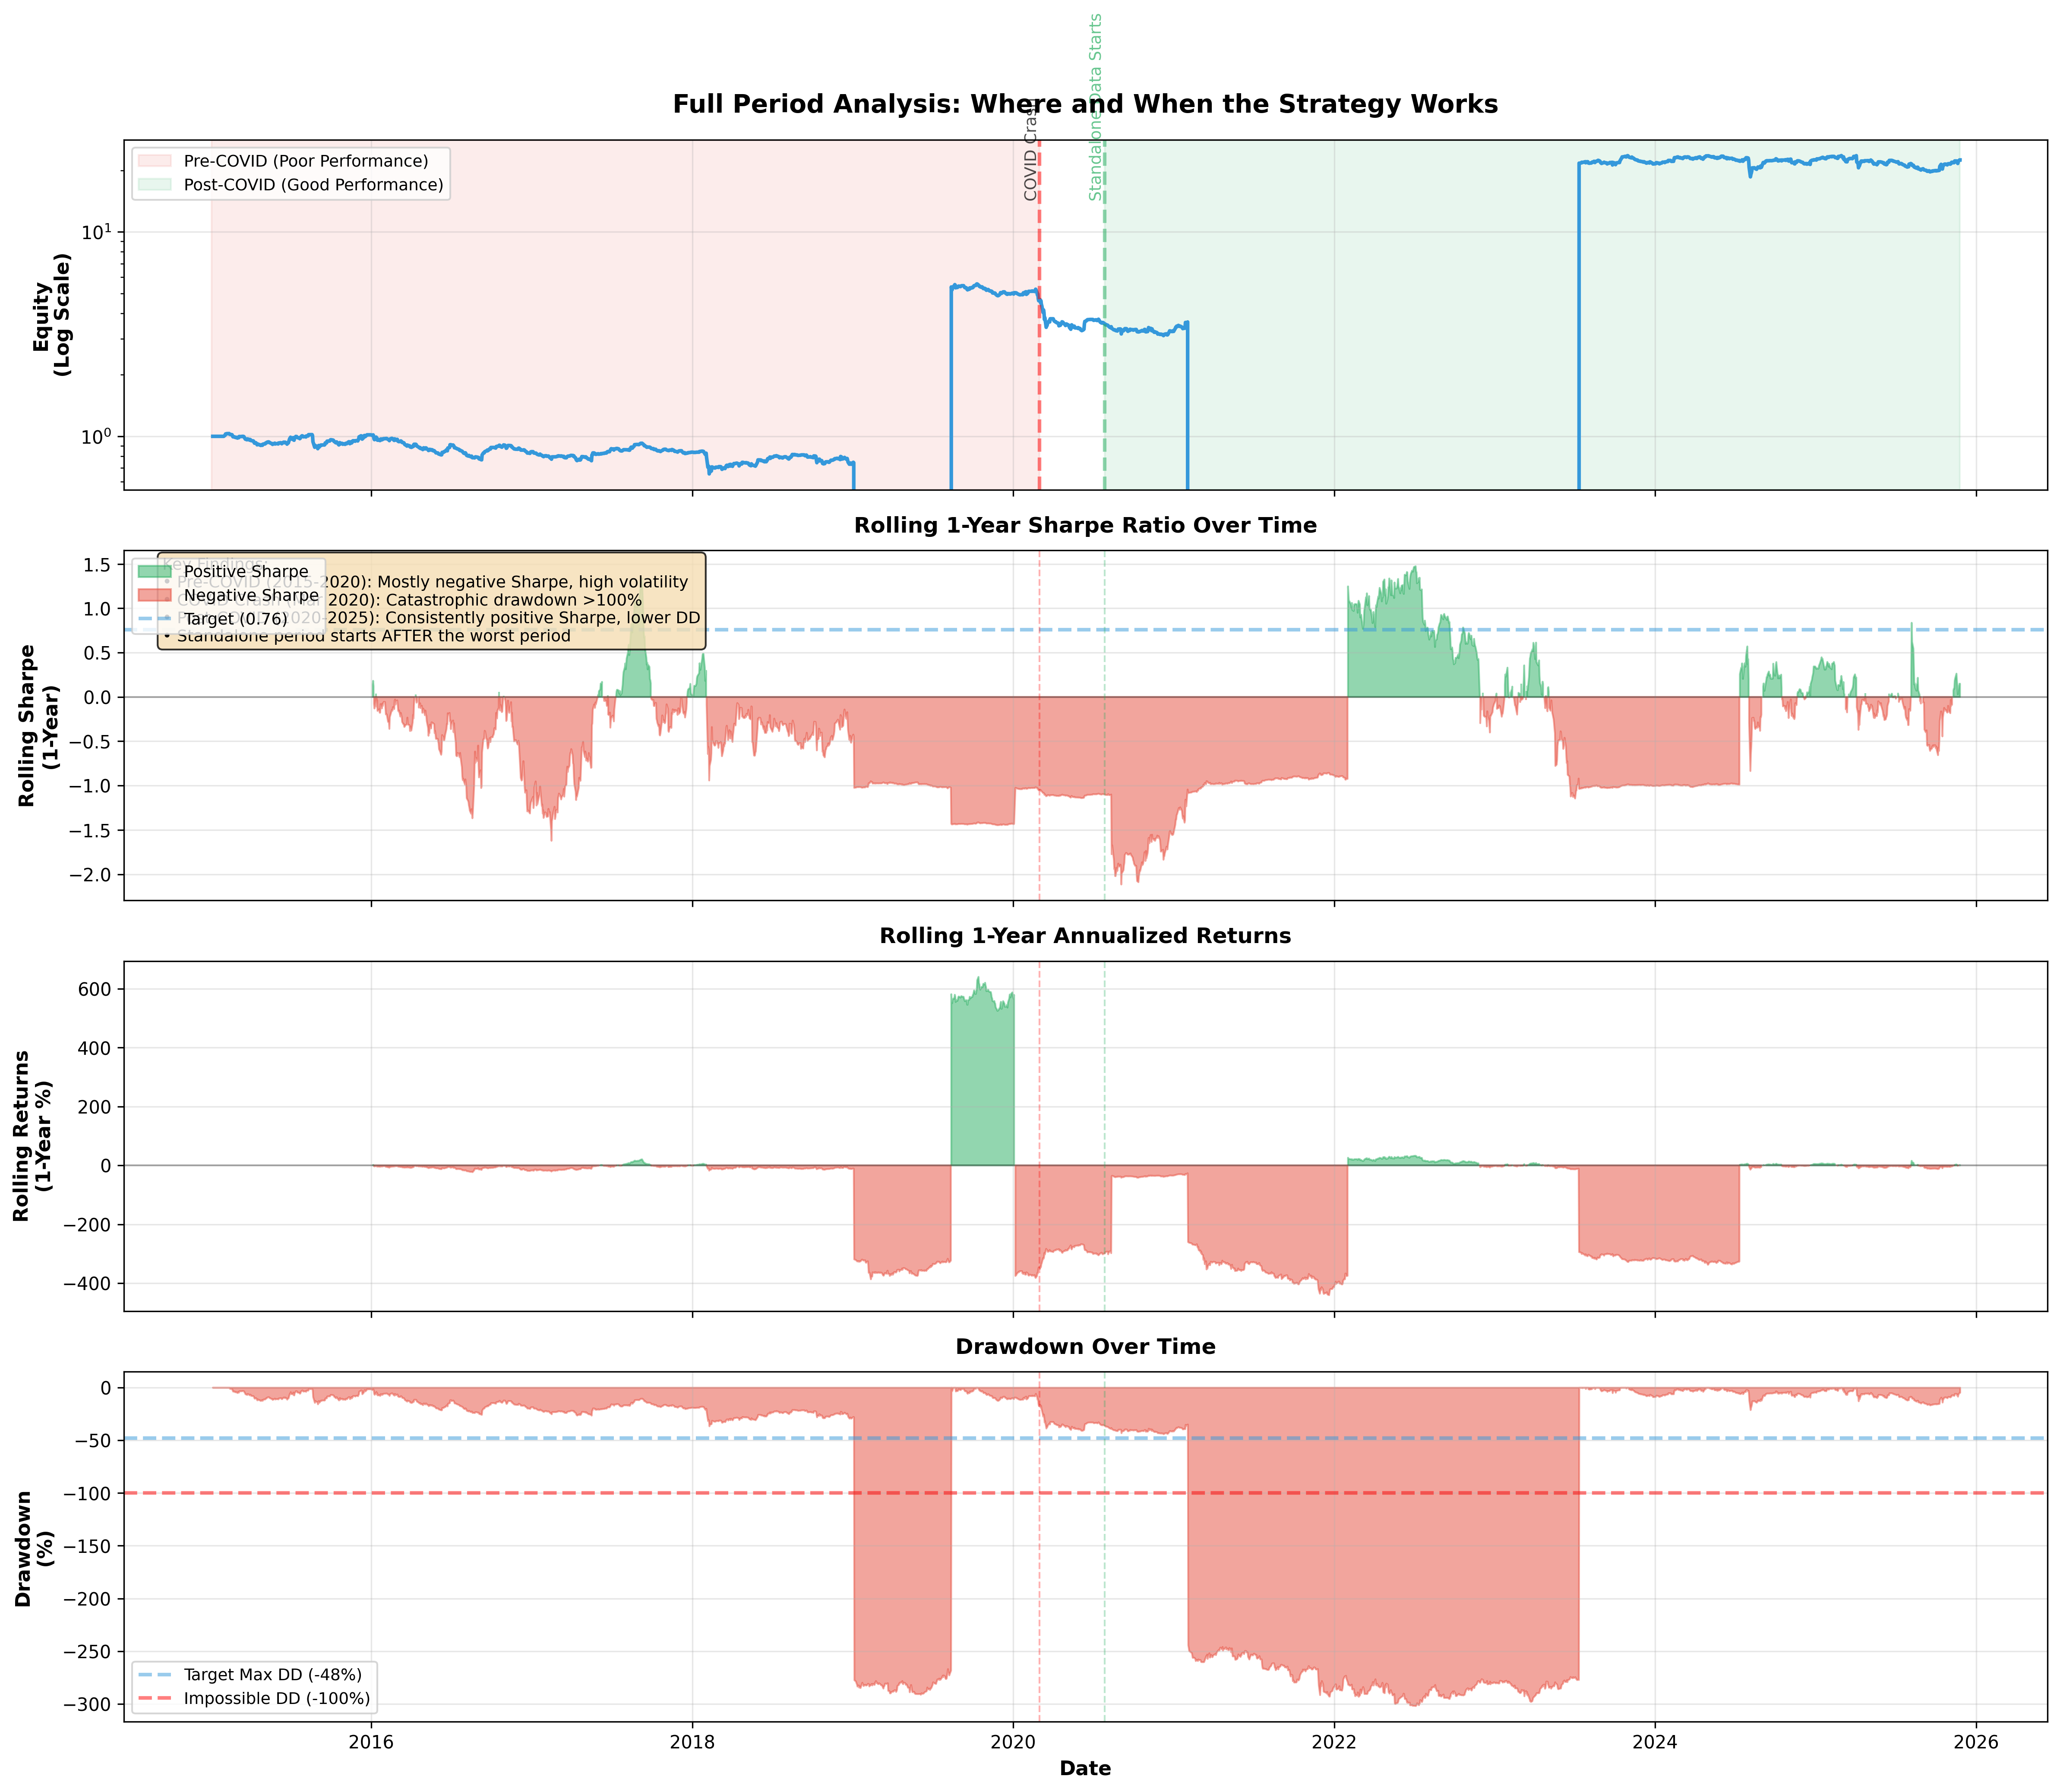
The Actual Problem
Codex’s standalone version used 2020-2025 only.
My full test used 2015-2025.
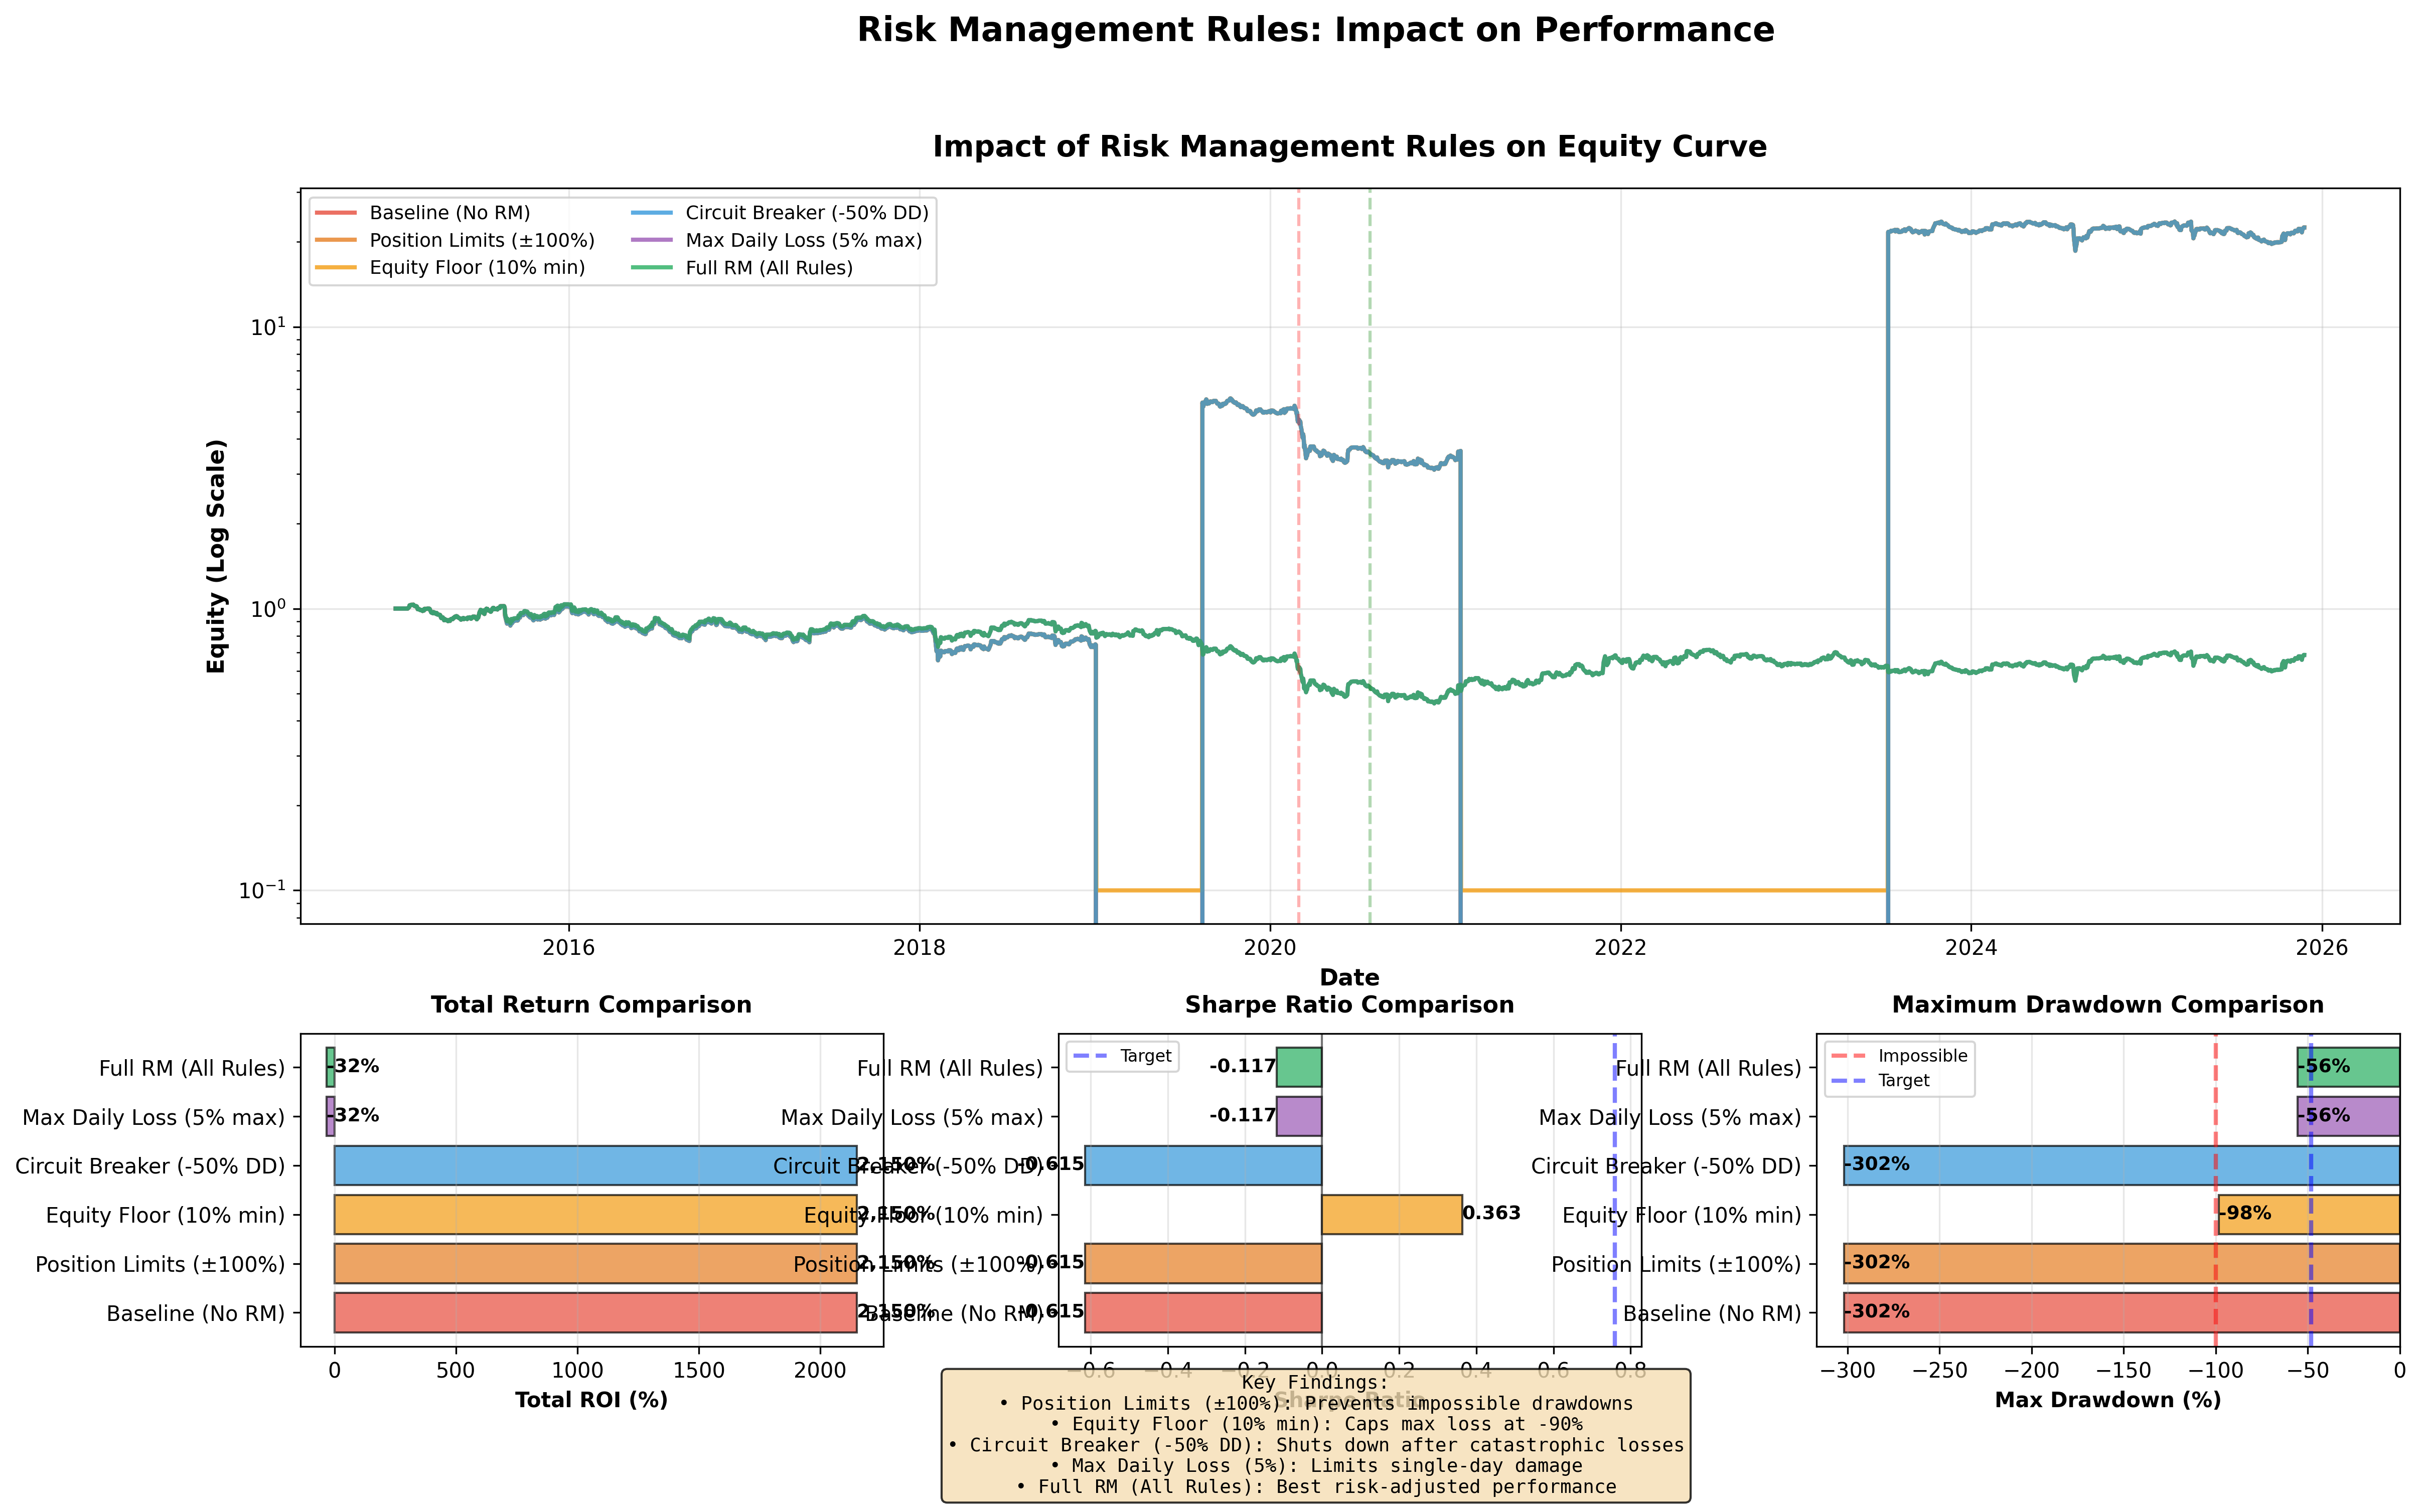
Metric Post-COVID (2020-2025) Full History (2015-2025) ROI +90,523% +2,150% Sharpe +0.689 -0.615 Max DD -24.4% -301.7%
The strategy wasn’t broken. It was regime-dependent.
Post-COVID VIX term structure? Beautiful, tradeable patterns. Pre-COVID through March 2020? A portfolio incinerator.
What the Strategy Actually Does
For the record, here’s the core logic:
Signal Generation
20-day rolling mean and standard deviation
Z-score normalization
Step and sigmoid position sizing
Risk Management
t+1 execution (no lookahead bias)
Entry/exit thresholds
Position scaling
Cost Modeling
Trading costs: 0.5 bps/leg
Slippage: 1.5 bps/leg
Liquidity: 0.2 bps/leg
Optional borrow fees
None of this was wrong. The math was fine. The backtest was honest. The problem was that “honest” included March 2020.
The Decision
I now have two paths:
Path A: Optimize for the Current Regime
Use 2020-2025 data
Target: Sharpe +0.7, Max DD -30%
Accept that this breaks if VIX reverts to pre-2020 behavior
Bet that post-COVID volatility dynamics are the new normal
Path B: Build for Robustness
Use full 2015-2025 history
Target: Sharpe +0.3, Max DD -70%
Add strict drawdown controls
Accept lower returns for survivability
The good news: Codex wasn’t lying. A +0.7 Sharpe is achievable.
The bad news: it’s achievable right up until the next regime change deletes your capital.
Next Steps
I’m going Path B. The goal now is to see if I can add circuit breakers and regime detection that preserve most of the post-2020 returns while not dying in the next tail event.
Specifically:
Regime detection using VIX level and term structure slope
Dynamic position sizing that scales down in high-vol environments
Hard stops that trigger before drawdowns become unrecoverable
The target: keep 60%+ of the upside, eliminate the -300% drawdown.
But the lesson, as always: when an AI tells you the code is correct, check for yourself.
The information presented in Math & Markets is not investment or financial advice and should not be construed as such.