
Positioning for the AI Endgame (Part 2)
The Trades: Specific Strategies to Profit From Both Scenarios

This is part 2 of my standalone piece on positioning for the AI endgame
In Part 1 (“Positioning for the AI End Game”), we mapped the terrain: extreme concentration, two possible scenarios, stagflation wildcards, and the global rotation already in motion.
Now let’s get specific. What are the actual trades? What do you buy, what do you sell, and how do you size it?
I’m structuring this around the asymmetric opportunities in each scenario — not hedging for safety, but positioning for profit.
Lessons From the Last Bubble Burst: Where the Money Was Made
Before we build forward-looking trades, let’s look at where the actual alpha was during the dot-com bust. This isn’t historical trivia — it’s the playbook.
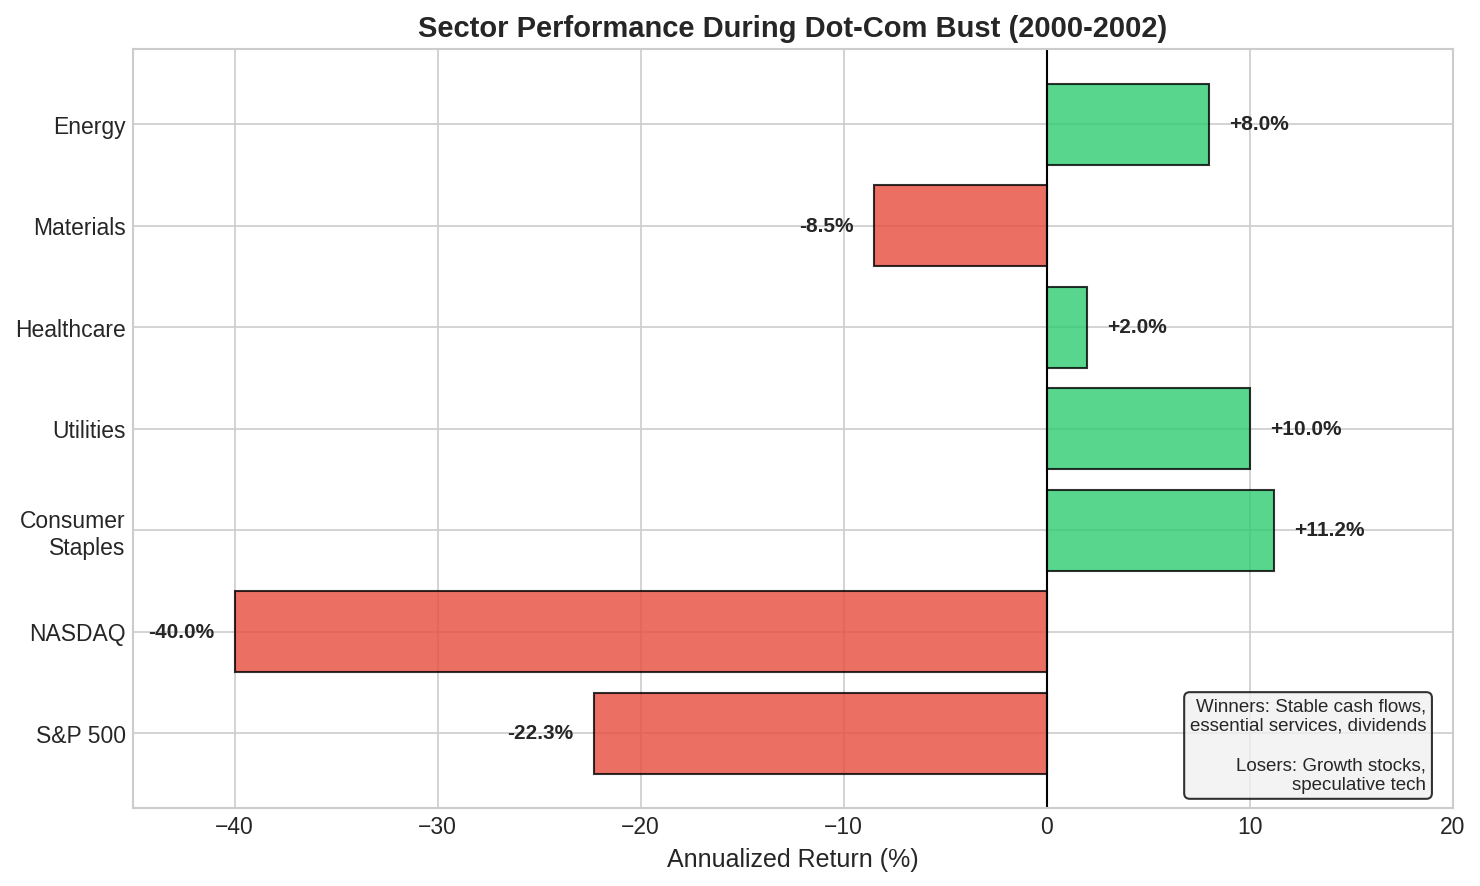
The counterintuitive finding: The best returns during 2000-2002 weren’t from being defensive — they were from being aggressively positioned in the right sectors.
Consumer Staples returned +11.2% annualized while the S&P fell -22.3%. That’s a 33 percentage point annual spread.
Southern Company gained +132% total. One hundred thirty-two percent. During a crash.
Energy stocks returned +25% total as oil rallied from $20 to $35.
Materials outperformed by 14 percentage points annually.
The bigger money came in the recovery. The names that survived the bust generated monster returns:
Amazon: down 94%, then up 200x over two decades
Tyler Technologies: +431% from 2001-2003
Western Digital: +360%
Global Payments: +219%
The pattern is clear: you make money during busts by being long the right stuff, not by hiding in cash. And you make even more money by buying the survivors of the bust at distressed prices.
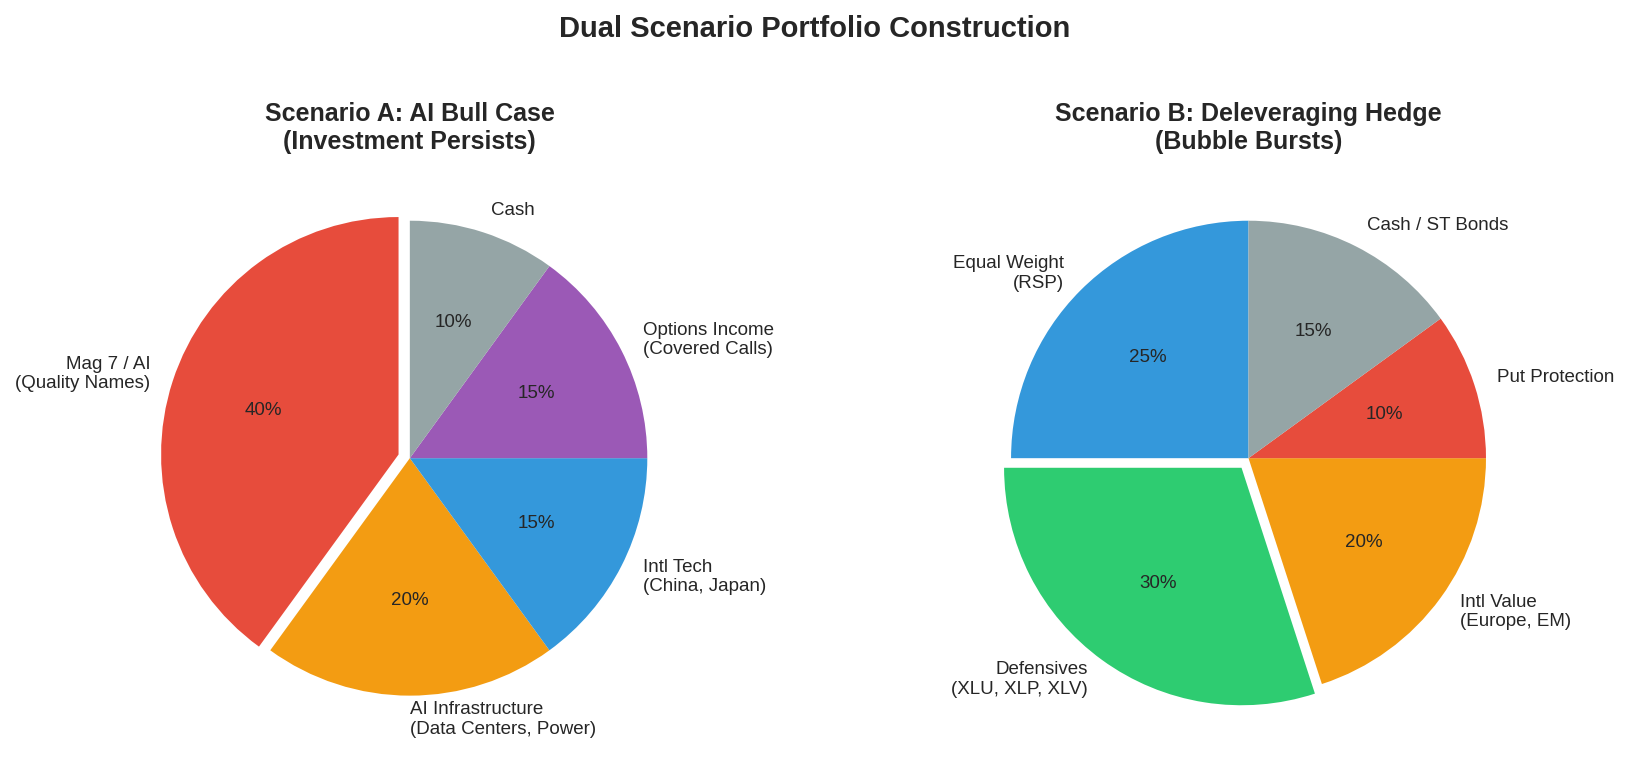
Scenario A Trades: AI Investment Persists
If the buildout continues, the obvious long (Mag 7) has limited upside — the easy money is made. But there are second-order trades with much better risk/reward.
Trade #1: The Infrastructure Arbitrage
The thesis: Everyone’s long AI companies, but the physical layer is less crowded. Data centers need power, cooling, and connectivity. These providers have pricing power that isn’t fully reflected.
Specific plays:
XLU (Utilities Select Sector SPDR): Utilities exposed to hyperscaler power demand. Trading at historical multiples despite structural demand growth.
Data center REITs: Digital Realty (DLR), Equinix (EQIX). These are the landlords of the AI boom.
Grid infrastructure: Companies building transmission capacity for data center clusters.
The math: Utilities have rallied 20% relative to European benchmarks recently. US utilities with data center exposure haven’t moved as much. If hyperscaler power demand continues growing (and it will regardless of AI software success), these names have 20-30% upside with defensive characteristics.
Trade #2: The International AI Discount
The thesis: China and Asia tech trade at massive discounts to US peers. If AI works anywhere, it probably works in China’s application-focused model.
Specific plays:
BABA (Alibaba): P/S of 1.9x versus Palantir’s 94.4x. Owns 39% of China’s cloud market. Has $62 billion net cash. If AI monetization works, this is absurdly cheap.
KWEB (KraneShares CSI China Internet): Basket approach to China tech. Down from 2021 highs, trading at 12x earnings.
Japanese robotics/automation: FANUC, Keyence. Beneficiaries of reshoring and automation trends with reasonable valuations.
The math: MSCI China Information Technology is up nearly 100% in 2025 versus 30% for US tech — and it started from a lower base. The valuation gap is still enormous. Goldman notes that global investors less sensitive to geopolitical tensions are “increasingly open to exploring opportunities in China.”
Trade #3: The Volatility Harvest
The thesis: AI stocks have elevated implied volatility. If the bull case plays out, that IV compresses. Sell premium to generate income while maintaining upside exposure.
Specific plays:
Covered calls on quality AI names: Sell 15-20% OTM calls, 30-45 DTE on positions you want to own anyway (GOOGL, META, MSFT). Generates 2-4% monthly income.
Cash-secured puts on names you’d buy cheaper: Sell puts on quality tech names at prices you’d happily pay. Collect premium while you wait.
QYLD or JEPI: If you want the strategy in ETF form. QYLD yields 11%+ from covered calls on Nasdaq 100.
The math: NVDA 30-day implied volatility is around 50%. If you sell covered calls and the stock goes up 15%, you keep the premium plus the gains. If it goes up 25%, you get called away with a nice profit. If it goes down, the premium cushions the loss. You’re getting paid to own quality.
Scenario B Trades: Deleveraging Occurs
This is where the real asymmetry is. Busts create generational opportunities — but you have to know what to buy and when.
Trade #4: The Rotation Trade (Start Now)
The thesis: Capital is already rotating from concentrated US tech to international value. Position ahead of the flow, not behind it.
Specific plays:
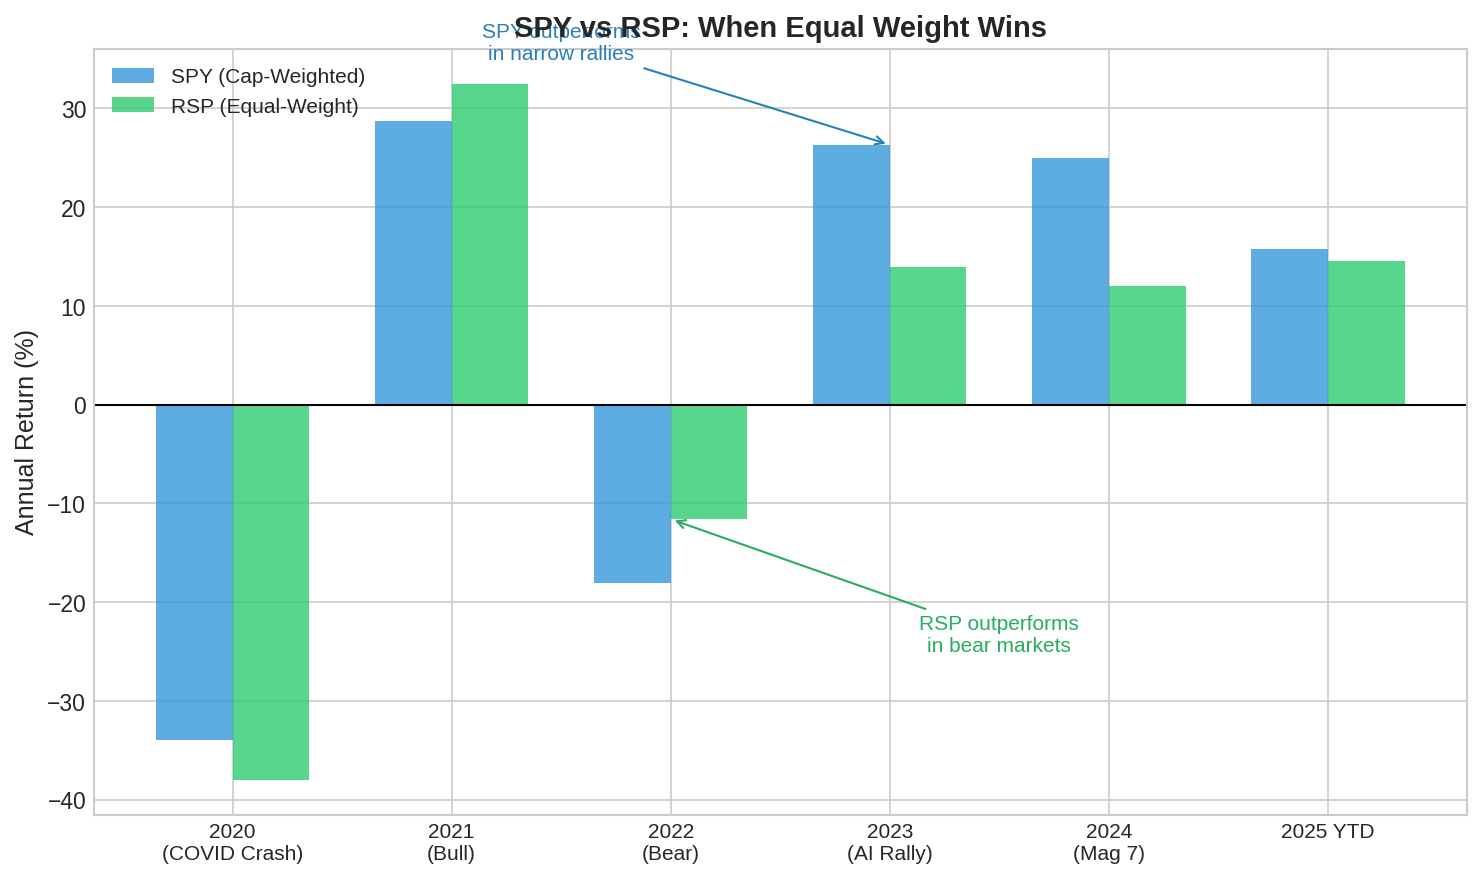
RSP (Invesco S&P 500 Equal Weight): Automatic concentration hedge. Outperformed SPY by 6.5 points in 2022’s selloff. Trades at a 29% P/E discount to cap-weighted S&P.
VGK (Vanguard FTSE Europe): European equities at 14x forward P/E versus 22x for US. Strongest relative start since 2000.
EWG (iShares MSCI Germany): German industrials and banks benefiting from infrastructure spending and rate tailwinds.
The math: Non-US stocks are 35% cheaper than US stocks on forward P/E. The dollar is down 8% in 2025, amplifying returns for US investors. In February, STOXX 600 gained 3.3% while S&P lost 1.4%.
And if I am being candid, this isn’t a hedge — this is honestly an alpha trade that’s already working!
Trade #5: The Defensive Sector Rotation
The thesis: Not all “defensive” positions are equal. Target sectors with structural demand growth, not just low beta.
Specific plays:
XLV (Health Care Select Sector SPDR): Healthcare demand is inelastic. Sector underperformed the AI rally, creating relative value.
XLP (Consumer Staples Select Sector SPDR): Essential goods with pricing power. These names have been neglected for years.
European banks at 9-10x P/E: Return on equity has improved from single digits to low double digits. Still at massive discounts to US peers.
The math: During dot-com bust, Consumer Staples returned +11.2% annualized. Healthcare held steady. These sectors aren’t exciting, but they generated real returns while tech collapsed 78%. The setup is quite similar today.
Trade #6: The Dip-Buying Protocol
The thesis: The biggest money in any bust comes from buying quality names at distressed prices. But you need dry powder and a system.
I’d say the protocol is simple: identify survivors, set price targets, stage entries, and keep dry powder.
The math: Amazon fell 94% from its 2000 peak. If you bought at -70% (still a terrible entry), you made 30x over the next 20 years. The survivors of bubble bursts generate multi-bagger returns. The key is having cash and conviction when everyone else is panicking.
The Stagflation Trades: The Overlooked Asymmetry
If stagflation materializes — Fed can’t cut because of inflation, growth slows anyway — the standard playbook breaks. This is where the biggest mispricing might be.
Trade #7: The Rate Divergence Play
The thesis: Europe is expected to cut 100 bps versus 25 bps for the US. That monetary policy divergence creates opportunities.
Specific plays:
Long European equities (hedged or unhedged): Lower rates support valuations. The ECB has room to cut that the Fed doesn’t.
European real estate: The sector is the cheapest in Europe, trading at the biggest discount to fair value. Most sensitive to rate cuts.
Short duration in US, long duration in Europe: If US rates stay higher while Europe cuts, this spread trade works.
The math: The interest rate differential creates a structural tailwind for European assets. German residential real estate is particularly rate-sensitive and trades at material discounts.
Trade #8: The Pricing Power Filter
The thesis: In stagflation, companies that can raise prices outperform.
Specific plays:
Companies with subscription/recurring revenue: Microsoft (Office 365), Adobe, Salesforce. They can raise prices annually.
Essential services with inelastic demand: Utilities, healthcare, waste management.
Avoid: Commodity-like businesses, discretionary with price-sensitive customers.
The math: In the 1970s stagflation, companies with pricing power maintained margins while others got squeezed. Same logic applies today.
Position Sizing: The Barbell Approach
Here’s how I think about structuring the overall portfolio to profit from multiple scenarios:
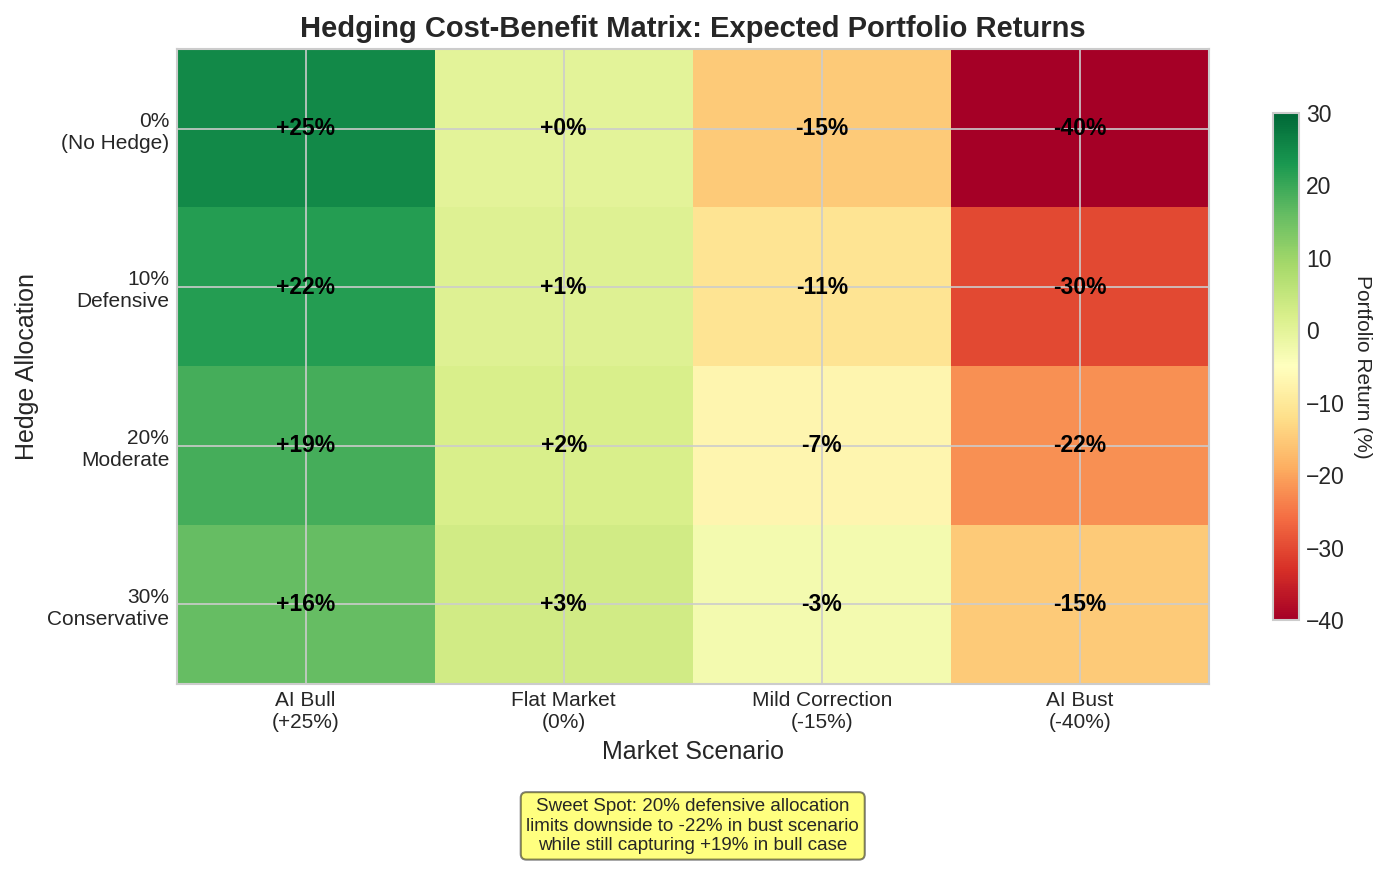
The core insight: You don’t need to predict which scenario wins. You need to structure positions so you profit from either one.
The barbell:
40% — Rotation trades (already working): RSP, international value, European equities. These profit if concentration unwinds OR if international outperformance continues.
25% — AI bull case (but smarter): Infrastructure plays, international AI, volatility harvesting. Upside if AI persists, with better risk/reward than straight Mag 7.
20% — Sector rotation: Defensives with pricing power, healthcare, utilities. Outperform in stagflation or bust, hold steady in bull case.
15% — Dry powder: Cash and short-term bonds at 4%+. Ready to deploy into distressed opportunities.
Why this works: The rotation trades and sector rotation components profit from deleveraging. The AI bull case trades profit from persistence. The dry powder lets you be opportunistic in either direction. There’s no scenario where everything loses.
The Decision Framework
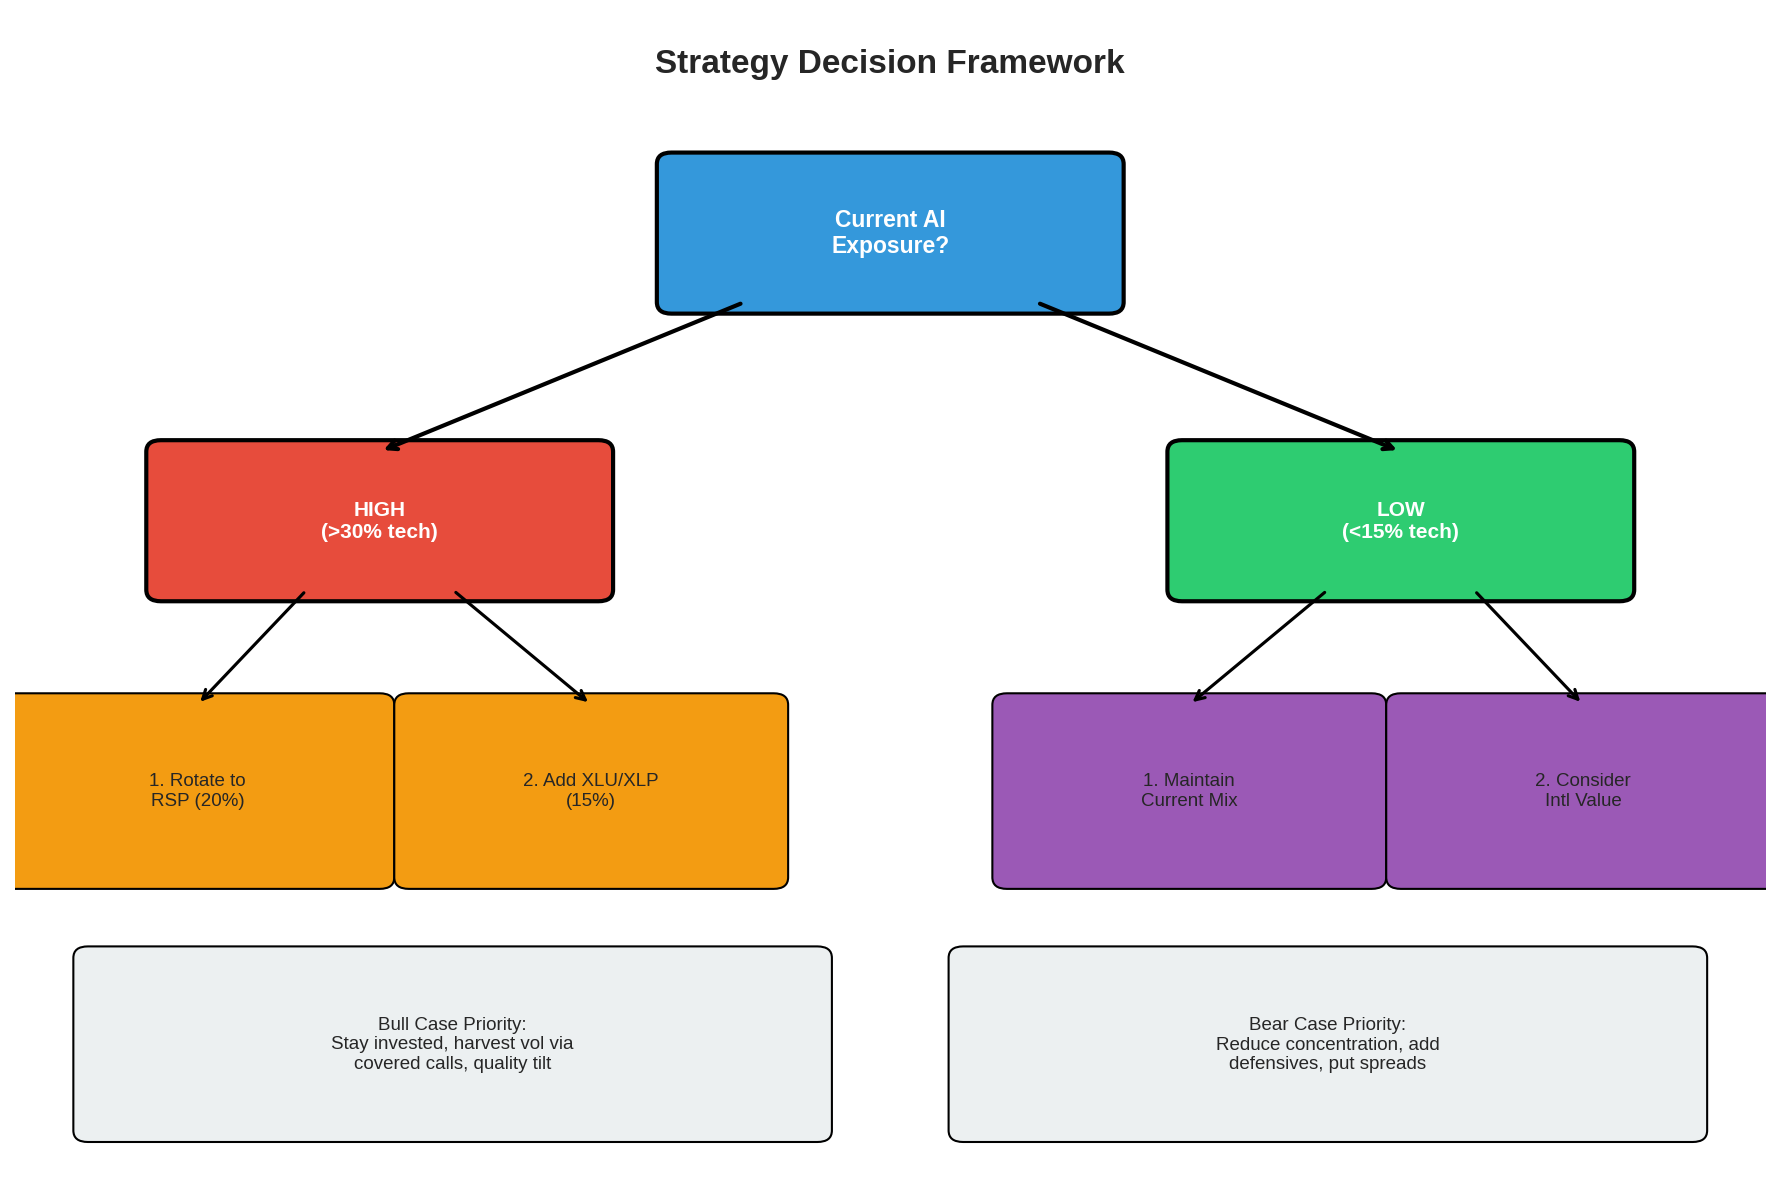
If you currently have high AI/tech concentration (>30%):
Take profits on 15-20% of position. This isn’t bearish — it’s rebalancing after a massive run.
Rotate proceeds into RSP and international value. You’re still exposed to upside, but with better risk/reward.
Sell covered calls on remaining positions. Get paid to wait.
If you currently have low tech exposure (<15%):
Don’t chase. The risk/reward on adding Mag 7 here isn’t attractive.
Consider international tech (China, Japan) for AI exposure at better valuations.
Build your dip-buying list. Be ready to act when opportunities appear.
If you’re starting fresh:
Use the barbell allocation as a starting template.
Scale into positions over 3-6 months — don’t deploy all at once.
Rebalance quarterly.
The Bottom Line
The AI concentration situation is creating a multi-year opportunity set:
The rotation trade is already working and has further to run
International markets offer AI exposure at 40% discounts to US names
If deleveraging occurs, the bust creates generational buying opportunities in quality survivors
Stagflation is the overlooked scenario with specific, tradeable implications
The mistake most investors make is treating this as a binary “bull or bear” question. It’s not. It’s a complex situation with multiple profit opportunities depending on which path unfolds.
Structure your portfolio to capture those opportunities. Stay flexible. Keep dry powder. And remember: the biggest money in market history has been made during periods of maximum uncertainty.
This is one of those periods.
This concludes the AI Endgame series. Next up: probably something with satellites again, because staring at shipping data is more fun than watching tickers.
Ticker Disclosures: I hold sizable equity and option positions in SPY and some other names mentioned in this post.
Data Sources: Wikipedia Dot-Com Bubble article, Goldman Sachs Research, Morgan Stanley, J.P. Morgan Asset Management, Morningstar, Fidelity, Invesco, Zacks, Yahoo! Finance sector analysis, historical S&P 500 data.
The information presented in Math & Markets is not investment or financial advice and should not be construed as such.