
My First Crypto Trading Strategy: A Study in Overfitting
Part 33 explores my early attempt at testing a crypto trading strategy

This is part 33 of my series — Building & Scaling Algorithmic Trading Strategies

This is reminiscent of my FX experience. At some point in any multi-sleeve setup you look over at crypto — much like FX — and think: “Surely there’s some clean, orthogonal alpha sitting in crypto.”
So I built a crypto trading bot.
The Strategy
I created a long-only BTC strategy with the usual features I’d use in an equities strategy:
EMA20/EMA50 trend filter (bull markets only)
ATR-based volatility gates (avoid choppy conditions)
Medium-volatility entries with breakout confirmation
Dynamic position sizing and trailing stops
Regime-aware exits
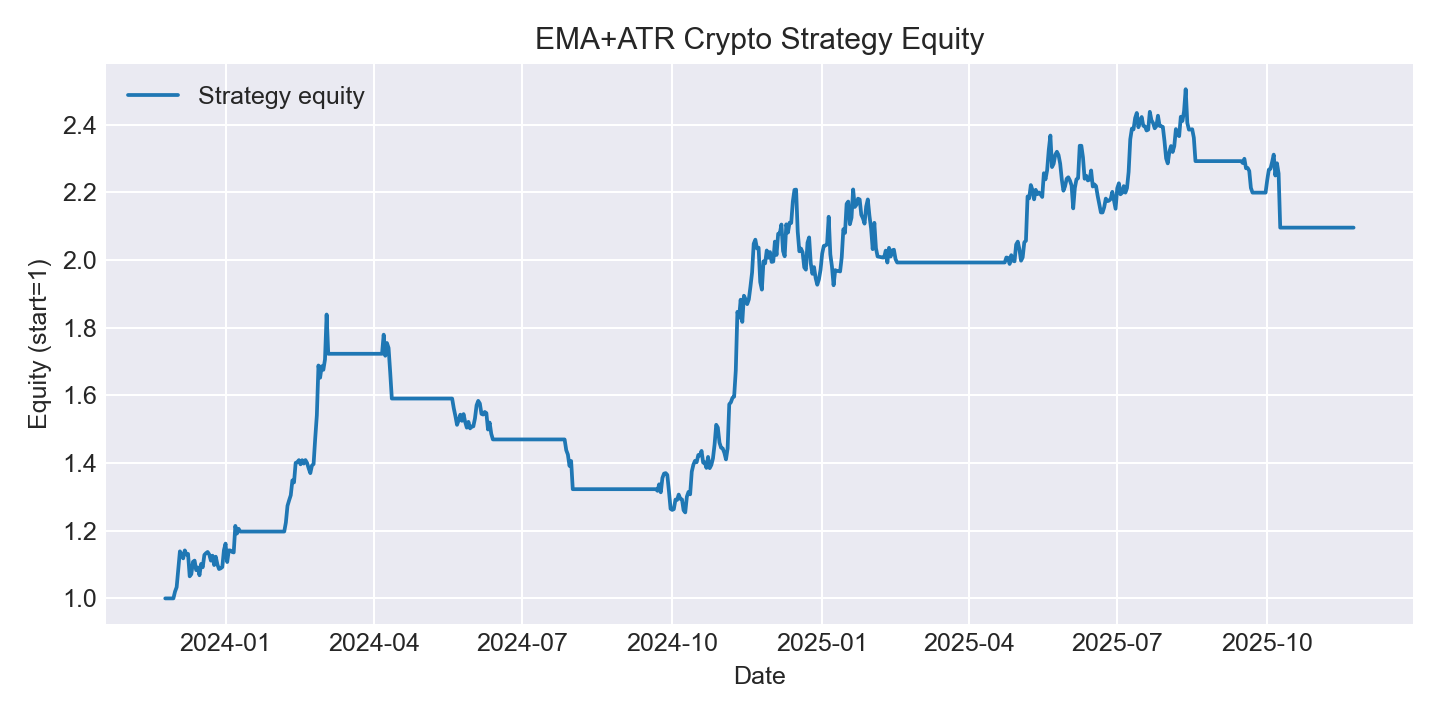
I tested 432 parameter combinations to find the optimal settings. The results looked promising:
ROI: 109.6%
CAGR: 44.9%
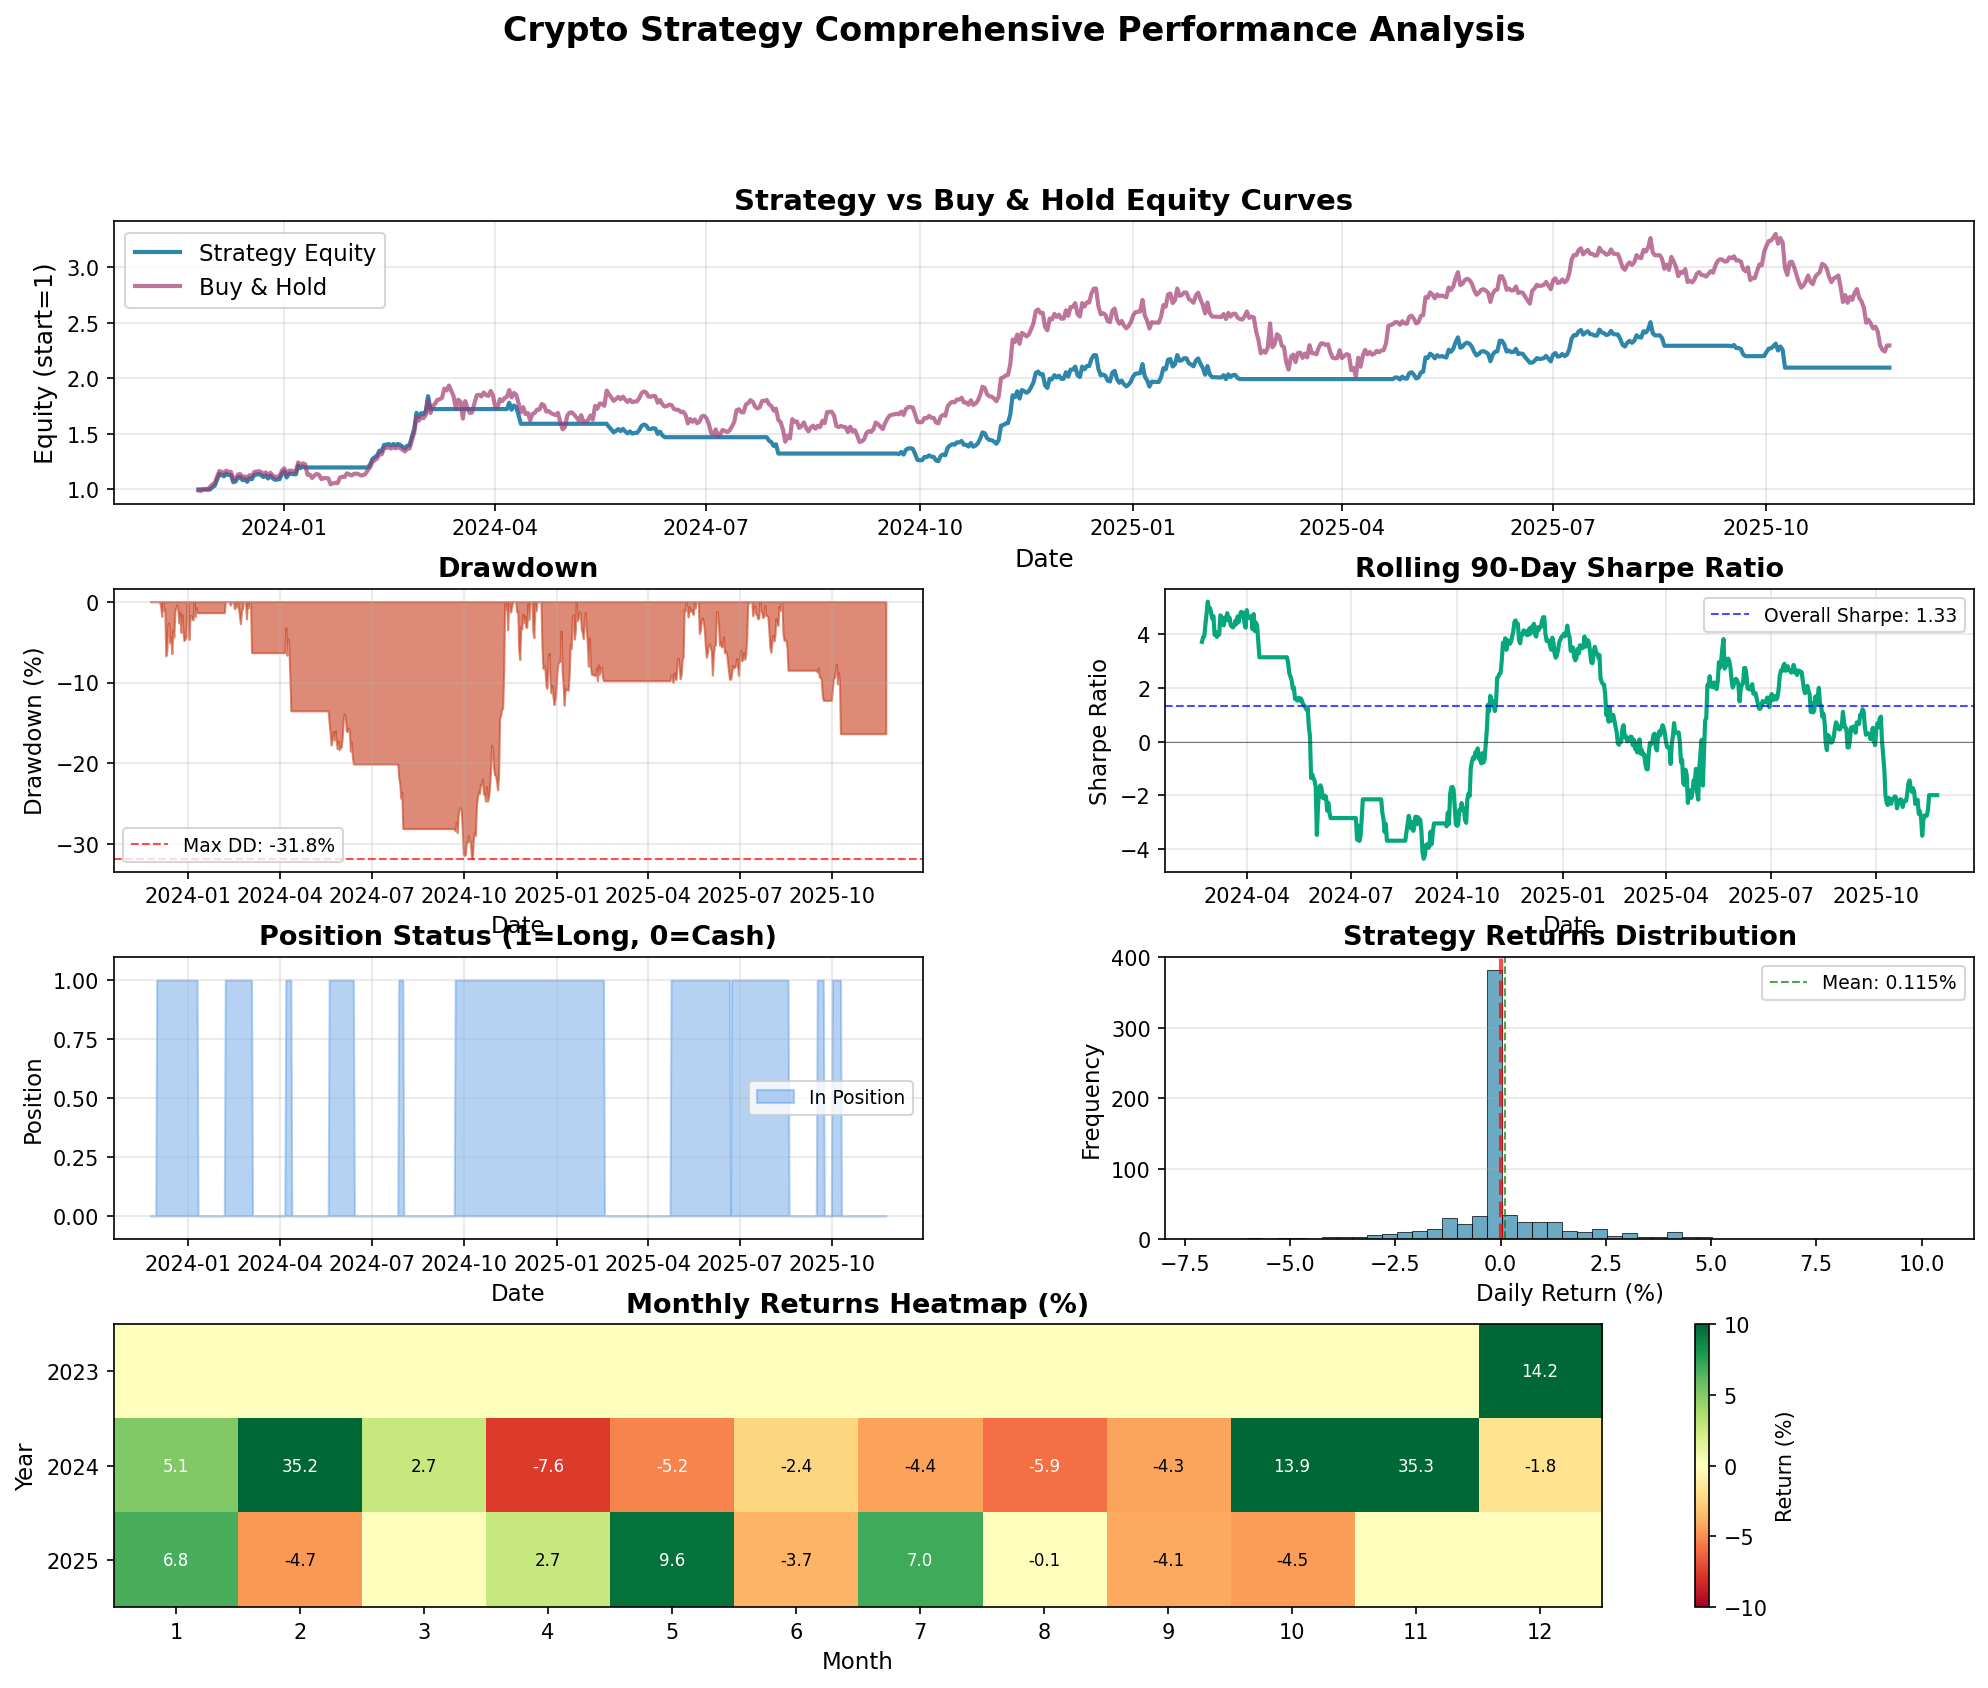
Sharpe Ratio: 1.33
Max Drawdown: -31.8%
Win Rate: 27.1%
The Problem
My strategy looked great. Then I compared it to buy and hold.
Buy and hold returned 129.6%. My sophisticated strategy underperformed by 20%.
This alone invalidates everything. But it gets worse.
What Went Wrong
1. Textbook Overfitting
I optimized 432 parameter combinations on the same data the strategy traded. This is curve-fitting dressed up as strategy design. The regime dependency is obvious:
2023 performance: 14% ROI
2024 performance: 83% ROI
86% of returns came from a single year. That’s not a strategy—that’s accidentally finding parameters that match 2024’s price action.
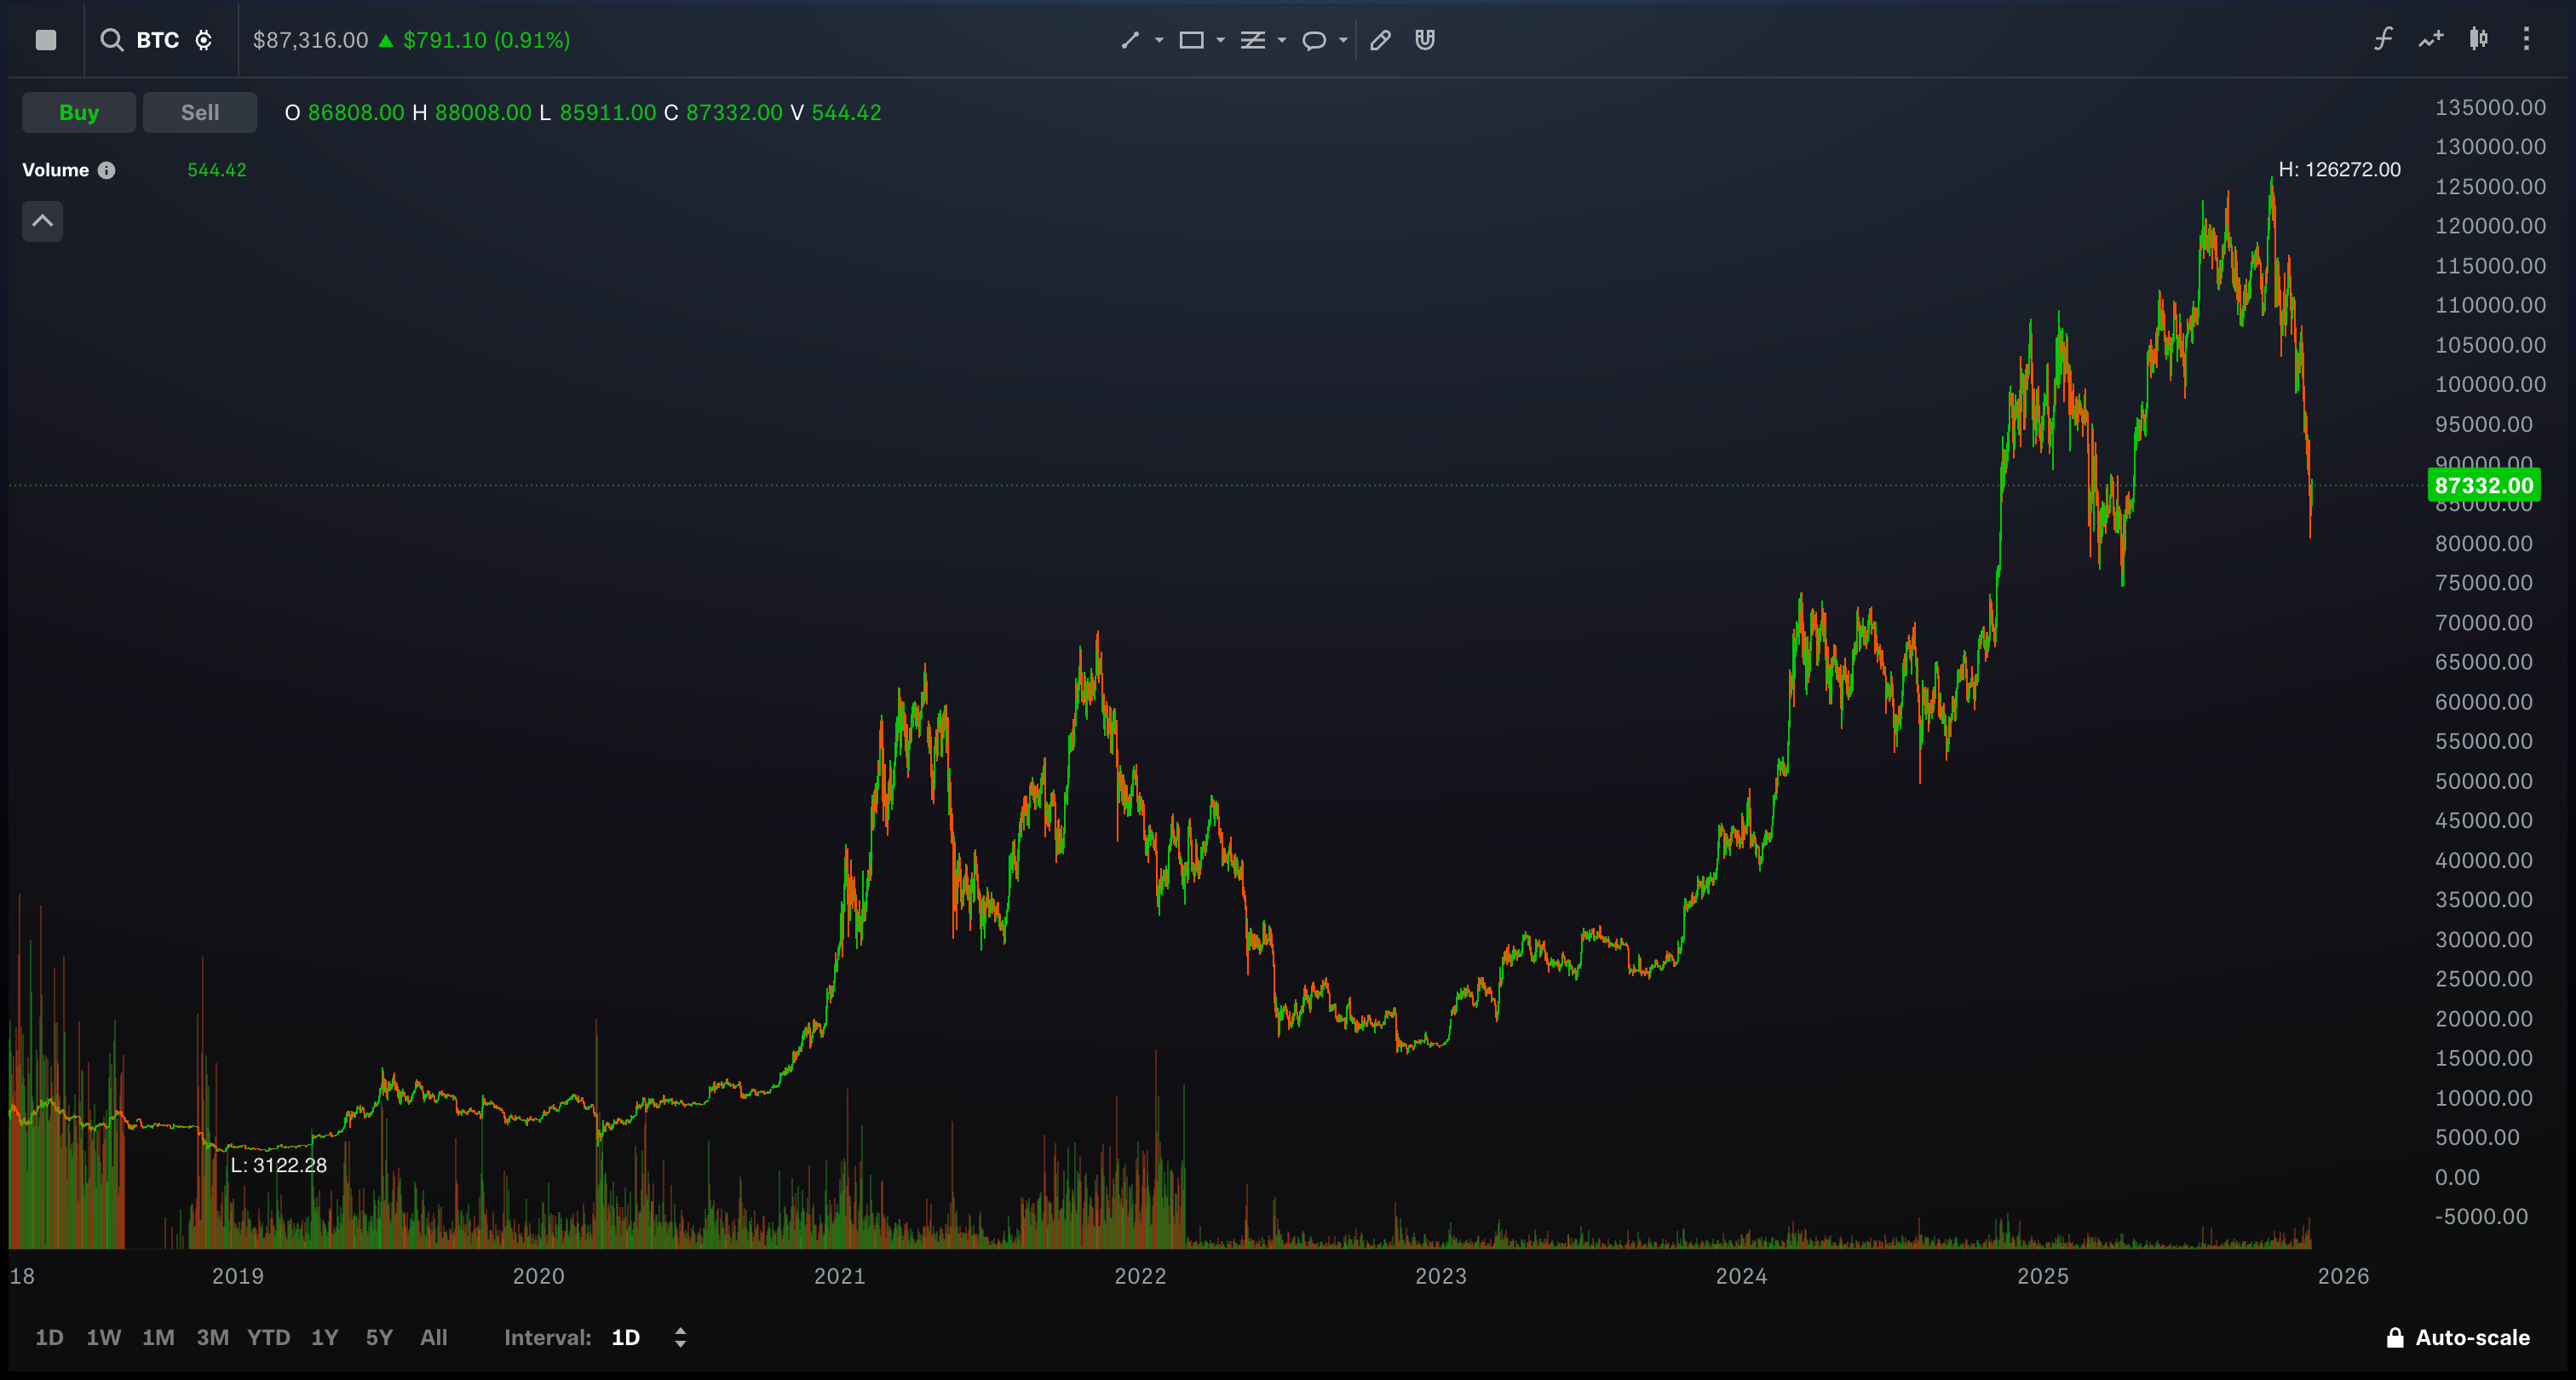
2. Insufficient Data
Two years of backtesting (Nov 2023 - Nov 2025). Industry standard is 5-10 years minimum. I tested through exactly one bull market and zero bear markets. Might as well have fit the strategy to a coin flip.
3. Missing Transaction Costs
The backtest ignores the ~2% cost impact from 10 trades. Real trading would perform even worse.
4. Low Win Rate
27% of trades are profitable. The strategy depends entirely on a few large winners—the exact kind of setup that evaporates when market conditions change.
What’s Needed
Walk-forward analysis (train on 60%, test on 20%, validate on 20%)
Walk-forward optimization with out-of-sample testing & validation
Monte Carlo simulation
Include transaction costs (0.2-0.5% per trade)
Test on 5-10 years of data
Test across multiple markets: bear market (2022), bull market (2024), sideways (2019)
Add stronger entry filters
Use mean reversion for exits instead of pure trend following
Test across multiple assets (BTC, ETH, SOL, etc.)
What I’m Doing Instead
Holding BTC. It outperforms my strategy by 20% with zero effort.
Cryptocurrencies carry significant risks and may not be suitable for all investors. The information presented in Math & Markets is not investment or financial advice and should not be construed as such.
"Buy and hold returned 129.6%. My sophisticated strategy underperformed by 20%." That's a brutal benchmark. Easy to forget that the complexity has to justify itself against doing nothing.
I've started requiring strategies to beat a random baseline by a statistically significant margin before I take them seriously. Similar idea though different framing.
Scared of crypto though - still too Wild West for me. In fairness, I'm undoubtedly missing great opportunities though.