
Positioning for the AI Endgame (Part 1)
The Setup: Why This Might Be the Best Asymmetric Opportunity in a Decade

This is a standalone piece on my perspectives on positioning for the AI endgame
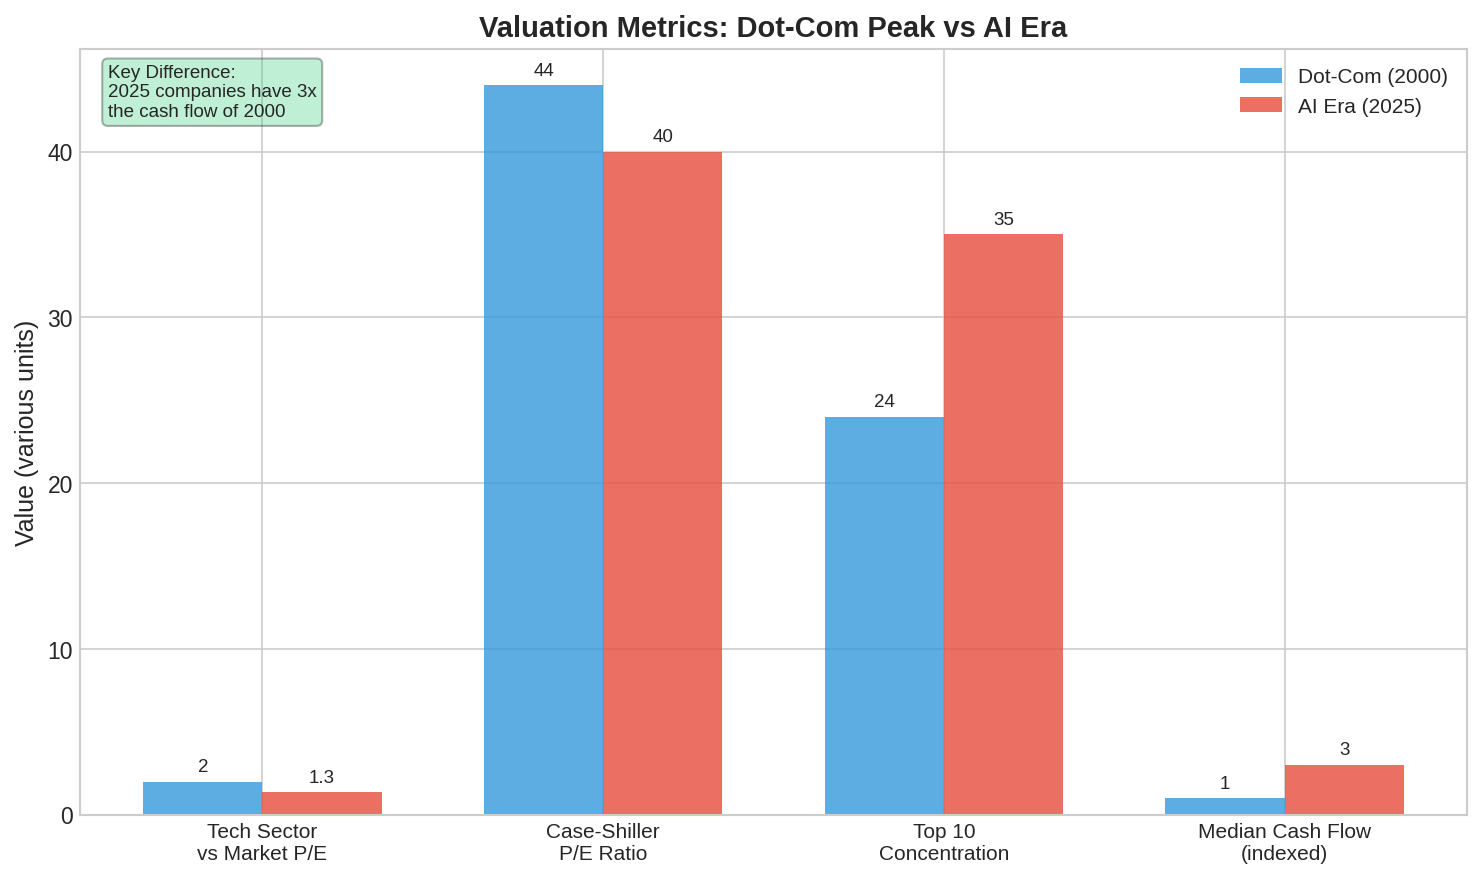
Everyone’s hand-wringing about the AI bubble. The concentration charts are getting passed around Twitter, the Shiller P/E is flashing red, and serious people at serious institutions are using words like “circular” and “unsustainable.”
But here’s what most of that analysis misses: periods of extreme market dislocation are when the biggest money gets made.
The dot-com bust created Amazon at $6. The 2008 crisis created the longest bull market in history. The COVID crash created generational entry points in basically everything.
I’m not here to tell you whether AI is a bubble or not — that’s a prediction game I refuse to play. I’m here to map out the specific scenarios that could unfold and identify where the asymmetric payoffs are hiding in each one.
Because whether AI investment persists or deleverages violently, someone’s going to make a lot of money. The question is whether that someone is you.
The Setup: What Creates the Opportunity
Let’s start with why this situation is so interesting from an alpha perspective.
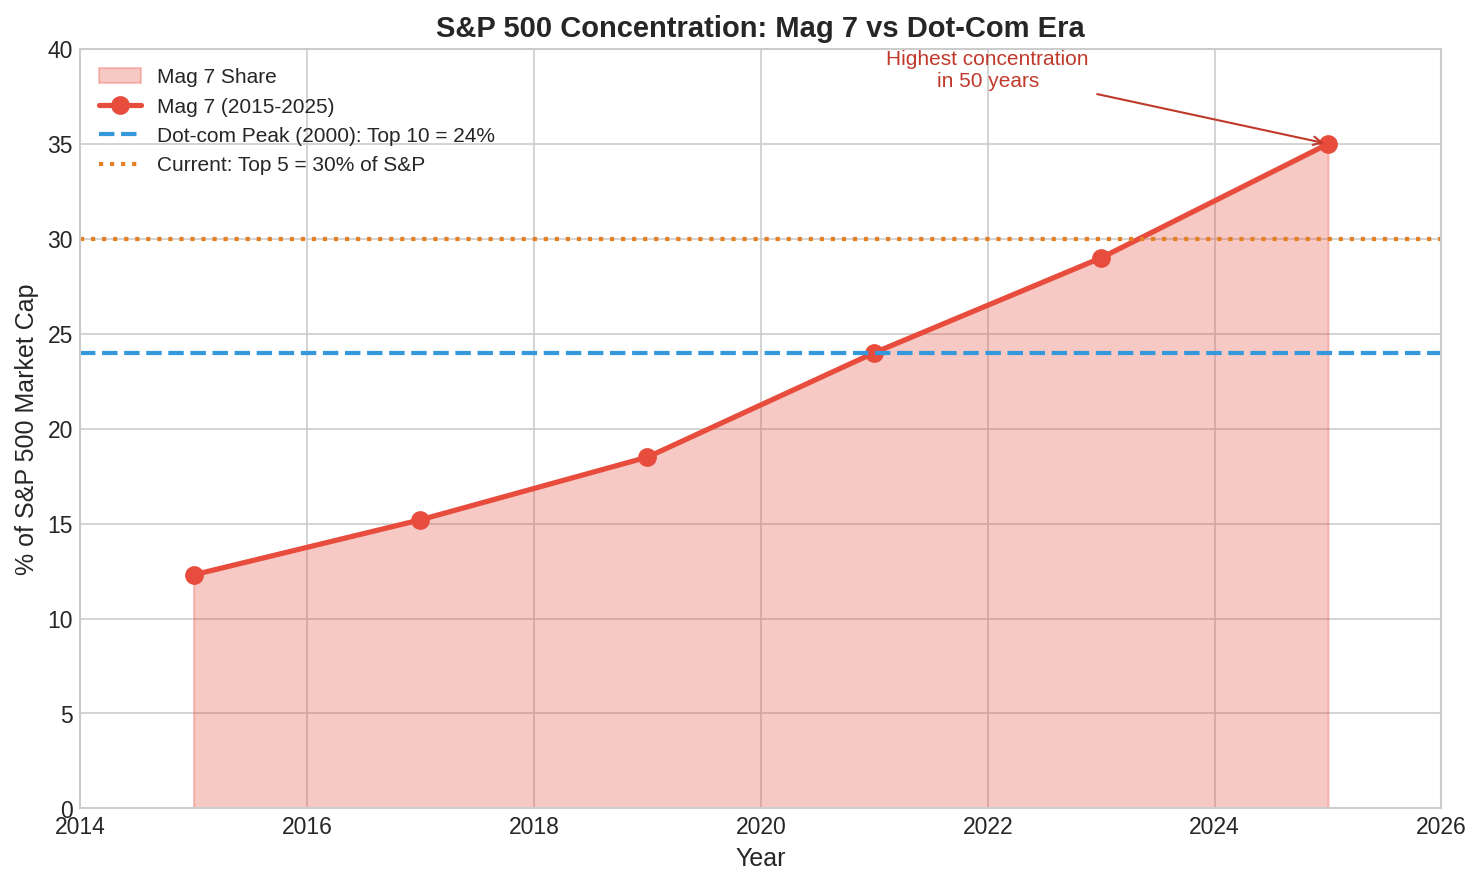
Extreme concentration creates mispricing. The top 5 companies now account for 30% of the S&P 500. The Magnificent 7 represent 35% of the index, up from 12.3% in 2015. This is the highest concentration in 50 years.
Why does this matter for making money? Because:
Passive flows are indiscriminate. Every dollar going into SPY buys 35 cents of Mag 7 regardless of valuation. This creates mechanical overweighting.
The “rest of the market” is neglected. The S&P 493 (everything except the Mag 7) has been starved of capital for years. That’s where mispricings accumulate.
Rotation, when it happens, is violent. When capital moves from concentrated positions, the velocity creates overshoots in both directions.
AI-related stocks have accounted for 75% of S&P 500 returns, 80% of earnings growth, and 90% of capital spending growth since ChatGPT launched. That’s not a market — that’s a trade. And trades unwind.
The Alpha Map: Two Scenarios, Multiple Payoffs
I’m structuring this as a scenario analysis, but not because I’m trying to predict which one happens. I’m doing it because each scenario has specific, identifiable trades with favorable risk/reward.
Scenario A: AI Investment Persists
If the buildout continues, the obvious trade (long Mag 7) is crowded and expensive. But there are second and third-order effects that aren’t priced:
The infrastructure arbitrage. Everyone’s long the AI companies, but the physical infrastructure providers are less crowded. Data centers need power — lots of it. Utilities exposed to hyperscaler demand have pricing power that isn’t fully reflected in their multiples. European utility stocks have rallied 20% relative to the STOXX 600 recently, but US utilities with data center exposure still trade at historical discounts.
The international discount. China’s AI stocks trade at massive discounts to US peers. The MSCI China Information Technology index is up nearly 100% in 2025, compared with near 30% for US tech — and it started from a much lower base. Alibaba trades at a P/S of 1.9x versus Palantir’s 94.4x. If AI monetization works anywhere, it probably works in China’s application-focused approach. That’s a valuation gap that screams opportunity.
The volatility harvest. AI stocks have elevated implied volatility. If the bull case plays out, that IV will compress. Selling premium on AI names — covered calls, cash-secured puts — generates 2-4% monthly income while you wait. You’re getting paid to be patient.
Scenario B: Deleveraging Occurs
This is where the real money is, historically speaking. Every major bubble burst has created generational buying opportunities. The question is: what do you buy, and when?
The dot-com playbook generated massive returns — but not in tech. During the 2000-2002 bust:
Consumer Staples returned +11.2% annualized while the S&P fell -22.3%
Southern Company (a utility) gained +132% total
Energy stocks returned +25% total
But here’s what most people miss: the stocks that survived the bust then generated enormous returns in the recovery. Amazon fell 94% from its 2000 peak — then returned 200x over the next two decades. The survivors of bubble bursts are where fortunes are made.
The relative value trade is already working. Europe has been outperforming the US in 2025 — its strongest relative start since 2000. European stocks trade at 14x forward P/E versus 22x for the US. If capital continues rotating out of concentrated US tech into cheaper international markets, you want to be positioned ahead of that flow.
The equal-weight arbitrage. The S&P 500 Equal Weight Index trades at a 29% discount to the cap-weighted index. When concentration unwinds, equal weight mechanically outperforms. In 2022’s tech selloff, RSP outperformed SPY by 6.5 percentage points. That’s not a hedge — that’s an alpha source.
The Wildcard: Stagflation Changes Everything
Here’s the scenario most people aren’t pricing correctly, and it’s where the biggest asymmetry might be hiding.
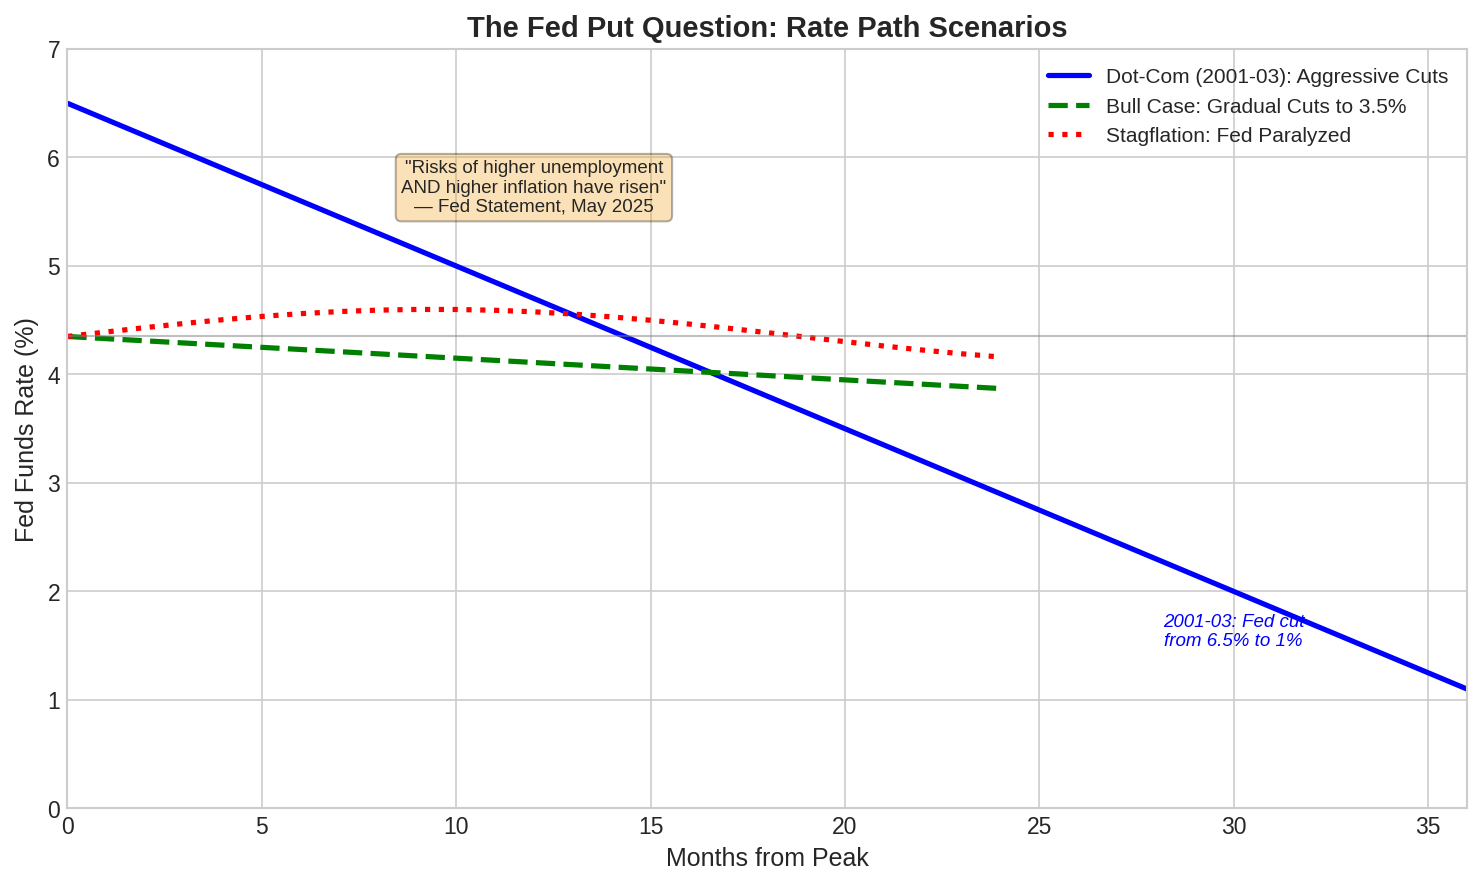
The Fed’s May 2025 statement noted that “the risks of higher unemployment and higher inflation have risen.” That’s stagflation language — and it has massive implications for positioning.
Why stagflation is different: In 2001-2003, the Fed cut rates from 6.5% to 1%, providing a floor under asset prices. That “Fed put” is baked into current expectations. But if inflation stays sticky while growth slows, the Fed can’t cut. No Fed put means no floor.
Survey data shows investors expect only two rate cuts this year, with stagflation concerns elevated. If that’s right, growth stocks — which are long-duration assets — face multiple compression even without an earnings decline.
The stagflation trade: If this scenario plays out, the winners are:
Short-duration assets (cash, short-term bonds at 4%+)
Real assets with pricing power
Companies with inelastic demand (utilities, staples, healthcare)
International markets with independent monetary policy cycles
Europe is expecting 100 basis points of cuts versus 25 for the US. That monetary policy divergence creates a carry trade opportunity.
The Global Rotation: Following the Money
Capital has to go somewhere. In 2000, there wasn’t much alternative to US tech. Today, there’s a massive valuation gap creating natural flow dynamics.
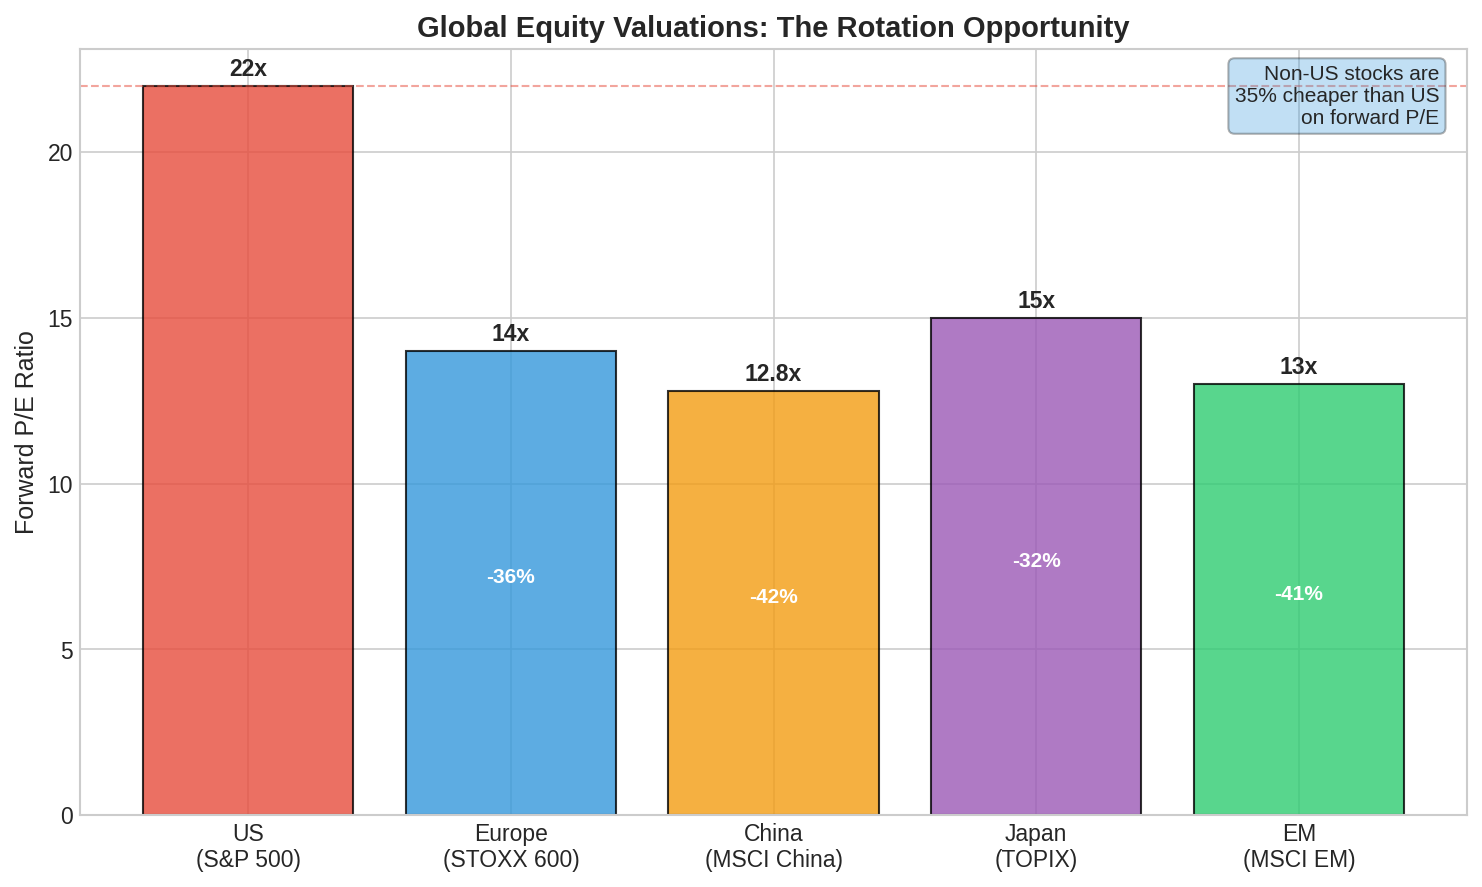
The numbers are stark:
US forward P/E: 22x
Europe forward P/E: 14x (36% discount)
China forward P/E: 12.8x (42% discount)
EM forward P/E: 13x (41% discount)
Even after 2025 outperformance, non-US stocks remain about 35% cheaper than US stocks. The dollar is down 8% in 2025, which amplifies international returns for US investors.
The rotation is already happening. In February, the pan-European STOXX 600 gained 3.3% while the S&P 500 lost 1.4% and the NASDAQ dropped 4%. This is Europe’s strongest relative start to a year since 2000.
Goldman Sachs notes that European value stocks are outperforming while US growth dominates — that’s the rotation in action. Positioning ahead of these flows is where the alpha is.
China’s AI narrative is different — and cheaper. China’s approach focuses on AI applications rather than infrastructure. If AI monetization proves difficult (as the MIT study suggesting 95% of AI projects generate zero return implies), the application-focused approach might actually work better. And you’re buying it at 12x earnings versus 22x.
The Circular Capex Problem: Where It Breaks
Understanding where the vulnerability is helps identify both the short opportunities and the survivors.
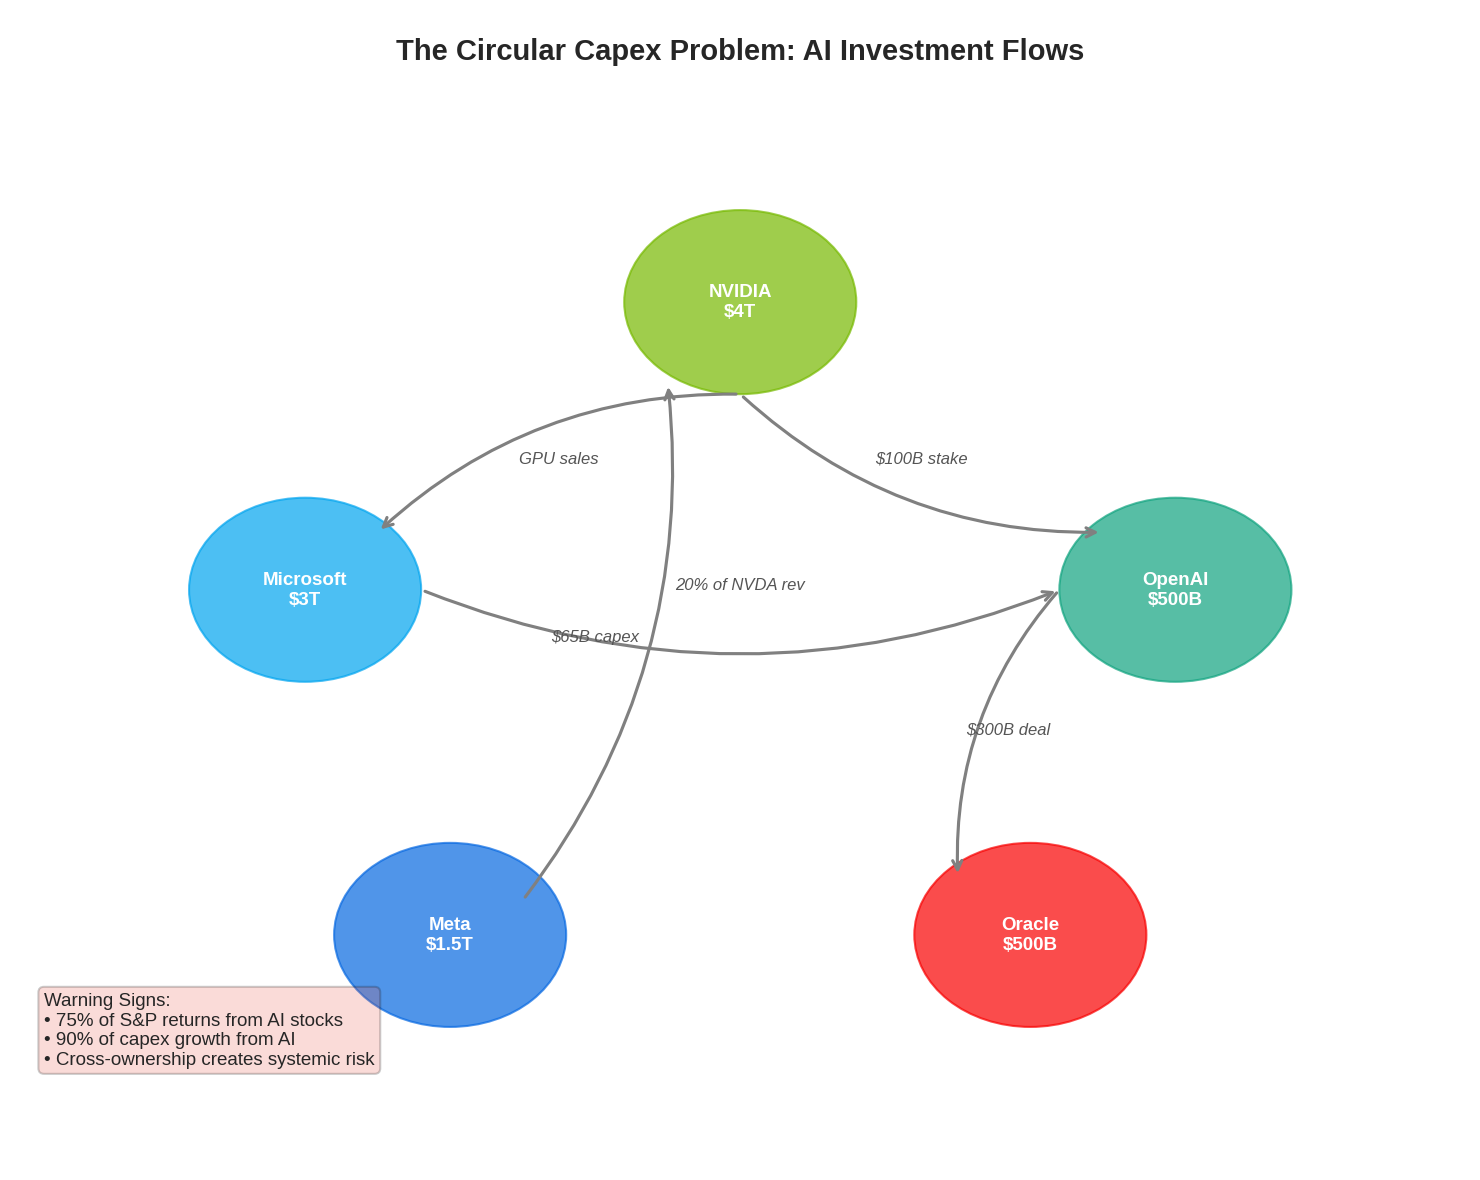
The AI investment ecosystem has developed circular dynamics: OpenAI takes a stake in AMD while Nvidia invests $100 billion in OpenAI. Microsoft is both a major shareholder of OpenAI and a major customer of CoreWeave, in which Nvidia holds significant equity. Microsoft accounted for almost 20% of Nvidia’s revenue.
Why this matters for trading: When circular flows break, they break everywhere at once. If you’re going to short AI (which I’m not recommending, but some will), you want to identify the weakest links — the companies most dependent on circular revenue rather than external demand.
Conversely, the survivors of any shakeout are the companies with real external revenue. Apple generates cash flow from actual consumers buying actual products. Google makes money from advertising that businesses pay for with real revenue. These are the names you buy on a 40% drawdown, not the names with circular AI revenue.
The Setup for Part 2
Here’s what we’ve established:
Extreme concentration creates mispricing — both in the concentrated names and in everything else
Two scenarios (persistence vs. deleveraging) each have specific, tradeable opportunities
Stagflation is the wildcard that changes the playbook entirely
Global rotation is already happening — positioning ahead of flows is the alpha source
The circular capex problem identifies both the vulnerabilities and the survivors
In Part 2, I’ll lay out the specific trades:
Bull case: Infrastructure plays, international AI exposure, volatility harvesting strategies
Bear case: The rotation trades, sector positioning, and when/how to buy the dip
The barbell: How to structure a portfolio that profits from both scenarios
The goal isn’t to predict which scenario wins. The goal is to identify the asymmetric payoffs in each one and size positions accordingly.
Because someone’s going to make a lot of money over the next 2-3 years. The setup is too good for it to be otherwise.
Next: Part 2 — The Trades: Specific Strategies for Both Scenarios
Data Sources: Wikipedia AI Bubble article, OECD Economic Outlook, Yale Insights, Goldman Sachs Research, Morgan Stanley Research, CNBC, J.P. Morgan Asset Management, Morningstar, Federal Reserve statements, BofA Global Research.
The information presented in Math & Markets is not investment or financial advice and should not be construed as such.