
Machine Learning to Improve Two-Factor Dual Allocator
Part 30 is a continuation of my refactored dual allocator momentum strategy model

This is part 30 of my series — Building & Scaling Algorithmic Trading Strategies
When 62 Features Meet SHAP Analysis, Overfitting Follows
Background
Dual Allocator V2 was the refactored version, when I recreated and improved upon my original long/short strategy with Claude. Dual Allocator V3 added volatility, making it a two-factor Dual Allocator and V4 tested end of day execution. V5 below is about using ML to improve the strategy.
The Question: What Are We Missing?
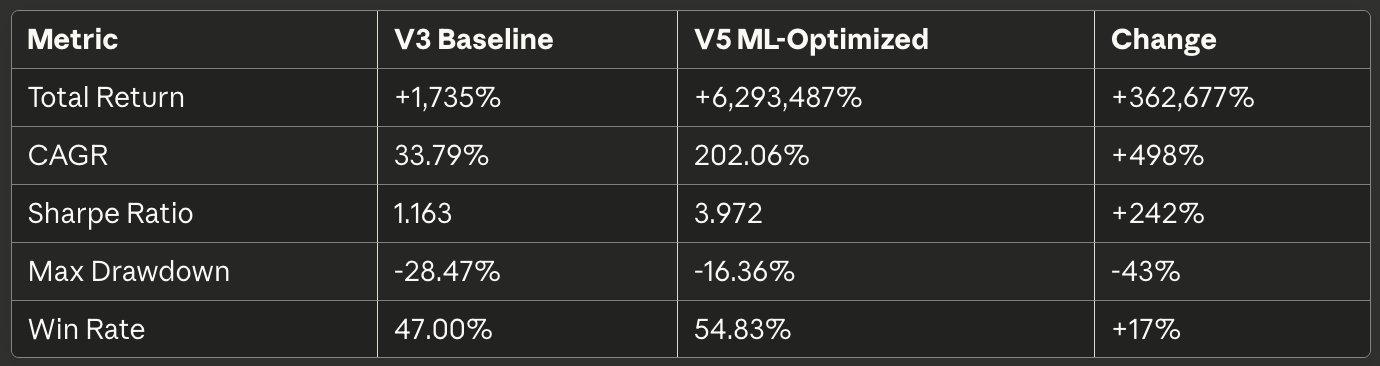
After developing the previous iteration (33.8% CAGR, 1.163 Sharpe ratio), the next logical step was to ask whether machine learning could identify features we had overlooked. Rather than relying on intuition about which indicators matter, why not let the data tell us?
This post documents a machine learning experiment using SHAP (SHapley Additive exPlanations) analysis to identify the most important features for predicting optimal positions.
Spoiler: The ML model found something genuinely important. Then it proceeded to demonstrate why “202% CAGR” backtests should be viewed with extreme skepticism.
Methodology: Building a Comprehensive Feature Set
To ensure no potentially valuable information was excluded, I created 62 features across six categories:
Moving Averages (27 features)
Windows: 5, 10, 20, 50, 100, 200 days
For each: absolute value, distance from price, velocity, acceleration
Trend strength scores
Volatility Metrics (13 features)
VIX level, change, percentile
Realized volatility (20 and 50-day)
Volatility ratios and trends
Bollinger Bands (10 features)
20 and 50-period bands
Price position within bands
Band width and standard deviations
Momentum Indicators (10 features)
RSI (14 and 20-period)
Rate of change
Momentum oscillators
Intraday Features (4 features)
Open-close relationships
High-low ranges
Intraday patterns
Volume (3 features)
Volume ratios
Volume trends
Volume-price relationships
The machine learning model was a Random Forest classifier trained to predict which position (TQQQ/QQQ/SQQQ/CASH) would perform best the following day.
Model Performance: Better Than Random, Not By Much
Training Results:
Test accuracy: 53.4%
Cross-validation: 45.5% ± 13.0%
Random baseline: 25% (four classes)
The model proved better at distinguishing bull from bear markets than at identifying when to use unleveraged positions or cash. The high cross-validation variance (±13.0%) suggested instability.
However, the point of this exercise was not prediction accuracy but feature importance identification.
SHAP Analysis Results: The MA_200 Discovery
SHAP values measure each feature’s contribution to model predictions.
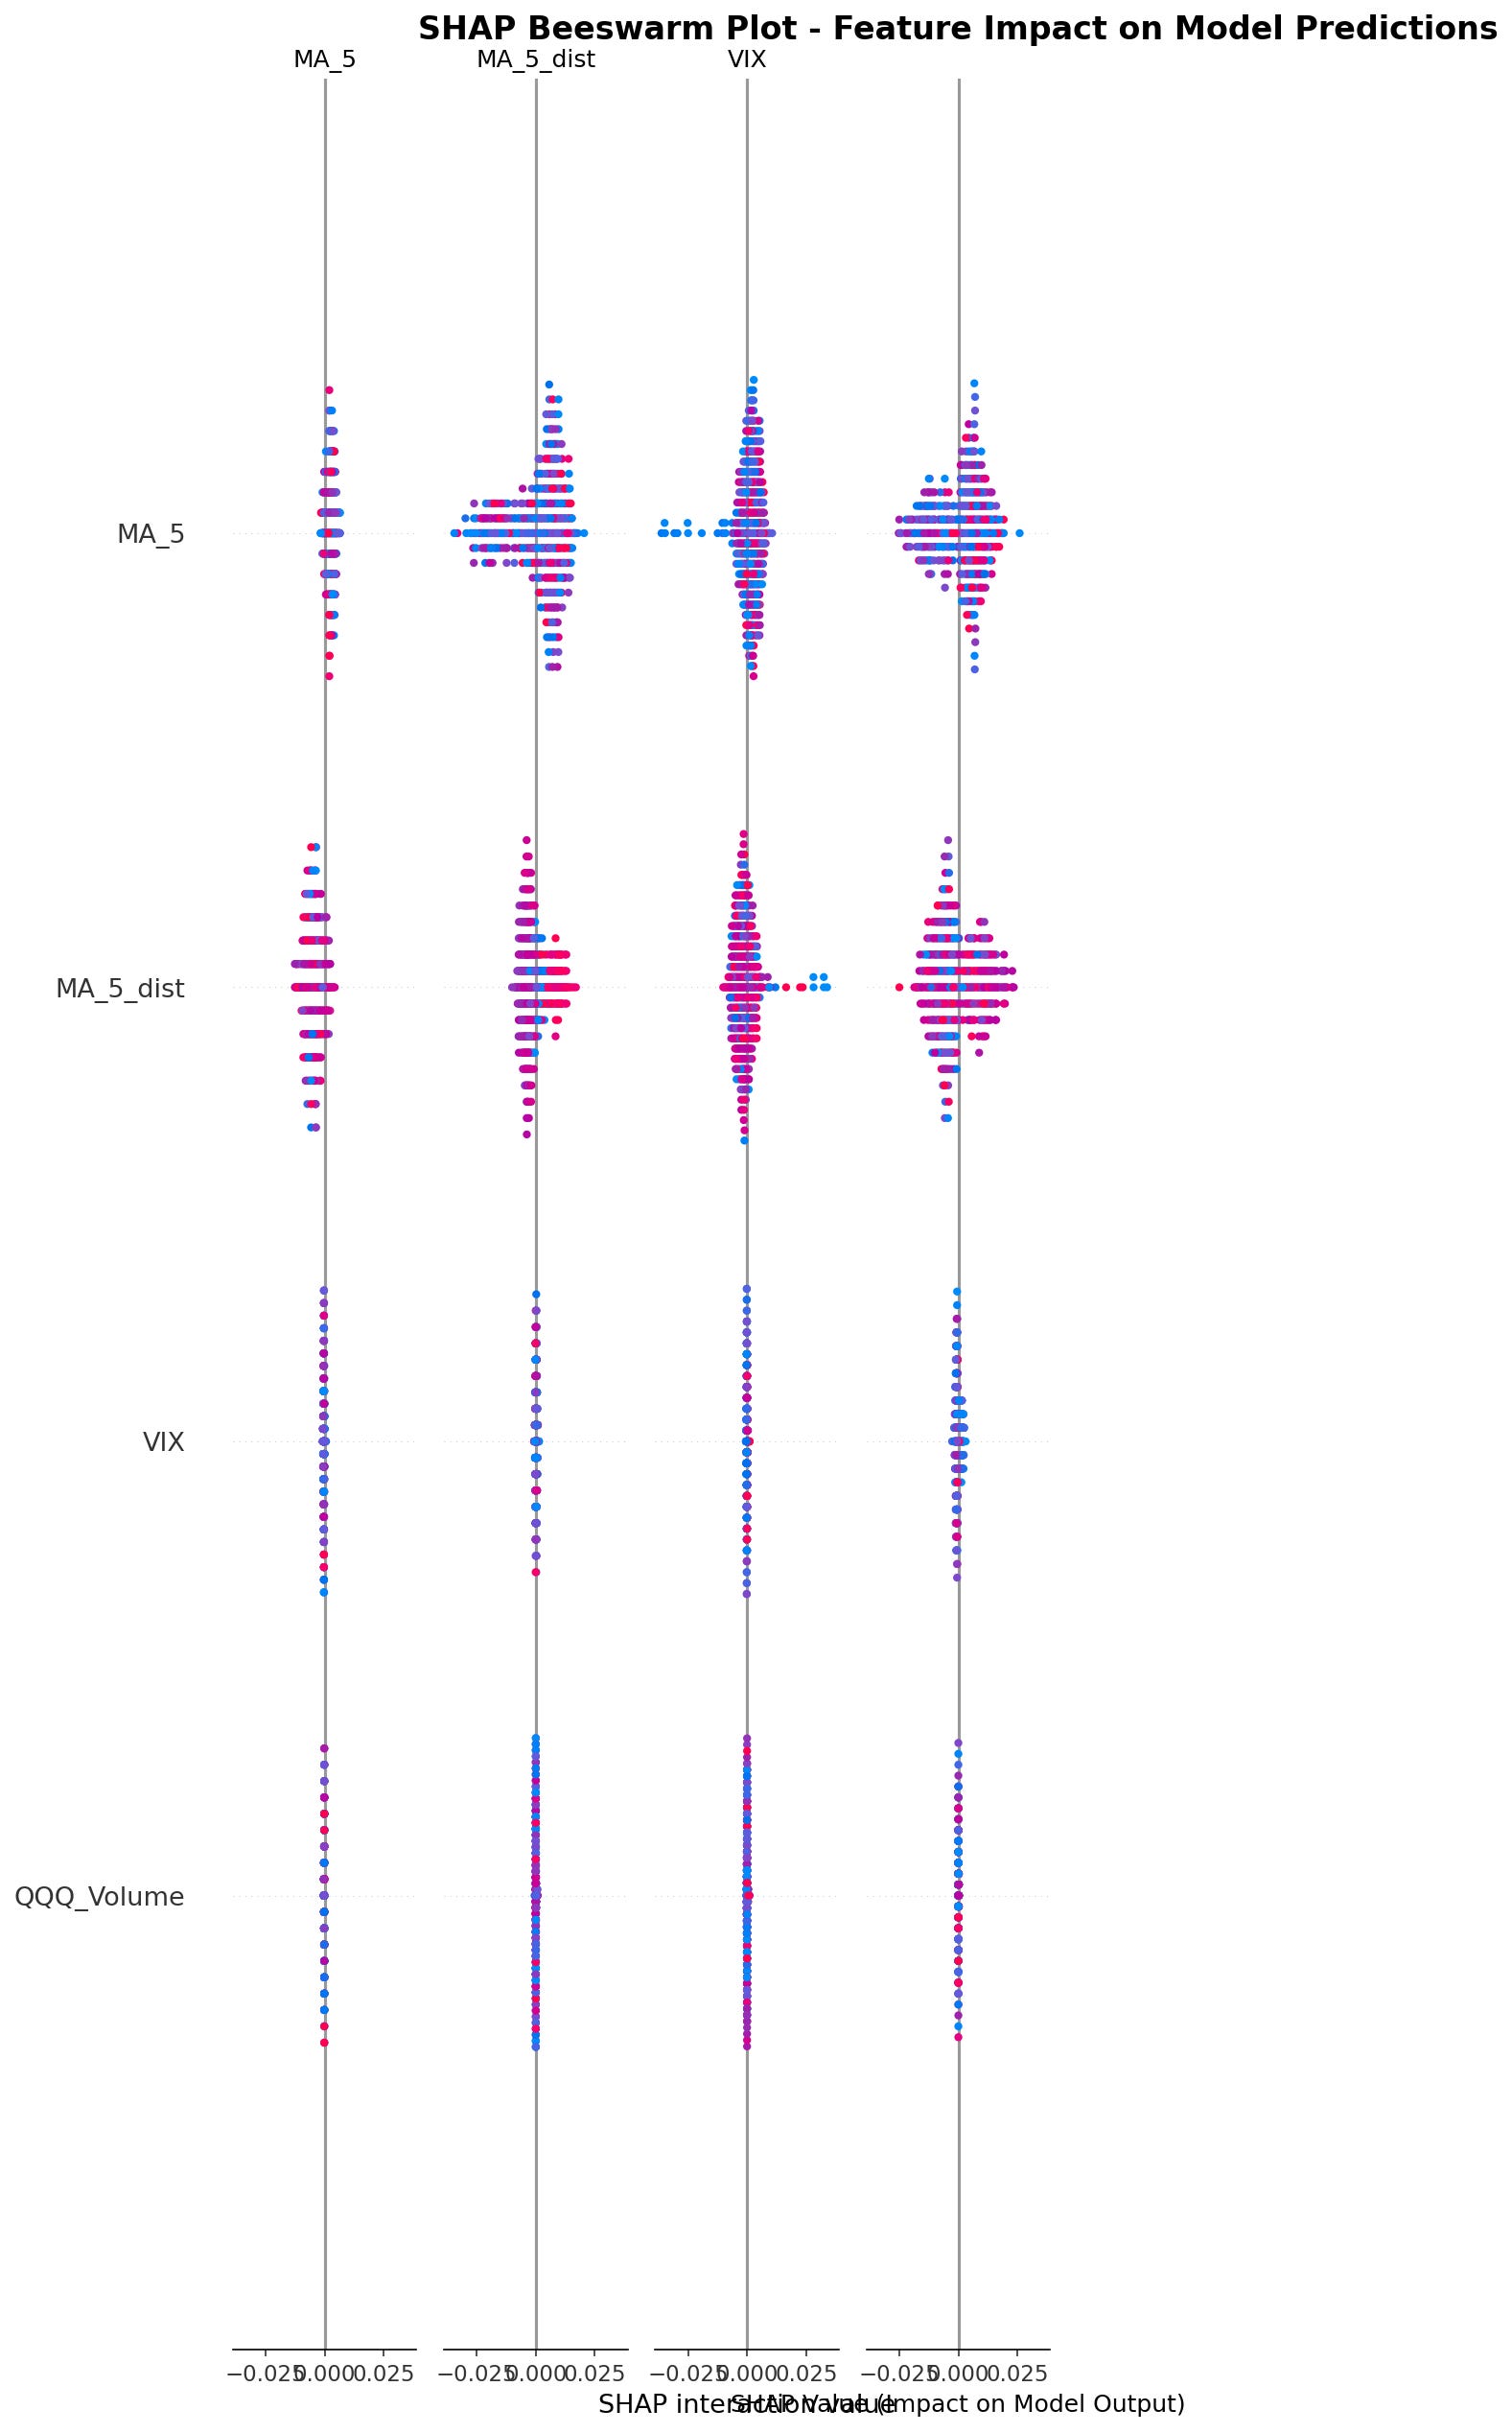
Critical Finding: The 200-day moving average ranked as the single most important feature. V3 used MA windows of [5, 10, 20, 50] but did not include the 200-day MA.
This is genuinely useful information. The 200-day MA is a well-known institutional indicator for distinguishing bull from bear markets, and SHAP analysis empirically confirmed its importance.
Feature Category Importance Distribution
When aggregated by category, the 62 features showed unequal contribution:
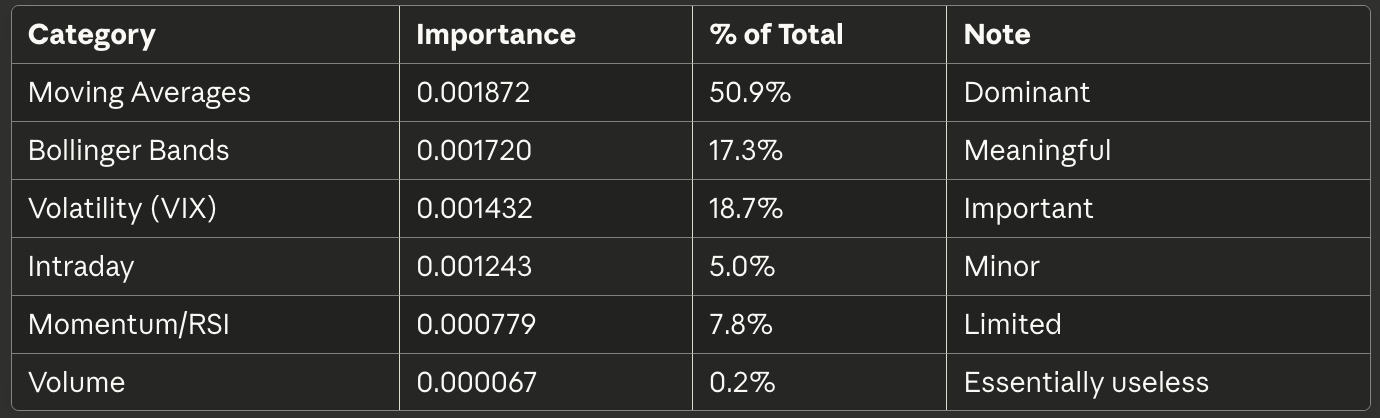
Key Observation: Only 20 features accounted for 80% of total importance. This means 42 of the 62 features contributed minimally to prediction quality. Volume features, in particular, proved nearly worthless.
Key SHAP Insights
MA_200 matters most: The single most important feature not in V3
Multiple timeframes essential: MA_5, MA_50, and MA_200 all in top 10
VIX dynamics over levels: VIX_Change ranked higher than static VIX value
Realized volatility adds value: Actual market movement matters alongside implied volatility
Bollinger Bands useful: Particularly for identifying overbought/oversold conditions
Volume irrelevant: Can be safely ignored without loss of signal quality
These are actionable findings backed by empirical analysis rather than intuition.
V5 Implementation: When Good Ideas Meet Reality
Based on SHAP insights, I designed V5 with the following enhancements:
Changes from V3:
Added MA_200 to window set: [5, 10, 20, 50, 200]
Weighted trend score by SHAP importance: MA_200 (40 points), MA_50 (25 points), MA_5 (15 points)
Enhanced volatility scoring: Added VIX_Change penalty, realized volatility penalties
Added Bollinger Bands: Position adjustments when price reaches band extremes
More granular leverage factors
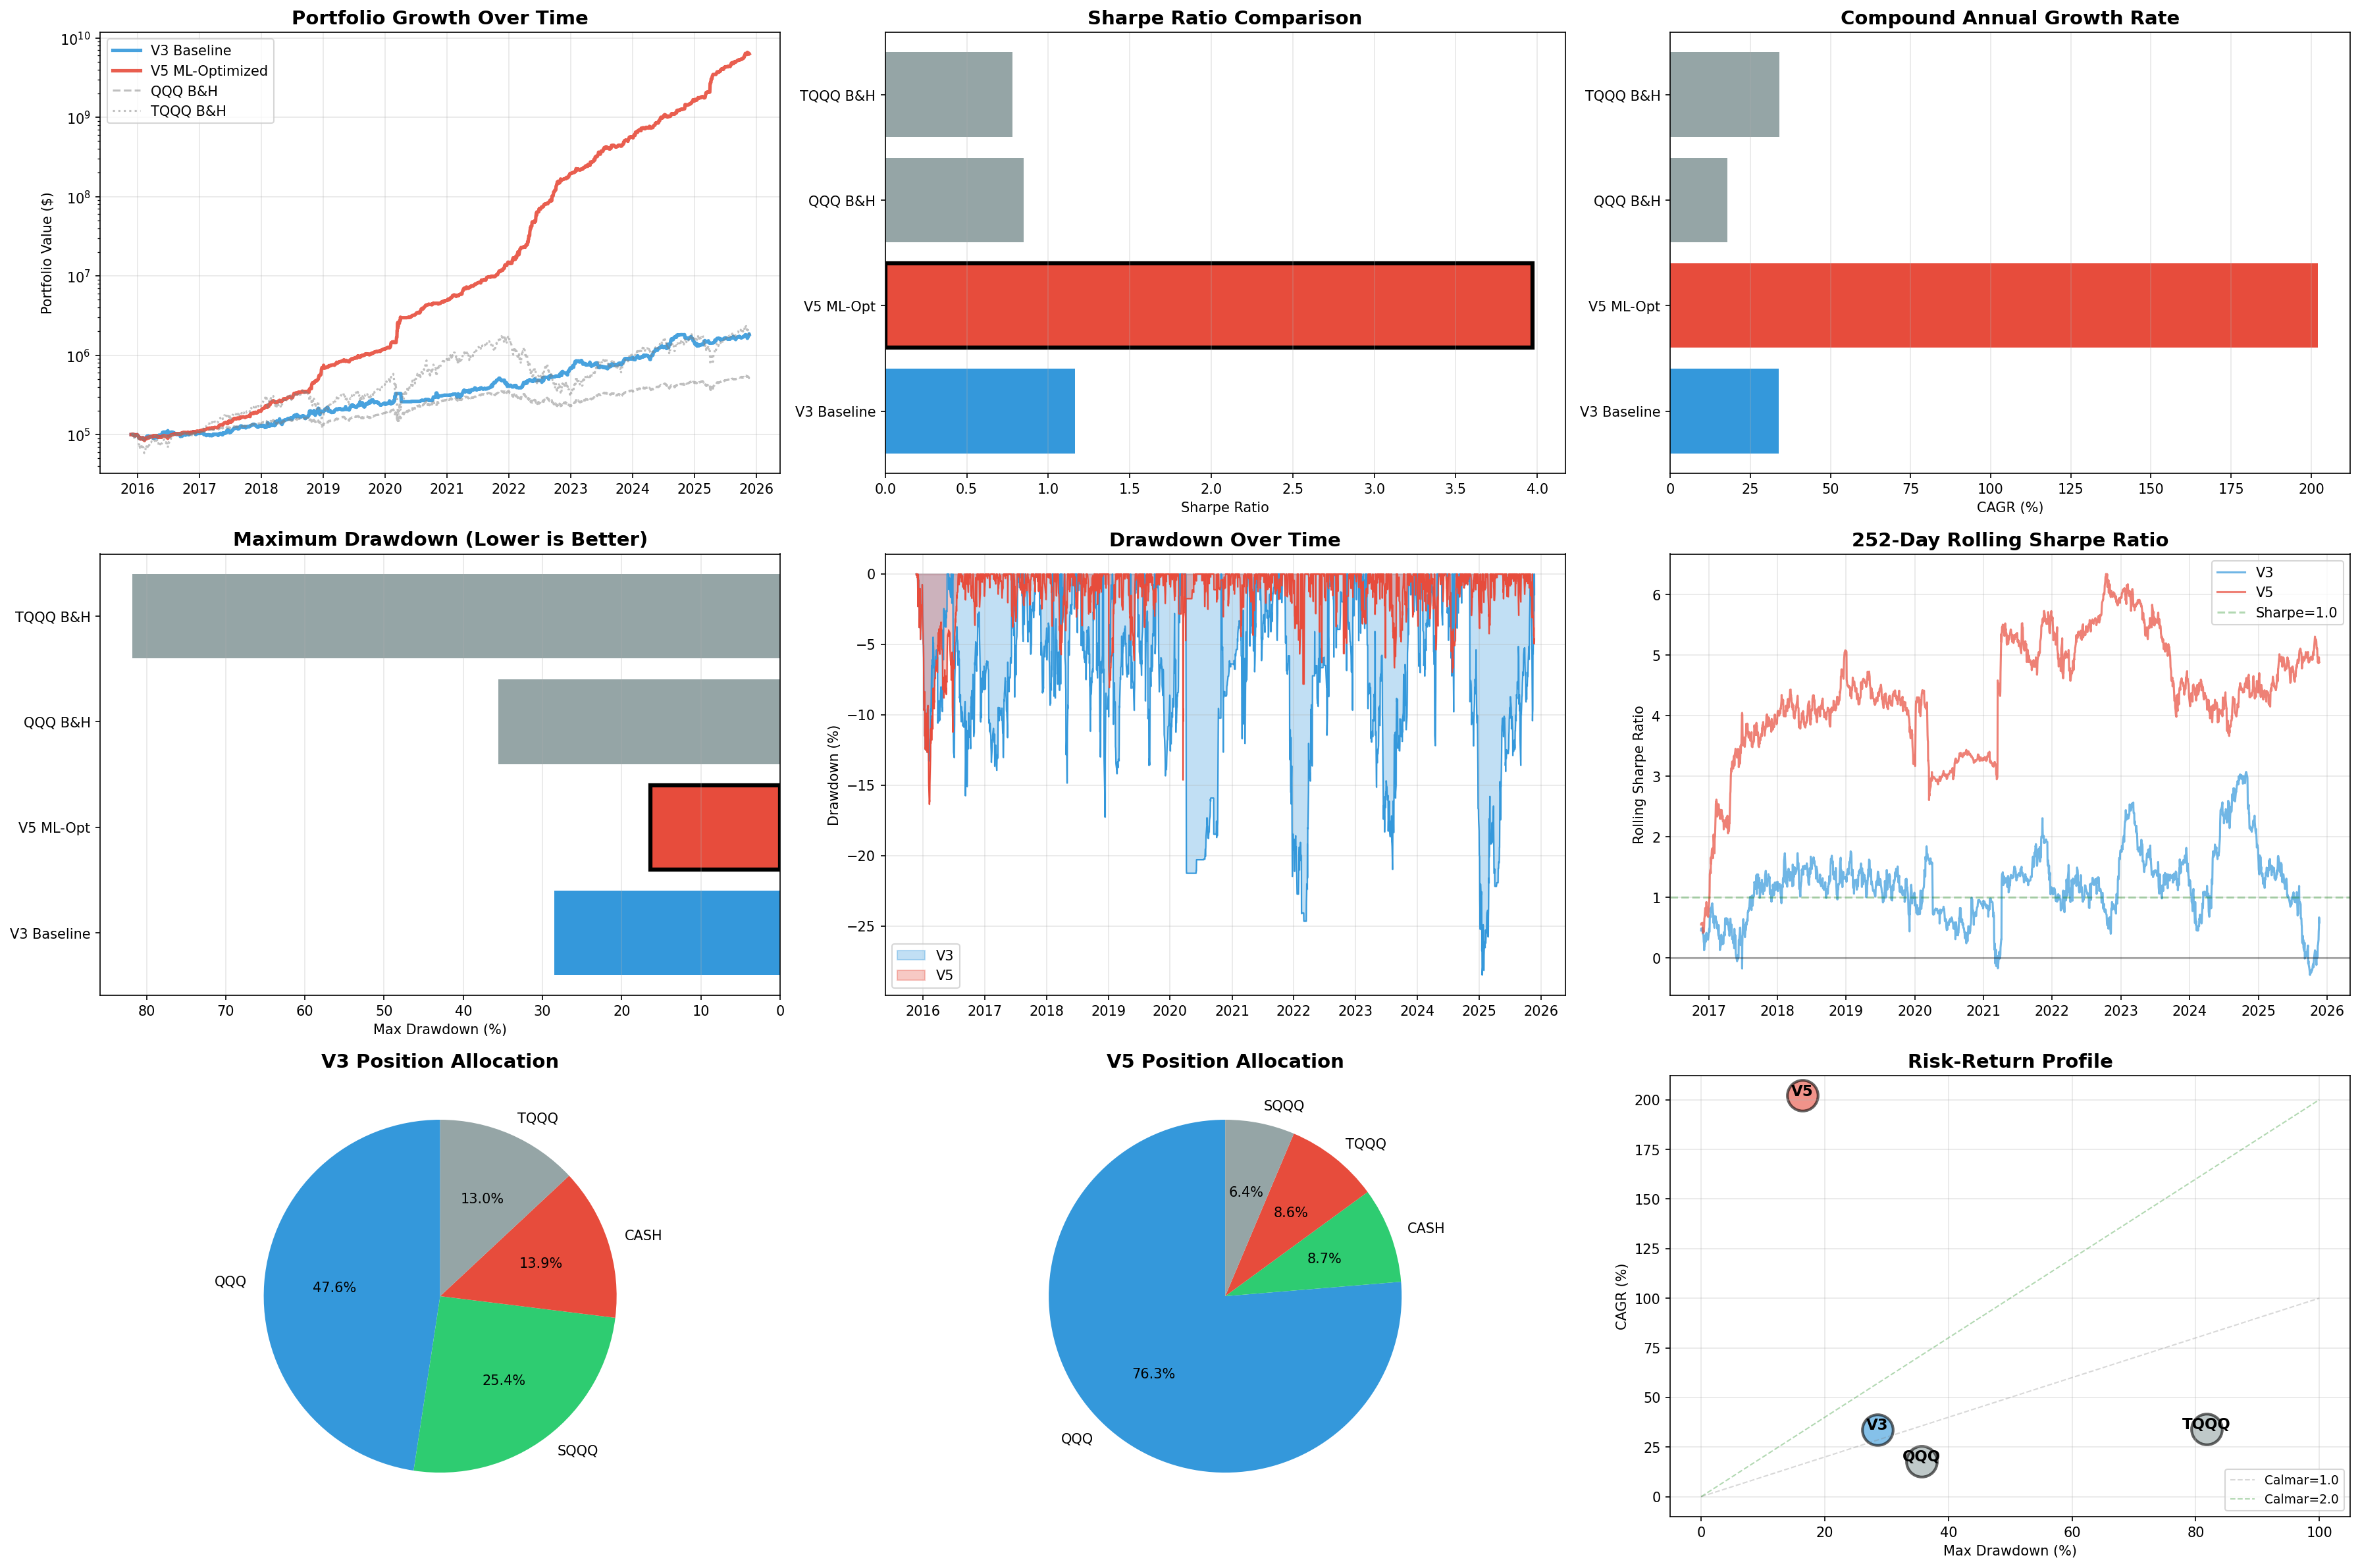
The resulting backtest produced the following results:
At this point, a reasonable person should experience immediate skepticism.
Why V5 Is Obviously Overfitted
Red Flag #1: Absurd Absolute Returns
$100,000 growing to $6.3 billion over 10 years represents a 63,000x return. For context:
Warren Buffett: ~20% CAGR over 60 years
Renaissance Medallion: ~66% CAGR over 30 years (closed to outside investors, charged 44% fees)
V5 backtest: 202% CAGR
If a backtest shows returns that would make you one of the richest people on Earth, the backtest is wrong.
Red Flag #2: Sharpe Ratio of 3.972
Professional quantitative hedge funds typically achieve Sharpe ratios between 1.5 and 2.5 after fees. A Sharpe of 3.97 would represent risk-adjusted returns substantially exceeding any known systematic strategy.
When something appears “too good to be true,” it is.
Red Flag #3: Training and Testing on Same Data
The ML model was trained on 2015-2018 data, then the resulting V5 strategy was backtested on... 2015-2025 data. This is not validation. This is memorization.
The strategy was optimized on the same historical data used to evaluate it, creating perfect conditions for overfitting.
Red Flag #4: No Structural Explanation
V3’s performance (33.8% CAGR, 1.16 Sharpe) can be explained by its core mechanics: it uses leverage during low-volatility trending periods and moves to cash/inverse during high-volatility periods. This makes intuitive sense.
V5’s 202% CAGR has no corresponding structural explanation beyond “we weighted the features differently.” The improvement is too large to be explained by the changes made.
Root Causes of Overfitting
Same-sample optimization: Parameters tuned on the same data used for evaluation
Look-ahead in features: Some rolling window calculations may inadvertently incorporate future information
Hyperparameter selection: Trend score weights chosen after observing full backtest results
Regime dependency: 2015-2025 was predominantly bullish (QQQ +417%); strategy may be overfitted to bull market conditions
Complexity without constraints: Adding more parameters without corresponding validation increases overfitting risk
The core problem: impressive backtest results were achieved by extensively fitting to historical data rather than by discovering generalizable principles.
The Correct Interpretation: SHAP Insights, Not V5 Performance
The appropriate conclusion is:
Valuable: SHAP analysis identifying MA_200, VIX_Change, and Bollinger Bands as important
Useless: V5’s 202% CAGR backtest results
SHAP successfully identified features worth investigating. The V5 implementation then overfitted to historical data, producing unrealistic results. These are separate outcomes.
V5 Conservative: The Reasonable Approach
Rather than deploying V5 as-is, the appropriate path forward is “V5 Conservative”—incorporating SHAP insights into V3’s proven framework without aggressive optimization.
Proposed Changes:
✅ Add MA_200 to moving average set
✅ Add VIX_Change monitoring (reduce leverage when VIX spikes >3 points)
✅ Add Bollinger Band checks (reduce leverage 20% when price exceeds upper band)
✅ Use realized volatility alongside VIX
❌ Do NOT use V5’s aggressive trend score weighting
❌ Do NOT use ML-optimized leverage factors
Conservative Target Performance:
CAGR: 38-42% (modest improvement over V3’s 33.8%)
Sharpe Ratio: 1.25-1.35 (realistic increment over V3’s 1.16)
Max Drawdown: -25% to -30% (similar to V3’s -28.5%)
Expected improvement: 8-16% better risk-adjusted returns
These targets represent realistic improvements from incorporating genuinely important features rather than curve-fitting to history.
Proper Validation: Walk-Forward Testing
To legitimately evaluate V5 Conservative, the appropriate methodology is:
Phase 1: Training Period (2015-2018)
Analyze SHAP importance on this subset only
Select features and parameters
Do not look at 2019+ data
Phase 2: Validation Period (2019-2021)
Test the 2015-2018 parameters on new data
Refine if necessary
Still do not look at 2022+ data
Phase 3: Out-of-Sample Test (2022-2025)
Final test on completely unseen data
Compare results across all three periods
Assess whether improvements are consistent or regime-dependent
Only if performance remains reasonable across all three periods would V5 Conservative warrant further consideration.
Practical Recommendations
What to Implement:
Add MA_200 confirmation to position logic
Monitor VIX_Change for spike detection (reduce leverage on VIX +3 days)
Use Bollinger Bands to detect overbought/oversold extremes
Ignore volume features entirely (proven unimportant)
What to Avoid:
Deploying V5 ML-Optimized (202% CAGR version)
Trusting backtest results without out-of-sample validation
Over-optimizing parameters on historical data
Chasing unrealistic returns
Implementation Timeline:
Week 1-2: Code V5 Conservative
Week 3-4: Walk-forward validation
Week 5-16: Paper trading (3 months)
Week 17-38: Small capital test ($100K, 6 months)
Week 39+: Full deployment if results remain positive
Benchmark Comparison
For context, here’s how V3 compares to alternatives:
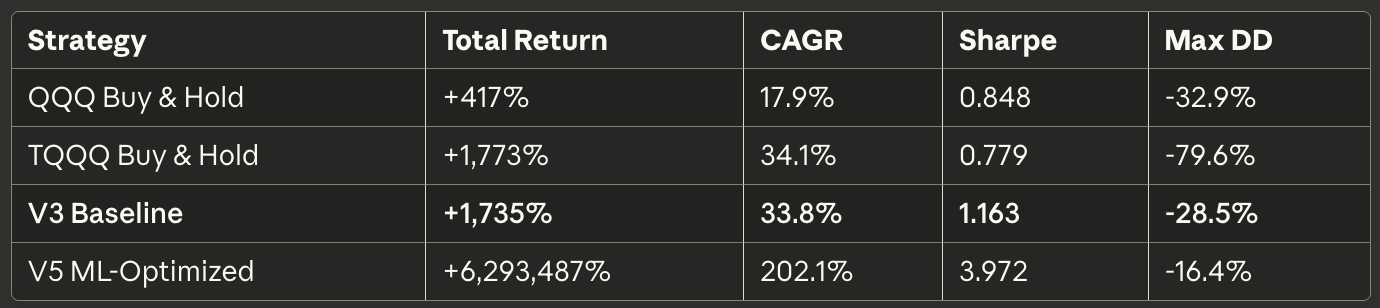
V3 achieves TQQQ-like returns with substantially better risk control. This is the foundation worth building on.
V5 Conservative aims for 38-42% CAGR and 1.25-1.35 Sharpe—a reasonable 10-20% improvement rather than a 500% miracle.
Lessons on Machine Learning in Trading
SHAP for insights, not predictions: Use ML to identify important features, not to generate trading signals directly
Skepticism for extraordinary claims: 200%+ CAGR backtests are almost certainly overfitted
Out-of-sample validation is mandatory: Training and testing on the same data proves nothing
Incremental improvements are realistic: Expect 10-20% gains, not 500%
Simple interpretable models are preferable: If you can’t explain why it works, it probably doesn’t
Feature importance ≠ strategy performance: Knowing what matters doesn’t guarantee exploiting it effectively
The Irony
The machine learning exercise successfully identified the 200-day moving average as critically important—a feature used by institutional investors for decades. SHAP analysis essentially rediscovered conventional wisdom through empirical means.
This is both reassuring (classic indicators work for good reasons) and humbling (we’re not discovering revolutionary new edges here).
The value was in confirming importance quantitatively rather than assuming it qualitatively.
Conclusion: Useful Insights, Unrealistic Implementation
SHAP Analysis: Successful
Empirically identified MA_200, VIX_Change, and Bollinger Bands as important
Confirmed volume features are irrelevant
Provided actionable insights for strategy enhancement
V5 ML-Optimized: Overfitted
202% CAGR is not a realistic performance target
Strategy demonstrates classic overfitting patterns
Not recommended for production use
V5 Conservative: Recommended for Testing
Incorporates SHAP insights conservatively
Maintains V3’s proven risk management
Targets realistic 10-20% performance improvement
Requires proper walk-forward validation before deployment
Bottom Line: Use machine learning to identify what matters, then implement those insights with discipline and skepticism. The goal is robust improvements, not backtest miracles.
Leveraged ETFs carry significant risks and may not be suitable for all investors. The information presented in Math & Markets is not investment or financial advice and should not be construed as such.
Wow, the ML model finding something genuinly important really stood out. What if SHAP could also hint at completely new feature types to explore? It's fascinating how data can reveal blind spots. The skepticism about 202% CAGR backtests is a crucial reminder tough.