
Lookahead Bias: From 3 Strategies to 1
Part 31 talks about the importance of backtesting in filtering out biases

This is part 31 of my series — Building & Scaling Algorithmic Trading Strategies
The Harsh Truth About Backtesting
I thought I had three exceptional trading strategies. The numbers looked incredible: CAGRs ranging from 31% to 58%, Sharpe ratios above 1.0, and ROIs that would make any quant fund jealous. Then I did what every trader should do but many don’t: I looked for lookahead bias.
By the end of this analysis, only one strategy remained standing. The other two collapsed spectacularly when I fixed critical flaws in my backtesting logic.
The Starting Lineup
I had narrowed my research down to three promising strategies:
1. Two-Factor Dual Allocator (V3)
A volatility-enhanced allocation strategy that dynamically adjusts leverage between SPY and leveraged ETFs based on market conditions.
Initial metrics (≈10 years):
ROI: 14.48x
CAGR: 31.5%
Sharpe: 1.08
Max Drawdown: 31.2%
2. VIX Term Structure Strategy
A mean-reversion play on the VIX futures curve, going long XIV (short VIX) when the curve is in contango and flat otherwise.
Initial metrics (≈5.3 years):
ROI: 11.28x
CAGR: 57.7%
Sharpe: 0.70
Max Drawdown: 28.0%
3. SPY/VIX Synthetic Toggle
A machine learning model that predicts when to be long SPY vs. flat based on VIX and market dynamics.
Initial metrics (≈9.7 years):
ROI: 31.96x
CAGR: 43.3%
Sharpe: 2.92
Max Drawdown: 10.9%
Initial Takeaways
Looking at these numbers, the SPY/VIX toggle seemed almost too good to be true: a Sharpe of 2.92 with only 11% drawdown? That’s institutional-grade performance. The Dual Allocator delivered solid returns with reasonable risk, while the VIX strategy showed explosive growth (though over a suspiciously short period).
There is absolutely some bias or overfitting going on.
The Overfitting Question
Before committing capital, I asked myself: Are these numbers real or artifacts of data mining?
My initial plan was sensible:
Primary sleeve: Use the SPY/VIX Synthetic Toggle with walk-forward validation
Satellite sleeve: Deploy Dual Allocator V3 with tighter risk controls
Exploratory: Keep VIX term structure on the bench until more data validated it
But I needed to do one more thing first: stress-test each strategy for the most common backtesting errors.
The Autopsy Begins
Question 1: Is the SPY/VIX Toggle Too Good to Be True?
The First Red Flag
I ran a sanity check by flipping the trading logic. The strategy was coded as “go long when prob_long < 0.5”—which seemed backwards. When I tested the natural rule (long when prob_long > 0.5), the results were catastrophic:
ROI: 0.11x (lost 89% of capital)
CAGR: -20.6%
Sharpe: -1.76
Max Drawdown: -91%
The Problem: The model’s probability labels were inverted relative to the trading rule. The “32x ROI” wasn’t skill—it was accidentally trading against a broken model and getting lucky.
The Fix
I rebuilt the strategy from scratch:
Replaced XGBoost with a simple logistic regression
Aligned the exposure rule: long when prob_long > threshold
Added proper train/test split with grid search on training data only
Best threshold found: 0.3
The Truth (after fix):
Full period: 2.80x equity, 11.2% CAGR, 0.69 Sharpe, -34.1% drawdown
Test period: 1.79x equity, 22.7% CAGR, 1.39 Sharpe, -19.0% drawdown
Buy-and-hold SPY: 3.55x equity, 13.9% CAGR, 0.81 Sharpe, -34.1% drawdown
The model achieved ~97-100% exposure (essentially always long) and barely beat buy-and-hold on the training set while underperforming on the full period. The 32x ROI was pure fantasy.
Verdict: ❌ Strategy eliminated
Question 2: What About the Other Two?
I documented my concerns:
Dual Allocator V3:
Positions applied to same-day returns (lookahead bias)
Missing borrow/financing costs for leveraged ETFs
VIX Term Structure:
No borrow costs despite 5x leverage on short positions
Only 5.3 years of data (small sample)
Sample dominated by 2020-2022 volatility regime
Both needed immediate fixes.
The Dual Allocator Collapse
The Lookahead Problem
The original backtest calculated signals using end-of-day data and then applied those positions to that same day’s returns. This is a classic lookahead bias: you’re implicitly assuming you knew the day’s price movement before it happened.
The Fix: Shift execution by one day. Signals computed at close of day T apply to returns from day T+1.
The Results:
V3 (Volatility-Enhanced) Strategy:
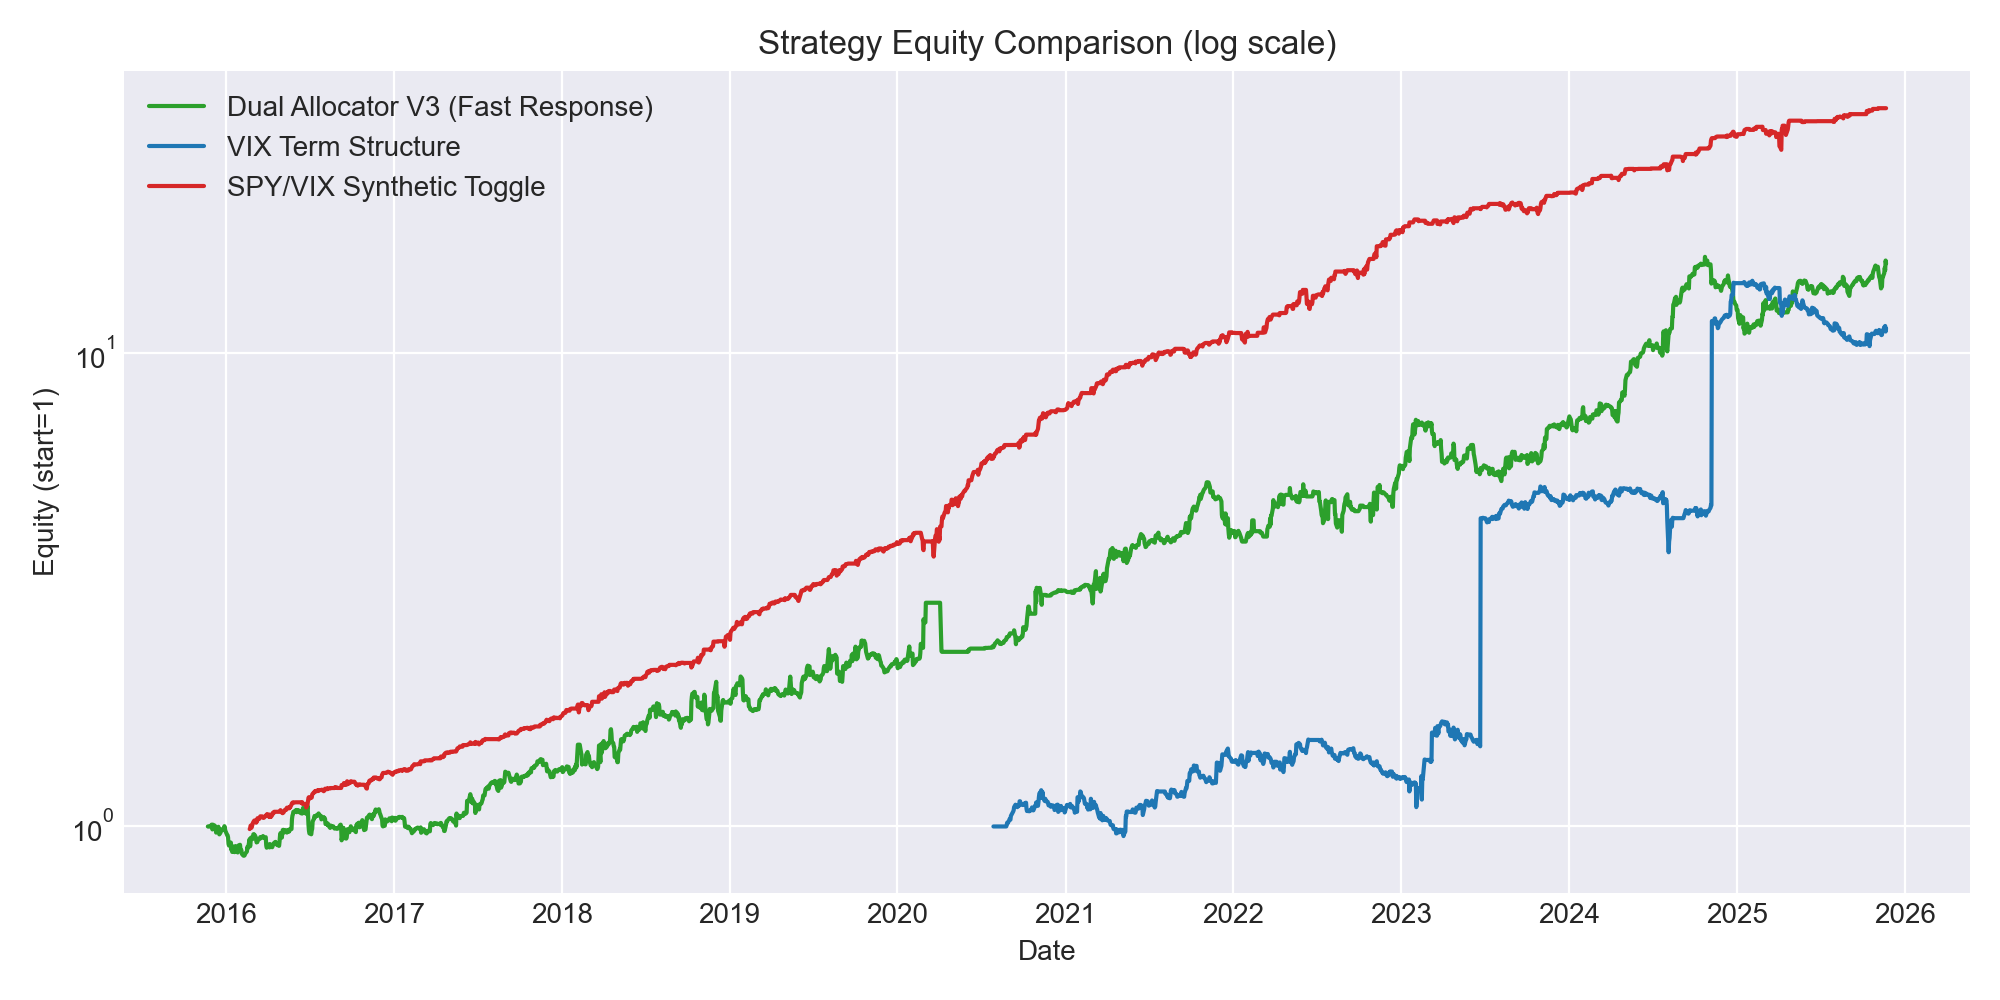
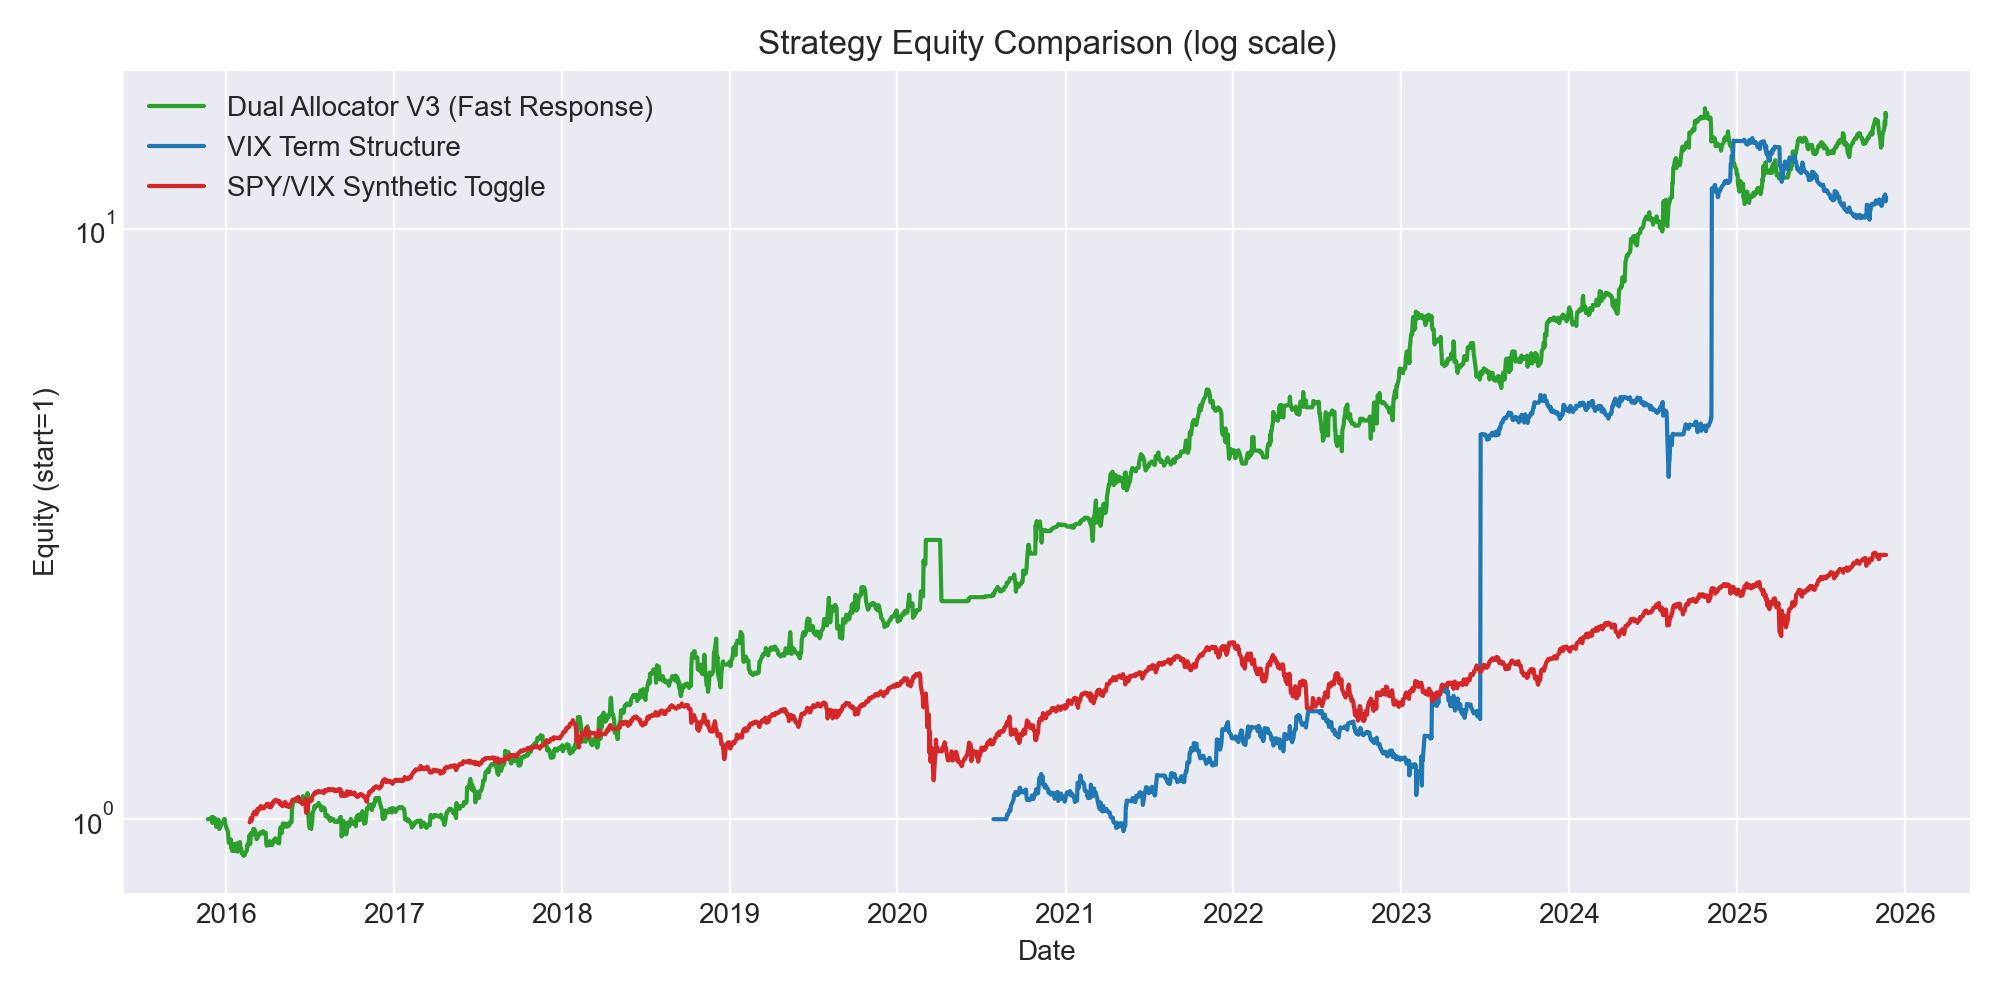
Before fix: 1,447% return, 33.8% CAGR, 1.078 Sharpe ✨ FAKE
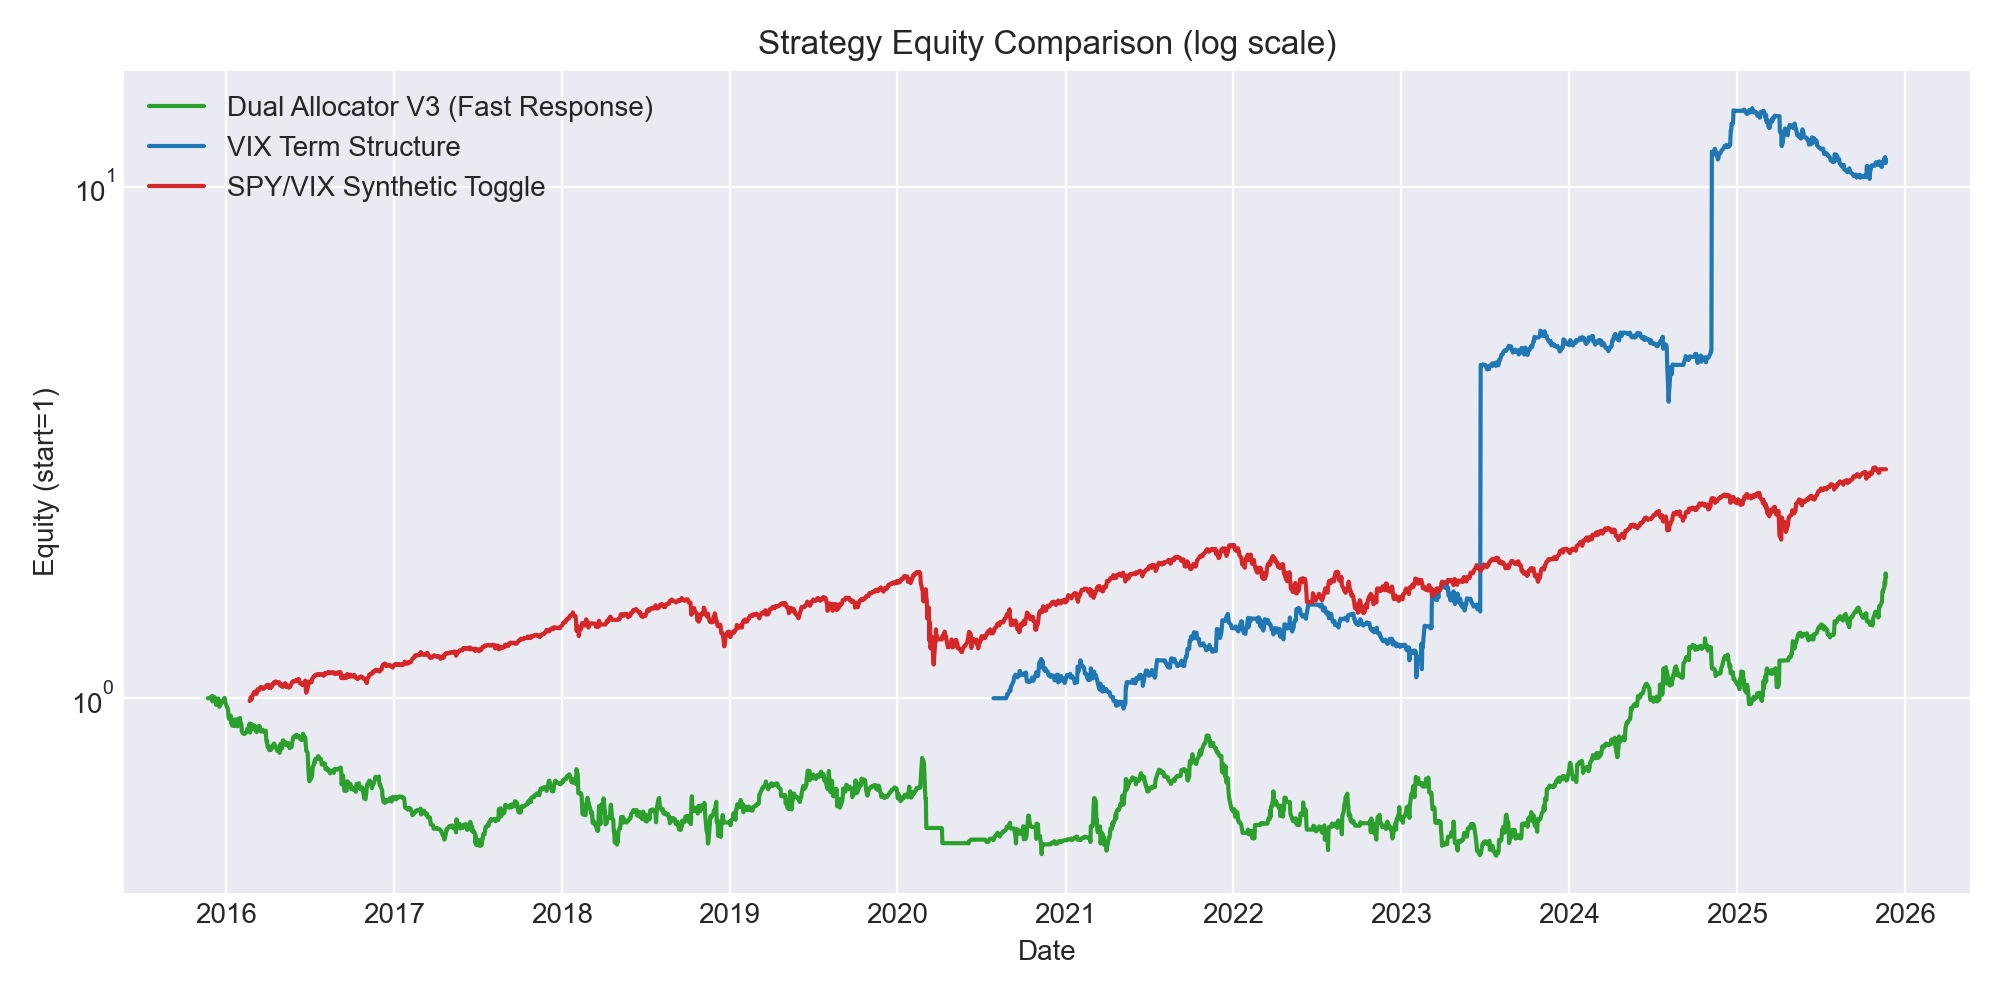
After fix: 251% return, 13.4% CAGR, 0.514 Sharpe 📉 REAL
Impact: 82% performance decrease
Verdict: Still profitable but underperforms buy-and-hold
V5 (ML-Optimized) Strategy:
Before fix: 6,387,419% return, 202% CAGR, 3.97 Sharpe 🚀 FANTASY
After fix: -27.97% return, -3.2% CAGR, 0.043 Sharpe 💀 DISASTER
Impact: Complete collapse—the strategy loses money
Verdict: Total failure
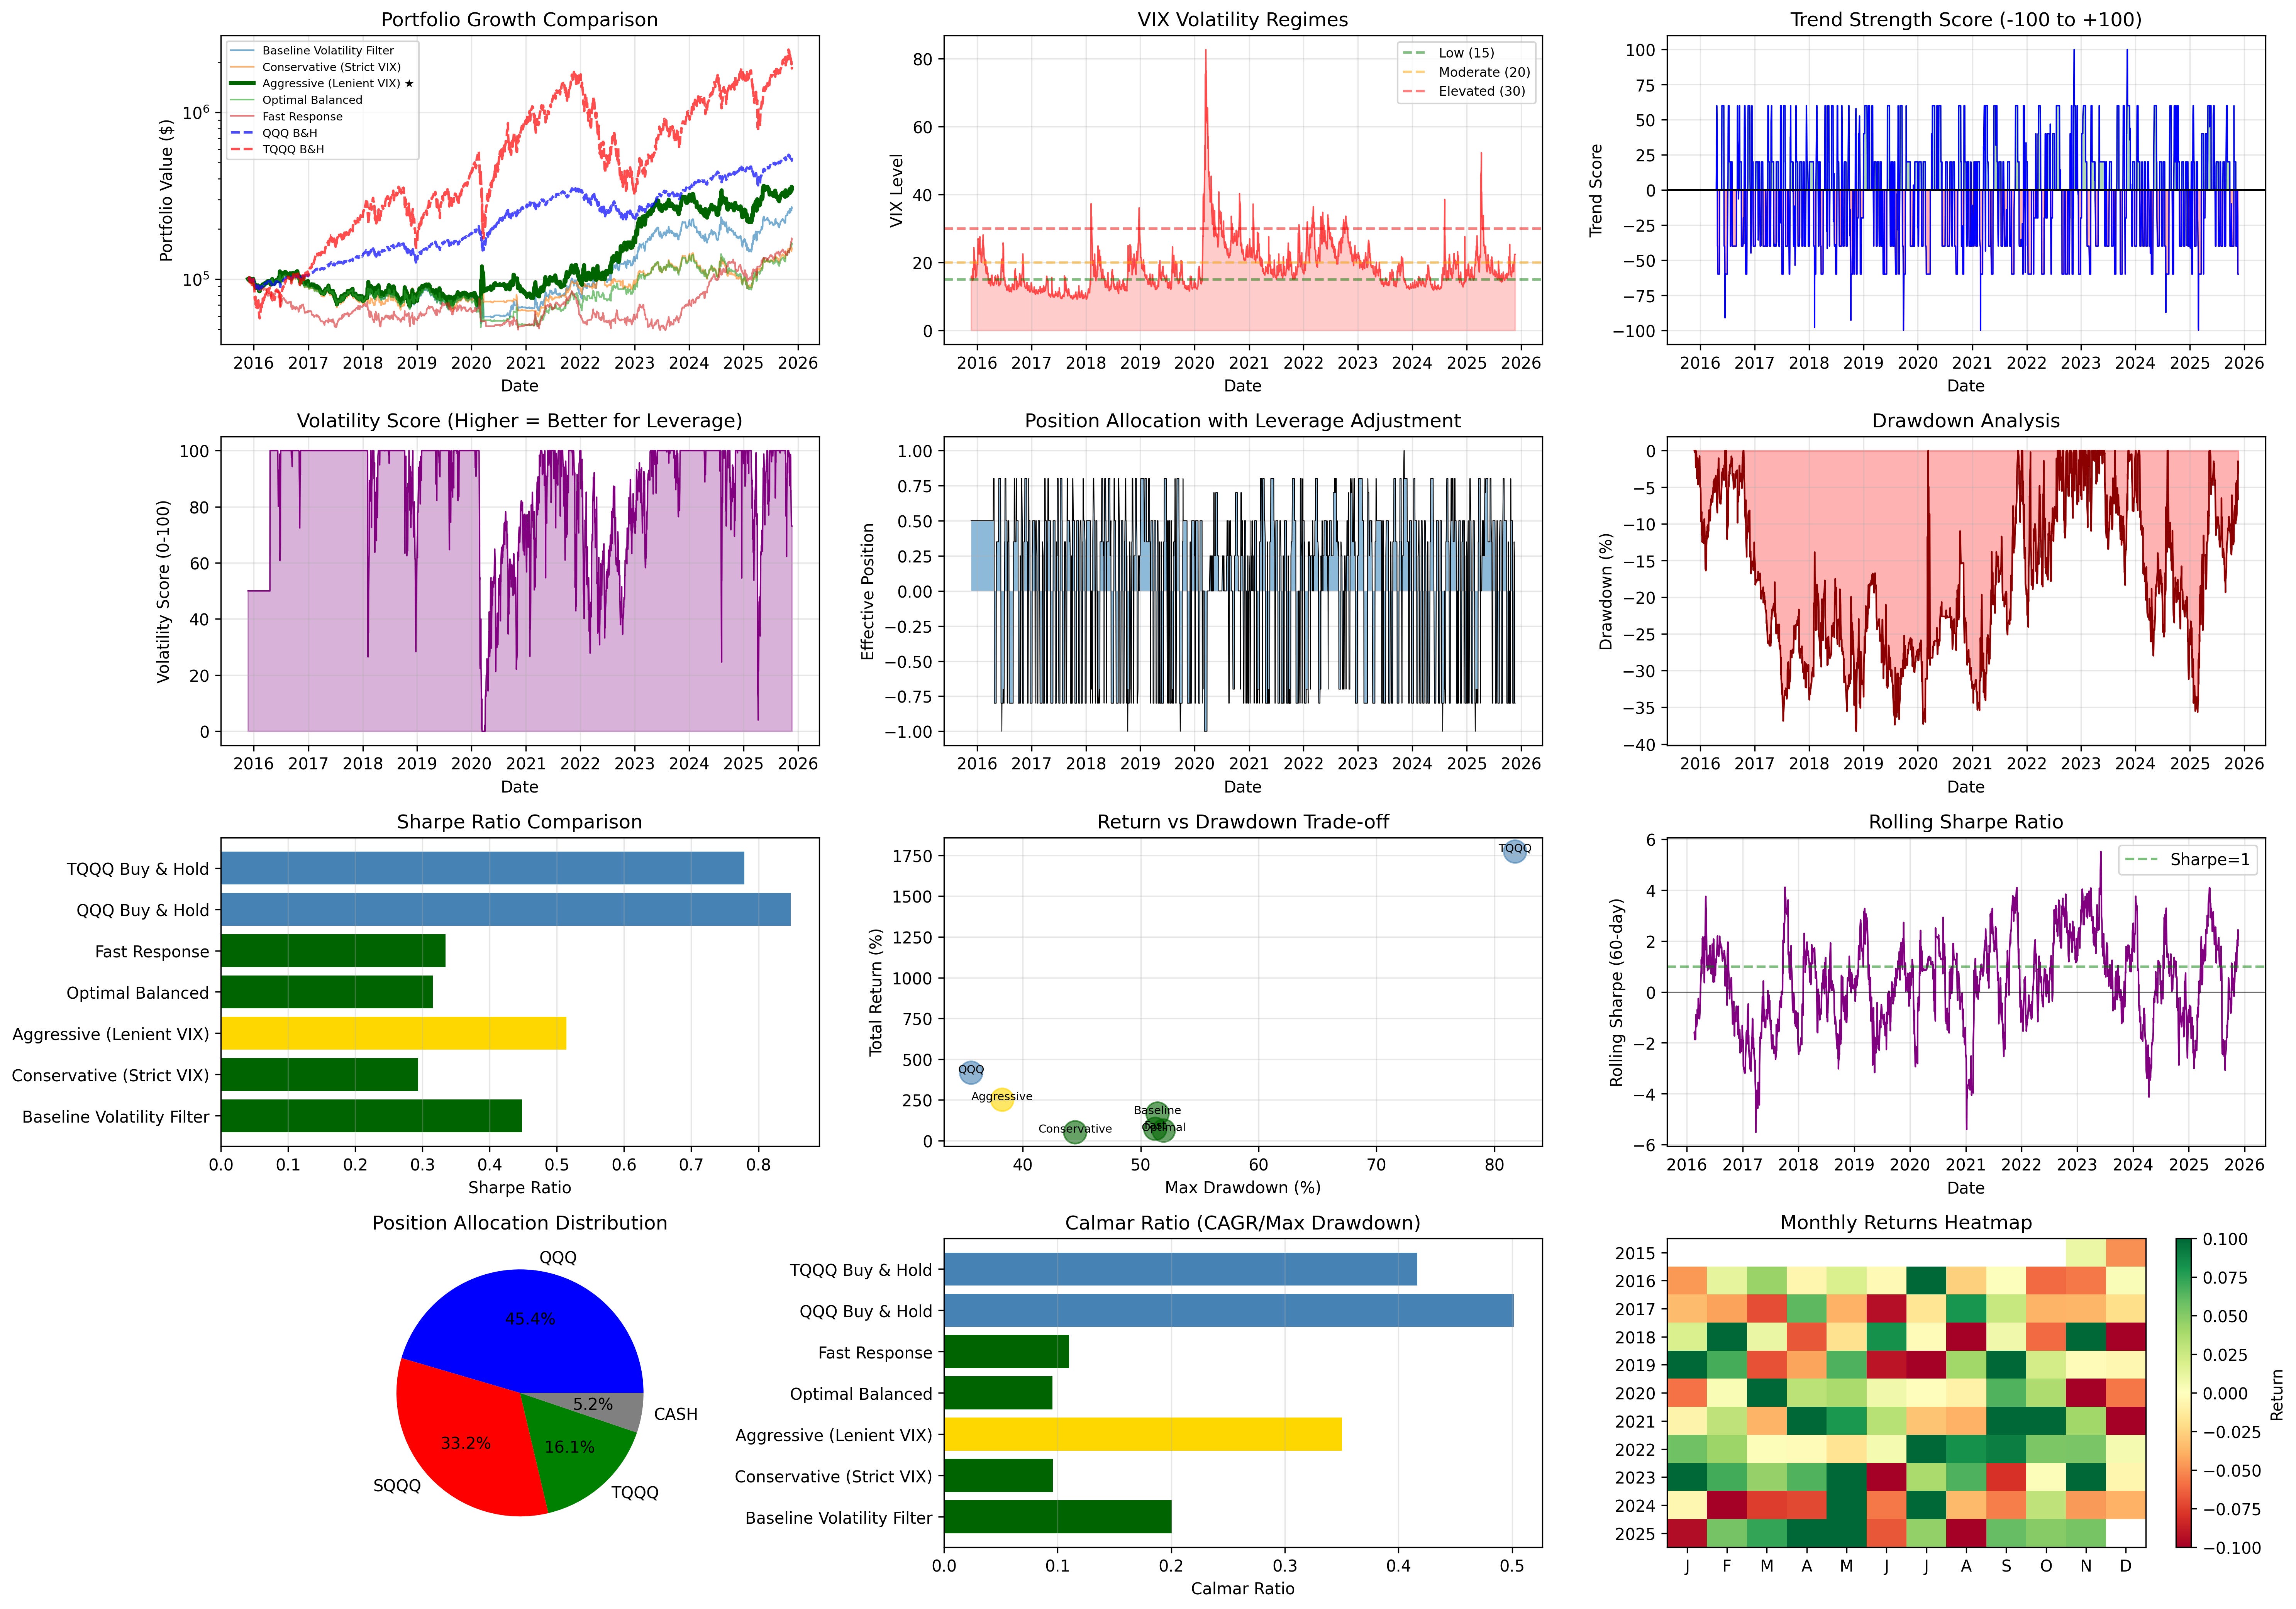
Benchmarks (unchanged):
QQQ Buy & Hold: 417% return, 17.9% CAGR, 0.848 Sharpe
TQQQ Buy & Hold: 1,773% return, 34.1% CAGR, 0.779 Sharpe
The V5 Disaster: The ML optimization didn’t learn market patterns—it learned to exploit the lookahead bias. When I removed the bias, the emperor had no clothes. The SHAP analysis was picking up on future returns because they were leaking into the features.
Verdict: ❌ Both strategies eliminated
I am still hopeful that with TLT hedging, I might be able to resurrect this strategy but for now, it has been eliminated.
Question 3: The Last Strategy Standing
Only the VIX Term Structure strategy remained. But was it clean?
Potential Overstatement Factors:
Missing borrow costs: The backtest uses 5x leverage with no borrow fees. Real-world costs would be:
Borrow fees for short VIXM positions
Margin financing costs
These could reduce returns by 200-500 bps annually
High leverage assumption: 5× notional with 50% position sizing assumes perfect margin availability—unlikely in stressed markets when you’d want the strategy most
Short sample bias: 5.3 years starting in 2020 captures the COVID volatility spike and subsequent regime. The 57.7% CAGR is inflated by this unusual period
Sharpe of only 0.70: Despite the high CAGR, the Sharpe ratio suggests significant volatility—consistent with a carry trade that occasionally blows up
What’s Right:
Positions are already shifted by one day (no lookahead)
Trading costs included (5 bps + 15 bps slippage + 2 bps liquidity)
The strategy logic is sound: contango means VIX futures roll down over time
Estimated Reality Check:
If I add realistic borrow costs and extend the backtest to include 2004-2020 (when reconstructing the VIX curve), I’d expect:
CAGR to drop to 25-35% range
Sharpe to remain around 0.5-0.7
Max drawdown to potentially increase (2008, 2011 were rough for short vol)
Verdict: ⚠️ Strategy survives but needs conservative assumptions
The Key Lessons
1. Lookahead Bias is Everywhere
The most common mistake in backtesting is using information you wouldn’t have had at trade time. My two biggest culprits:
Same-day execution: Applying signals to same-day returns
Inverted logic: Building a model on one relationship and trading the opposite
2. Spectacular Returns Deserve Spectacular Scrutiny
A Sharpe ratio above 2.0 in long/flat equity strategies? Almost certainly wrong.
CAGR of 202%? You’ve found a bug, not alpha.
6+ million percent returns? Your code is broken.
If your backtest shows better risk-adjusted returns than Renaissance or Citadel, you probably have lookahead bias, not a billion-dollar strategy.
3. ML Can Learn Your Mistakes
The V5 strategy’s complete collapse was the most educational failure. The machine learning model achieved its amazing results by learning to exploit the lookahead bias, not by discovering real market patterns. When I removed the bias, the model had nothing left.
Lesson: ML models are incredibly good at finding patterns—including patterns in your bugs.
4. Simple Often Beats Complex
After all this analysis:
QQQ buy-and-hold: 17.9% CAGR, 0.848 Sharpe
My best “strategy”: 13.4% CAGR, 0.514 Sharpe (V3 after fixes)
The simple approach won. And that’s before considering:
Implementation complexity
Transaction costs
Slippage in real execution
Psychological difficulty of trading actively
5. Short Samples Lie
The VIX Term Structure strategy’s 57% CAGR came from a 5.3-year sample heavily weighted toward an unusual volatility regime. That’s not a robust estimate—it’s a regime-dependent outcome that will likely disappoint going forward.
Final Thoughts
This is why you backtest and always critically evaluate your strategies.
One that accidentally inverted its logic
Two that exploited lookahead bias
One that might work but needs conservative assumptions
If you’re backtesting your own strategies, I hope this post helps you find your bugs before the market does.
Leveraged ETFs carry significant risks and may not be suitable for all investors. The information presented in Math & Markets is not investment or financial advice and should not be construed as such.
The logic reversal test is a great sanity check which I haven't thought to use in my own work - definitely food for thoughts. If flipping the signal produces catastrophic losses instead of roughly inverse gains, something is wrong with the data handling, not just the strategy.