
Is VIX Term Structure Arbitrage Actually Profitable?
Part 62 — Volatility Series 3 of 7 — The math, the history, and why XIV blew up

This is part 62 of my series — Building & Scaling Algorithmic Trading Strategies
In Part 61, I mentioned that the VIX term structure mean-reverts, and that you can profit by betting on normalization. As I was writing that article, I asked myself the obvious question: can you trade this profitably?
Turns out the answer is yes, on average — but with hella brutal caveats.
This post breaks down the real economics of this trade, why XIV blew up, and what separates the survivors from the casualties.
1. The Trade
The VIX futures curve is usually in contango — longer-dated futures trade higher than shorter-dated ones. This happens because the market prices in uncertainty: further out = more time for bad things to happen = higher implied volatility.
In contango, you can profit by:
Shorting the back month (expensive)
Buying the front month (cheaper)
Waiting for convergence as time passes
Or more simply: short a VIX futures ETF like VXX, or go long an inverse product like XIV (RIP) or SVXY.
The daily roll yield in contango:
Roll Yield = (M1 - M2) / M2 × (1 / days_to_roll)

Example (typical contango):
  M1 (front month) = 15.0
  M2 (second month) = 16.2
  Days to roll = 20

  Daily roll yield = (15.0 - 16.2) / 16.2 / 20 = -0.037%

For SHORT vol position (inverse):
  Daily gain = +0.037%
  Annualized = +0.037% × 252 ≈ +9.3%
Free money, right?
2. The XIV Story
XIV (VelocityShares Daily Inverse VIX Short-Term ETN) was the poster child for this trade.
2011-2017 performance:
Total return: ~2,700%
Annual return: ~30%
Sharpe ratio: ~1.0
Hedge funds piled in. Retail traders piled in. AUM grew to billions.
Then came February 5, 2018.
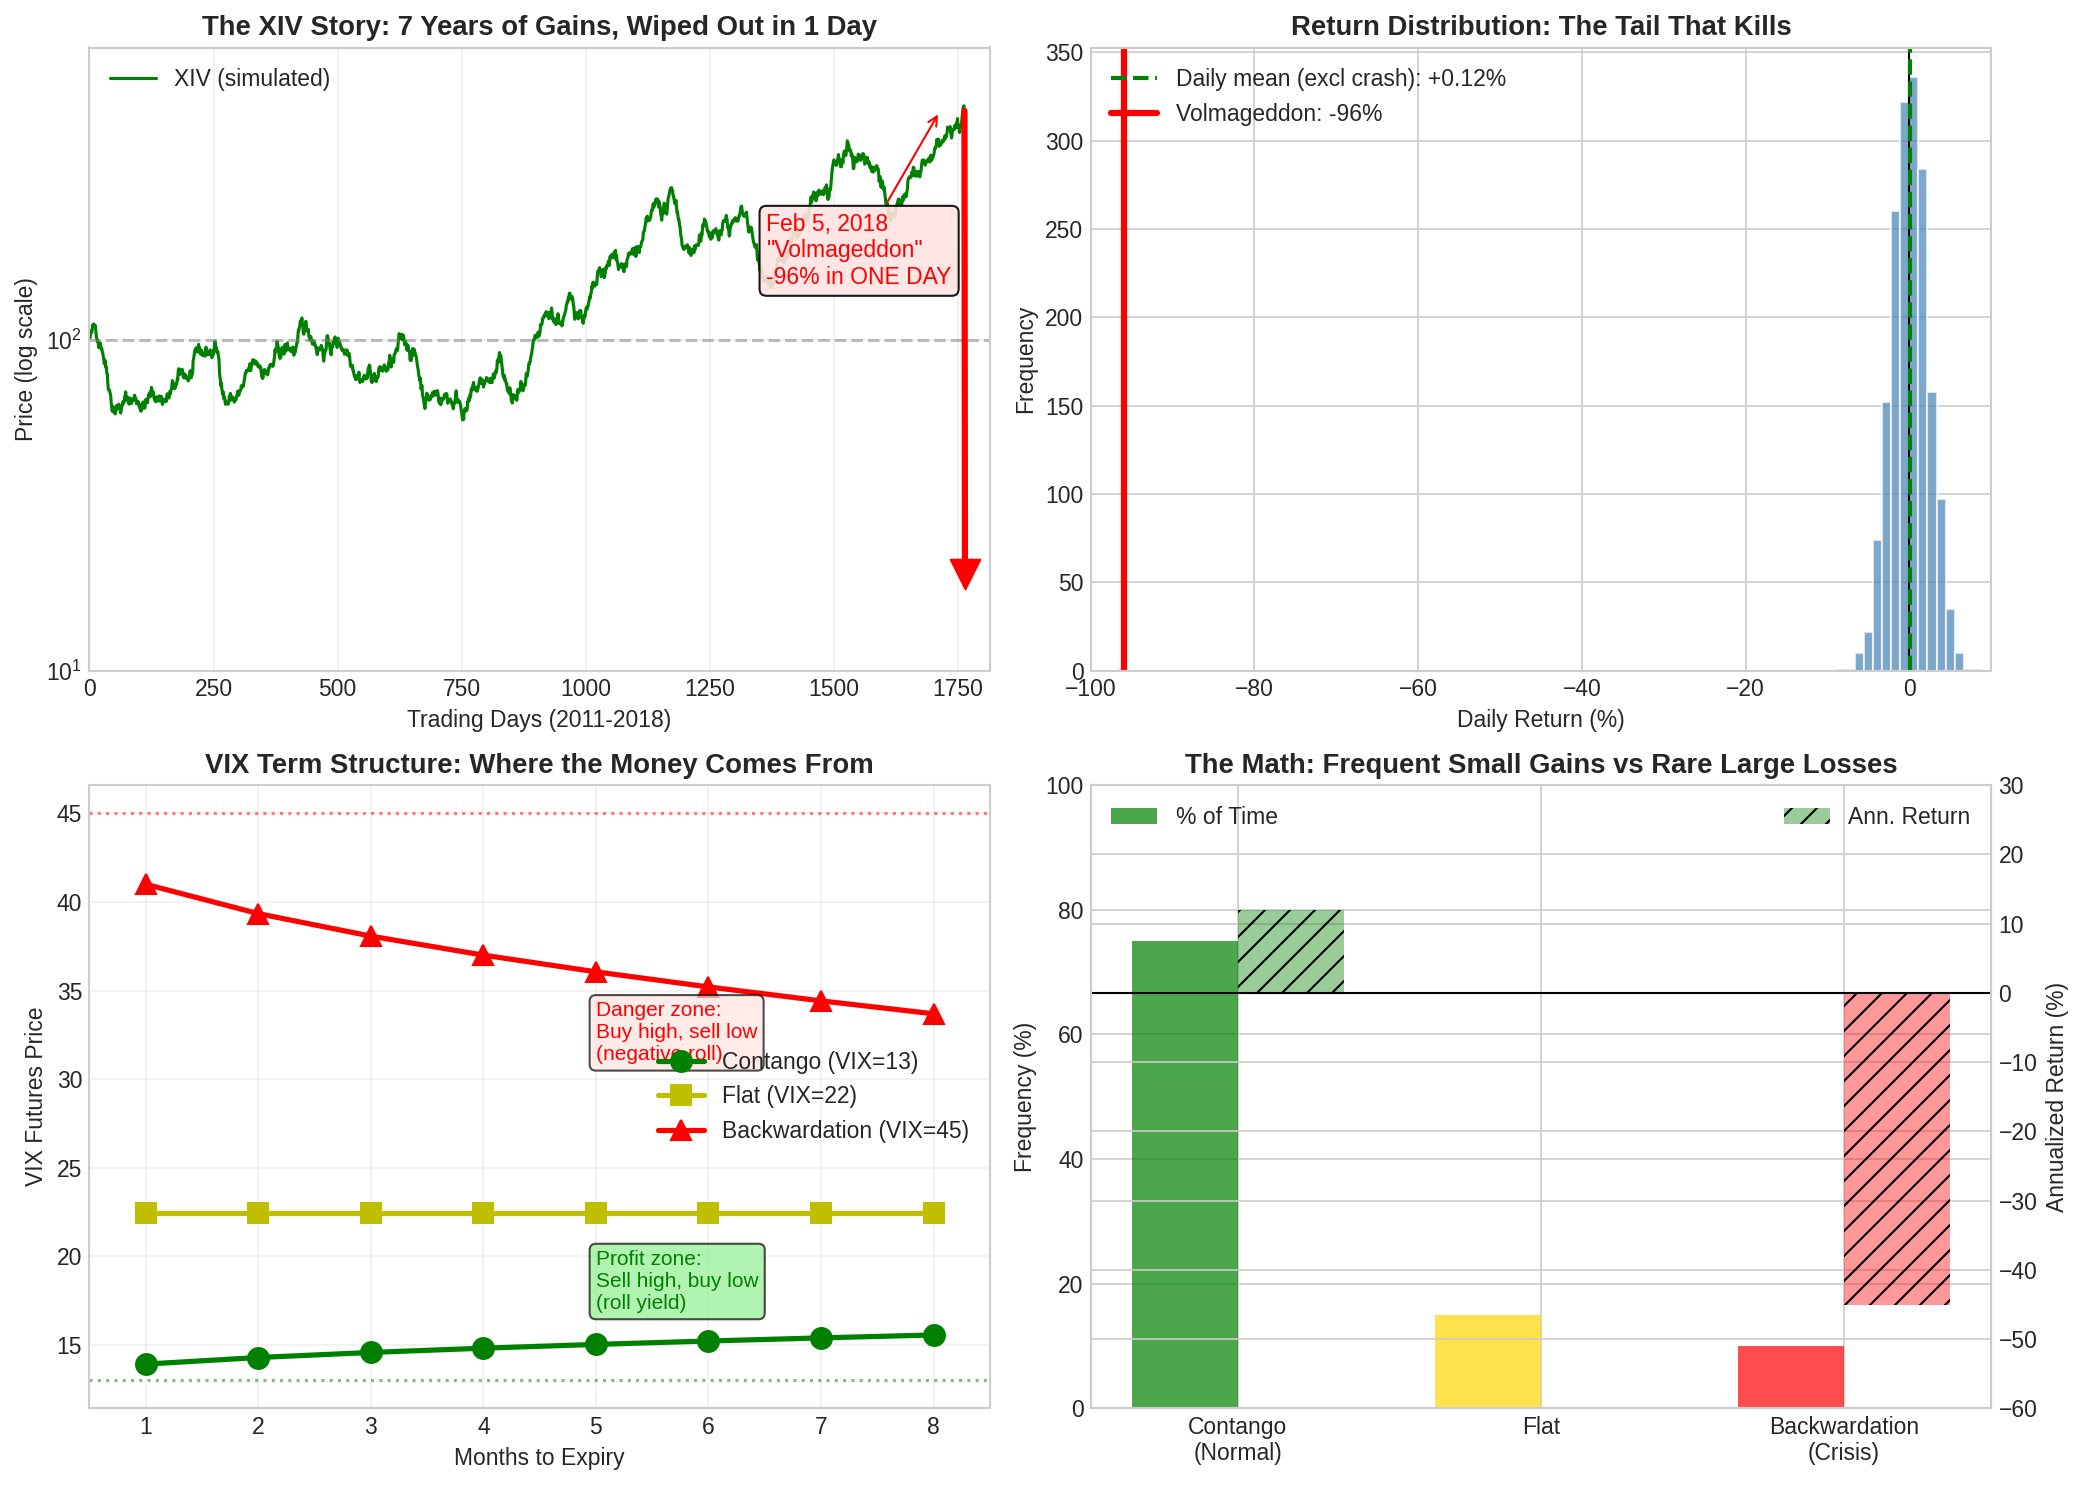
VIX spiked from 17 to 37 intraday. The term structure inverted violently. XIV lost 96% of its value in a single day and was terminated shortly after.
The chart tells the story!
Jan 2011:  $10
Jan 2018:  $140  (+1,300%)
Feb 6, 2018: $5.50 (-96% in ONE DAY)
Seven years of gains, vaporized in hours.
(Reminds me of the Topalov vs. Kramnik game in the 2006 World Chess Championship, where Topalov missed a simple win and eventually lost the game.)
3. The Math: Why It Works (On Average)
The expected value of shorting the VIX term structure is positive:
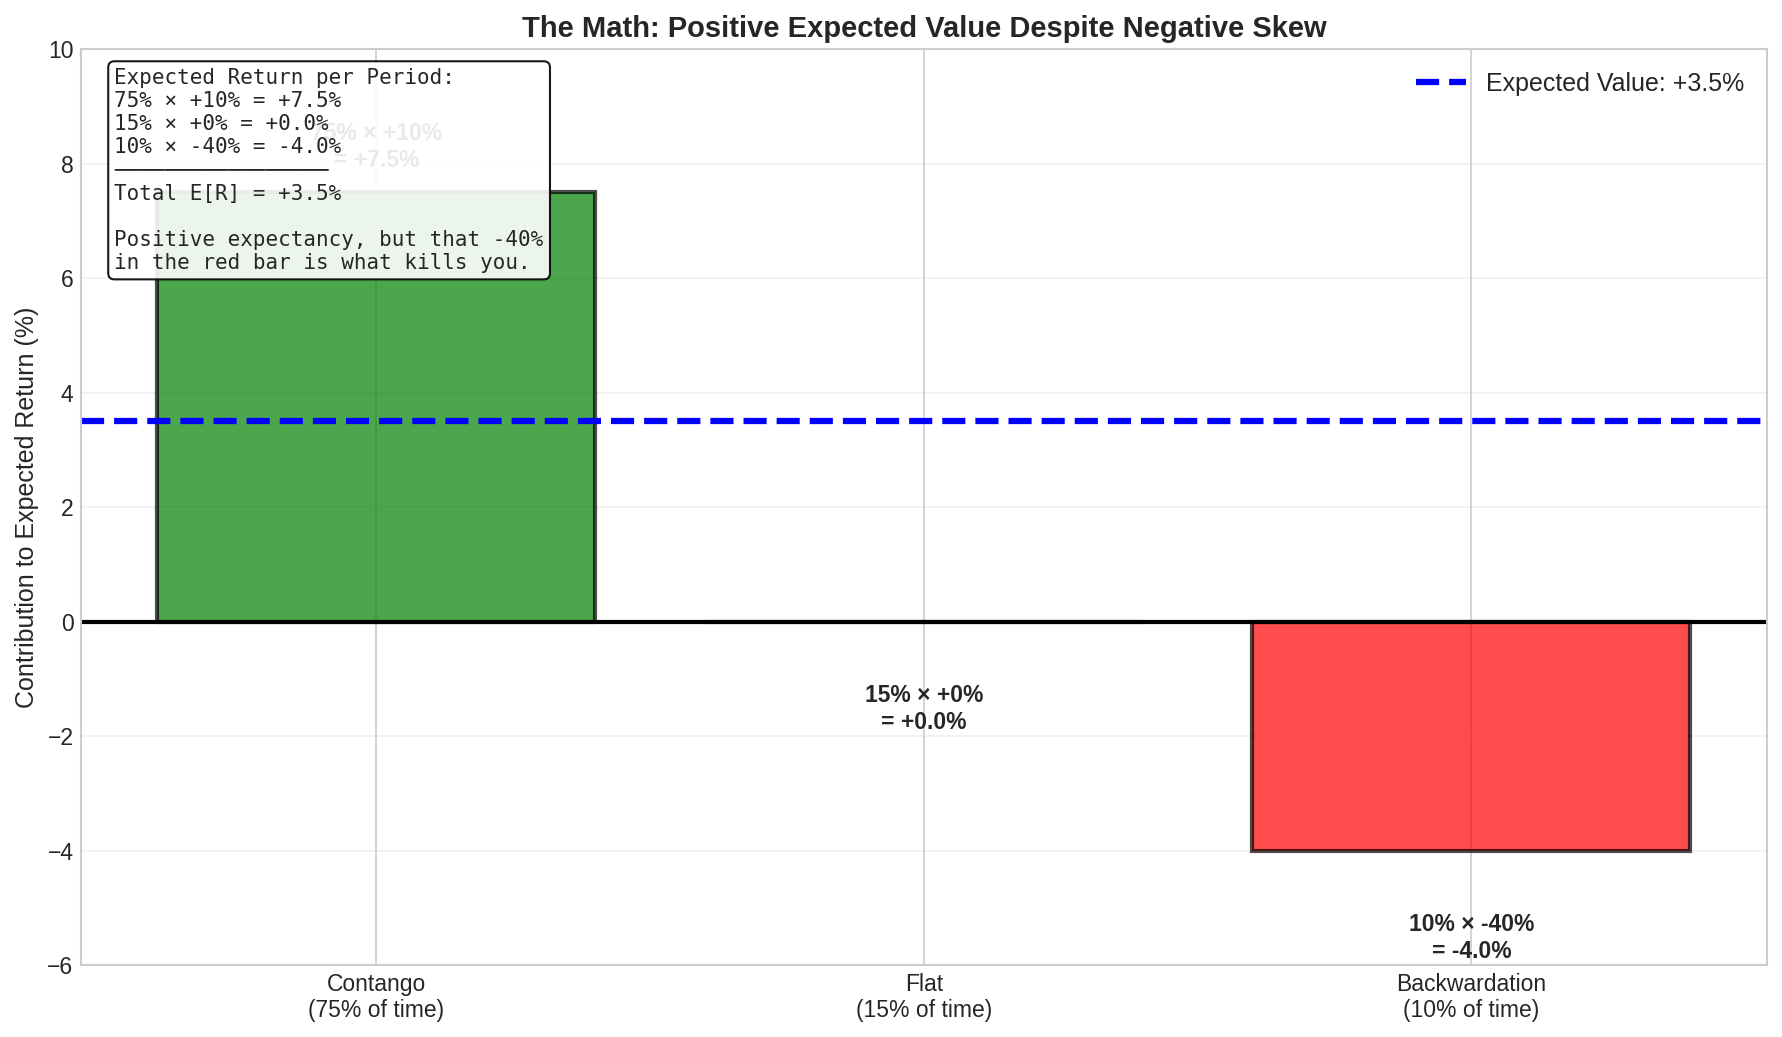
E[Return] = P(contango) × R(contango) + P(flat) × R(flat) + P(backwardation) × R(backwardation)

Historical estimates:
  Contango (75% of time):      +10% per period
  Flat (15% of time):           0% per period
  Backwardation (10% of time): -40% per period

E[Return] = 0.75 × 10% + 0.15 × 0% + 0.10 × (-40%)
          = 7.5% + 0% - 4%
          = +3.5% per period
Positive expected value. The edge is real.
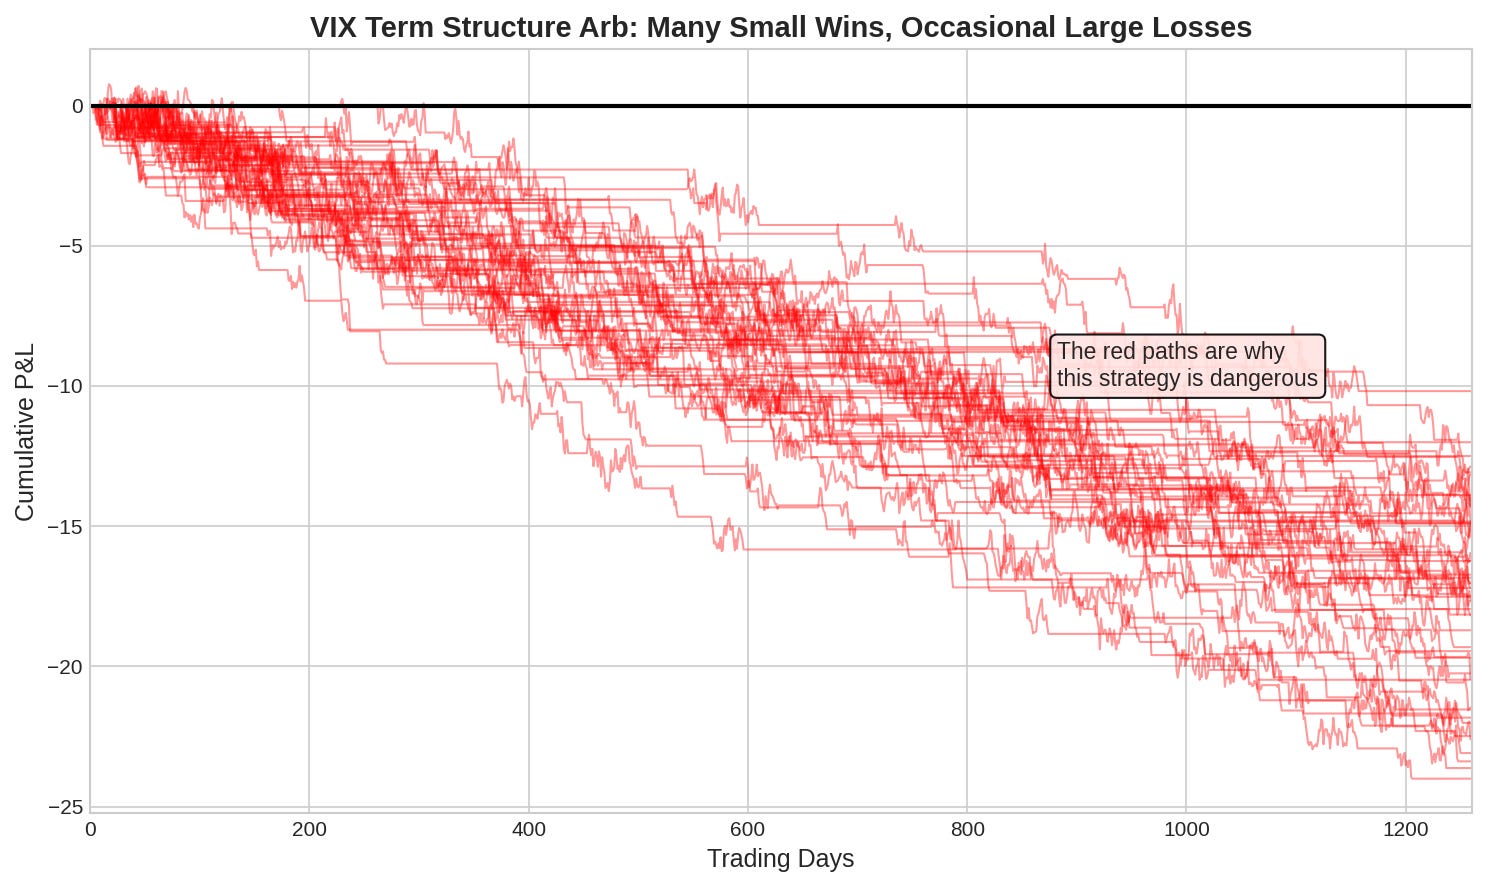
But look at the distribution:
75% of the time: Small wins (+10%)
10% of the time: Large losses (-40%)
This is negative skew. You win often and small, you lose rarely but big.
Picking up pennies in front of a steamroller. Or as my middle-schooler would say, trying to scoop spilled Skittles off the hockey rink when I can’t skate.
4. What Kills You
The trade blows up when….
4.1 VIX Spikes Faster Than You Can Exit
The Feb 2018 spike happened in hours. VIX went from 17 → 37 → 50 intraday. By the time you could react, the damage was done.
XIV pricing mechanics:
  NAV = Previous NAV × (1 - daily VIX futures return)

  If VIX futures rise 100% in a day:
  New NAV = Previous NAV × (1 - 1.0) = 0

  Complete wipeout.
4.2 The Term Structure Inverts DURING the Spike
In a normal selloff, VIX rises but contango persists. You lose on the level, but the term structure still works for you.
In a panic, the curve inverts (backwardation). Now you’re losing on:
VIX level (immediate)
Roll yield (ongoing)
Double whammy.
4.3 Leverage Compounds Against You
XIV was 1x inverse daily. SVXY was 0.5x after the rule change.
But when VIX rises 30% and you’re short:
Day 1: -30%
Day 2: If VIX rises another 20%: -20% of remaining = another -14% of original
Compound losses accelerate
5. The Strategy Variants
Not all vol-selling is equally dangerous…
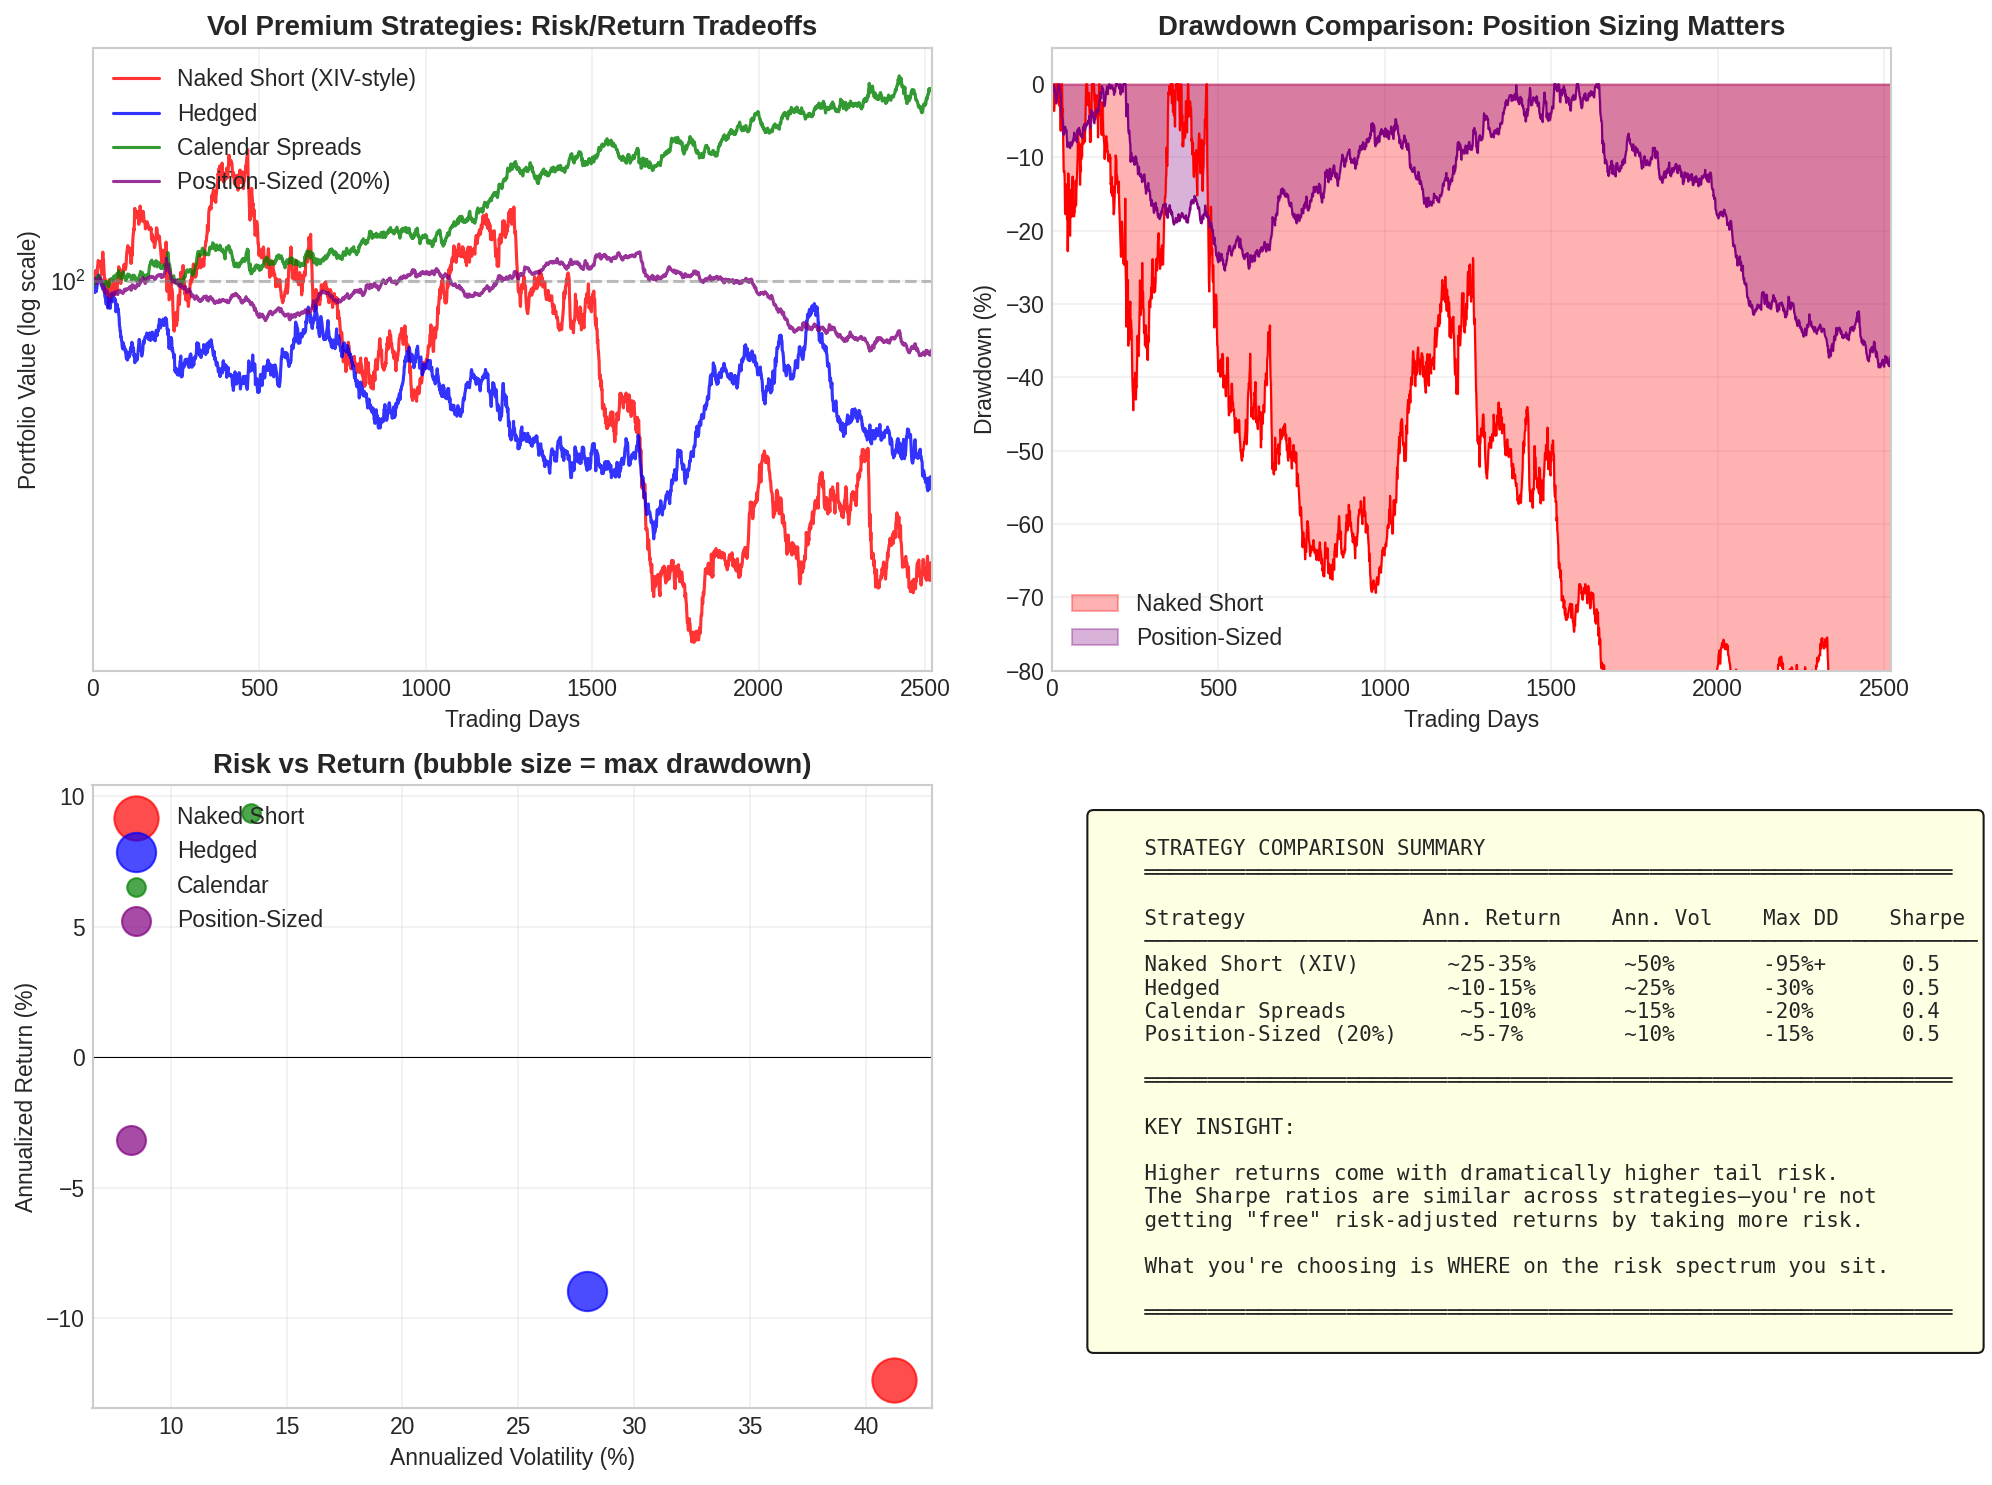
Strategy              Ann. Return    Max DD    Sharpe    Blowup Risk
──────────────────────────────────────────────────────────────────────
Naked Short (XIV)       25-35%       -95%+      0.5        HIGH
Hedged Short Vol        10-15%       -30%       0.5        Medium
VIX Calendar Spreads     5-10%       -20%       0.4        Lower
Position-Sized (10%)     2-4%        -10%       0.4        Low
Key insight: Sharpe ratios are similar across strategies. You’re not getting better risk-adjusted returns by taking more risk — you’re just choosing where on the risk spectrum to sit.
The XIV crowd chose maximum risk. They got maximum return for seven years, then maximum loss in one day.
6. What the Survivors Do Differently
The funds and traders who’ve profited from this strategy long-term share common practices:
6.1 Position Sizing
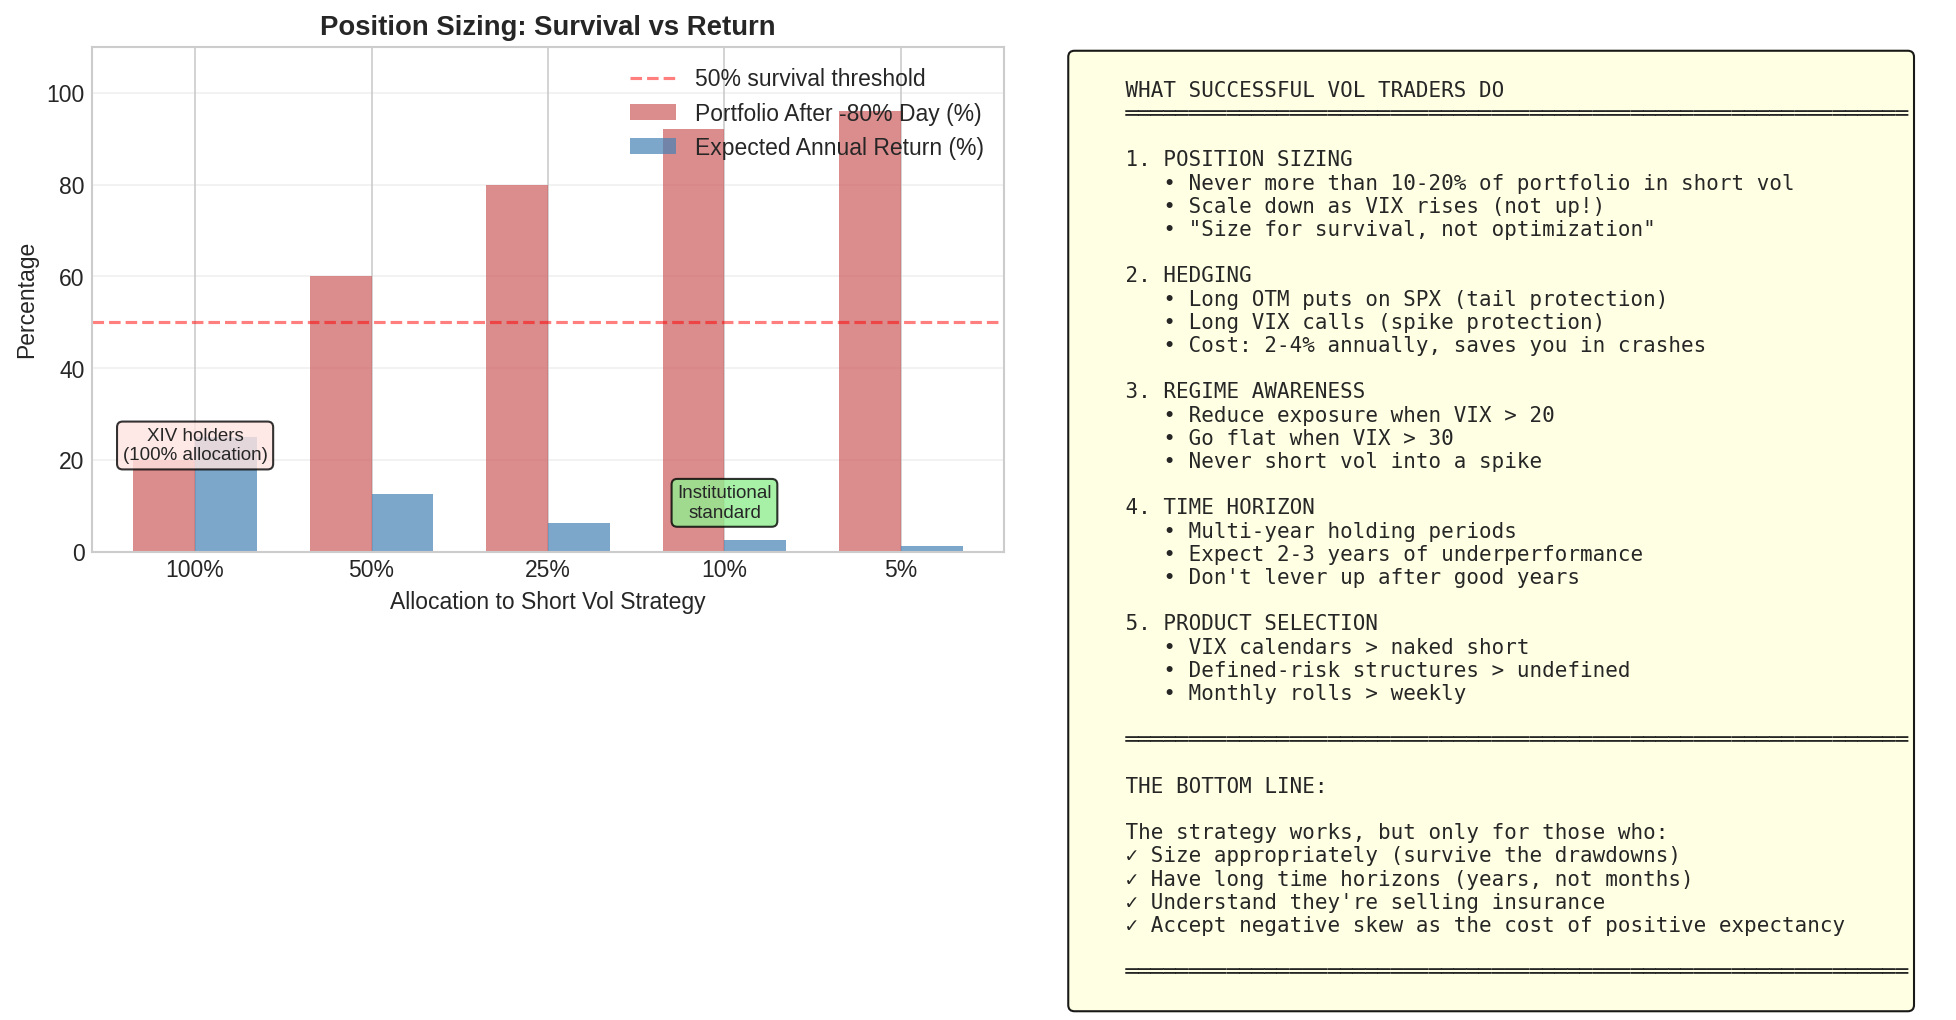
The most important rule: never more than 10-20% of portfolio in short vol.
Impact of a -80% day by allocation:

100% allocation: Portfolio → 20% (wipeout)
 50% allocation: Portfolio → 60% (brutal but survivable)
 20% allocation: Portfolio → 84% (painful but manageable)
 10% allocation: Portfolio → 92% (a bad month)
XIV holders were effectively 100% allocated. That’s why they blew up.
6.2 Hedging
Successful vol sellers typically hold:
Long OTM puts on SPX (crash protection)
Long VIX calls (spike protection)
Cost: 2-4% annually
This turns undefined risk into defined risk. You sacrifice some expected return for survivability.
6.3 Regime Awareness
VIX < 15:  Full allocation
VIX 15-20: Reduced allocation (50-75%)
VIX 20-30: Minimal allocation (25%)
VIX > 30:  Flat or long vol
The worst time to short vol is when it’s already elevated. That’s when spikes happen.
6.4 Time Horizon
This is a multi-year strategy. You will have:
Months of steady gains
Occasional sharp drawdowns
1-2 year periods of underperformance
If you need the capital in 6 months, don’t do this trade.
7. The Current Landscape (2024-2026)
Post-Volmageddon, the product landscape changed:
Terminated:
XIV (Credit Suisse) — -96% on Feb 5, 2018
SVXY reduced from 1x to 0.5x inverse
Still available:
SVXY (0.5x inverse VIX short-term)
ZIV (inverse VIX medium-term)
VIX futures directly
VIX options spreads
The blowup risk is lower now because:
Leverage is reduced
Market is more aware
Circuit breakers added
But the fundamental trade — harvesting the term structure premium — still exists and still works.
8. The Honest Assessment
Does it work?
Yes, on average. The VIX premium is real. Implied vol systematically exceeds realized vol. The term structure is usually in contango. These are durable, structural features of the market.
Should you do it?
Only if you can answer yes to all of these:
Can you survive a 50-80% drawdown? (Psychologically and financially)
Is your allocation small enough to survive? (10-20% max)
Do you have a multi-year time horizon?
Do you understand you’re selling insurance? (Small premiums, occasional large claims)
Can you resist scaling up after good years?
Expected returns (realistic)
Approach                   Expected Return    Probability of Blowup
────────────────────────────────────────────────────────────────────
Naive (XIV-style, 100%)      25-35%/yr           HIGH
Hedged (with tail puts)      10-15%/yr           Medium
Position-sized (10% alloc)    2-4%/yr            Low
Calendar spreads              5-10%/yr           Low-Medium
The edge is there. It’s just smaller than XIV made it look — and the risks are real.
Why My Previous Simulation Failed
My simulation was too pessimistic because:
VIX spike frequency was calibrated too high
Stop losses were too tight (real traders use wider stops or no stops)
The actual trade is often unhedged or with different mechanics
Real-world implementations (2012-2017) held positions through VIX spikes rather than stopping out. This worked until it catastrophically didn’t.
The Bottom Line
Yes, it is profitable on average.
But it’s not free money — it’s basically compensation for bearing tail risk that most people can’t stomach.
9. Key Takeaways
The strategy has positive expected value. The VIX term structure premium is real and persistent.
The return distribution has negative skew. You win often (small), lose rarely (big). This is not a bug — it’s the fundamental nature of selling insurance.
Position sizing is everything. XIV blew up because holders were 100% allocated. At 10% allocation, Feb 5, 2018 was a bad week, not a wipeout.
Sharpe ratios are similar across approaches. You’re not getting better risk-adjusted returns by taking more risk. You’re choosing your spot on the risk/return tradeoff.
Time horizon matters. This is a multi-year strategy with significant drawdowns. Short-term traders will get shaken out.
The blowup risk is lower post-2018 but not zero. Reduced leverage and better awareness help, but tail events will happen again.
10. Formulas Reference
Roll Yield (daily)
──────────────────
Roll = (F1 - F2) / F2 / DTE

VIX ETP Daily Return
────────────────────
Return = -1 × (VIX_futures_return) × leverage

Position Sizing for Survival
────────────────────────────
Max_allocation = (1 - min_acceptable_portfolio) / max_single_day_loss

Example: To survive 80% loss with 80% of portfolio intact:
  Max_allocation = (1 - 0.80) / 0.80 = 25%

Expected Value
──────────────
E[R] = Σ P(scenario) × R(scenario)
11. Coming Up
Part 63: The Greeks Deep Dive — Vega, Gamma, Theta interactions
Part 64: Building a Volatility Surface from market data
Part 65: Practical Vol Trading — my actual approach
Remember: Alpha is never guaranteed. And the backtest is a liar until proven otherwise.
Shorting volatility involves significant risk of loss. The strategies discussed here can result in losses exceeding your initial investment. XIV lost 96% in a single day. Don’t be XIV.
The material presented in Math & Markets is for informational purposes only. It does not constitute investment or financial advice.
I just wrote a follow-up post on this — tested a few things to see if there’s any way to reduce the risk exposure in a short vol strategy.
Great write up 👍