
Equity Curve Results: Allocator vs. Volatility Strategy (Updated With Combined Blend Metrics)
Part 6 below focuses on expanding beyond my long/short strategy
This is part 6 of my series — Building & Scaling Algorithmic Trading Strategies
This phase is about exploring other strategies to complement my original dual allocator strategy.
Before I started blending strategies, I tested several potential “sleeves” to pair with the long–short allocator: term-structure carry, leveraged ETF decay arb, rates/credit RV, commodity trend/carry, and macro-event straddles. Each had merit, but the one that consistently stood out — in both preliminary backtests and stress-regime scenarios — was the volatility sleeve.
Not because it’s stable (it isn’t).
Not because it compounds well on its own (it doesn’t, unless conditions are perfect).
But because it brings something the allocator doesn’t: convexity.
It responds explosively when markets break structure, and it tends to peak when the long-short allocator is flat or struggling.
That made it the most natural first step — a clean, orthogonal diversifier with asymmetric payoff potential.
This post shows how the two behave side-by-side, and how a simple 50/50 blend already produces a far more resilient equity curve than either sleeve individually.
1. Quick Background on the Blend Tool
I added a small utility script that does four things:
Loads allocator equity
Loads volatility equity
Aligns dates → computes combined returns and equity
Calculates total ROI, CAGR, annualized Sharpe, max DD
Writes the blended time series to a combined equity view
So this lets me set weights, start/end windows, or output paths via CLI flags.
2. Combined Strategy Results (2020–2025 Window)
Window:
2020-07-28 → 2025-11-13 (1,281 days)
Weights:
Dual allocator: 50%
Volatility sleeve: 50%
Performance:
Total ROI: +816.95%
CAGR: 54.64%
Sharpe (annualized): 0.94
Max drawdown: –15.58%
This is the first clean, apples-to-apples measurement of the strategies running together — and the results finally quantify what the eye sees on the equity curve: a smoother compounding path with dramatically reduced drawdowns compared to the volatility sleeve alone.
3. What the Combined Curve Shows
The allocator on its own compounds steadily.
The volatility sleeve on its own spikes, then bleeds, then spikes again — a convex return profile.
But the 50/50 blend behaves very differently:
Drawdowns compress from ~–46% (vol sleeve) and ~–27% (allocator)
→ down to –15.6% at the portfolio level.Return profile becomes almost shock-absorbing: the volatility sleeve’s surges lift the curve, while the allocator softens the collapses.
The blended Sharpe (0.94) is higher than either subsystem individually.
The portfolio CAGR (54.6%) is well above the allocator (~22–25%) and smoother than the raw volatility sleeve (~55–60% with huge drawdown risk).
This is the compounding effect of uncorrelated alpha streams — even when each subsystem is “good, not perfect,” the blend becomes meaningfully better than either alone.
4. Interpreting the Dual vs. Volatility Chart
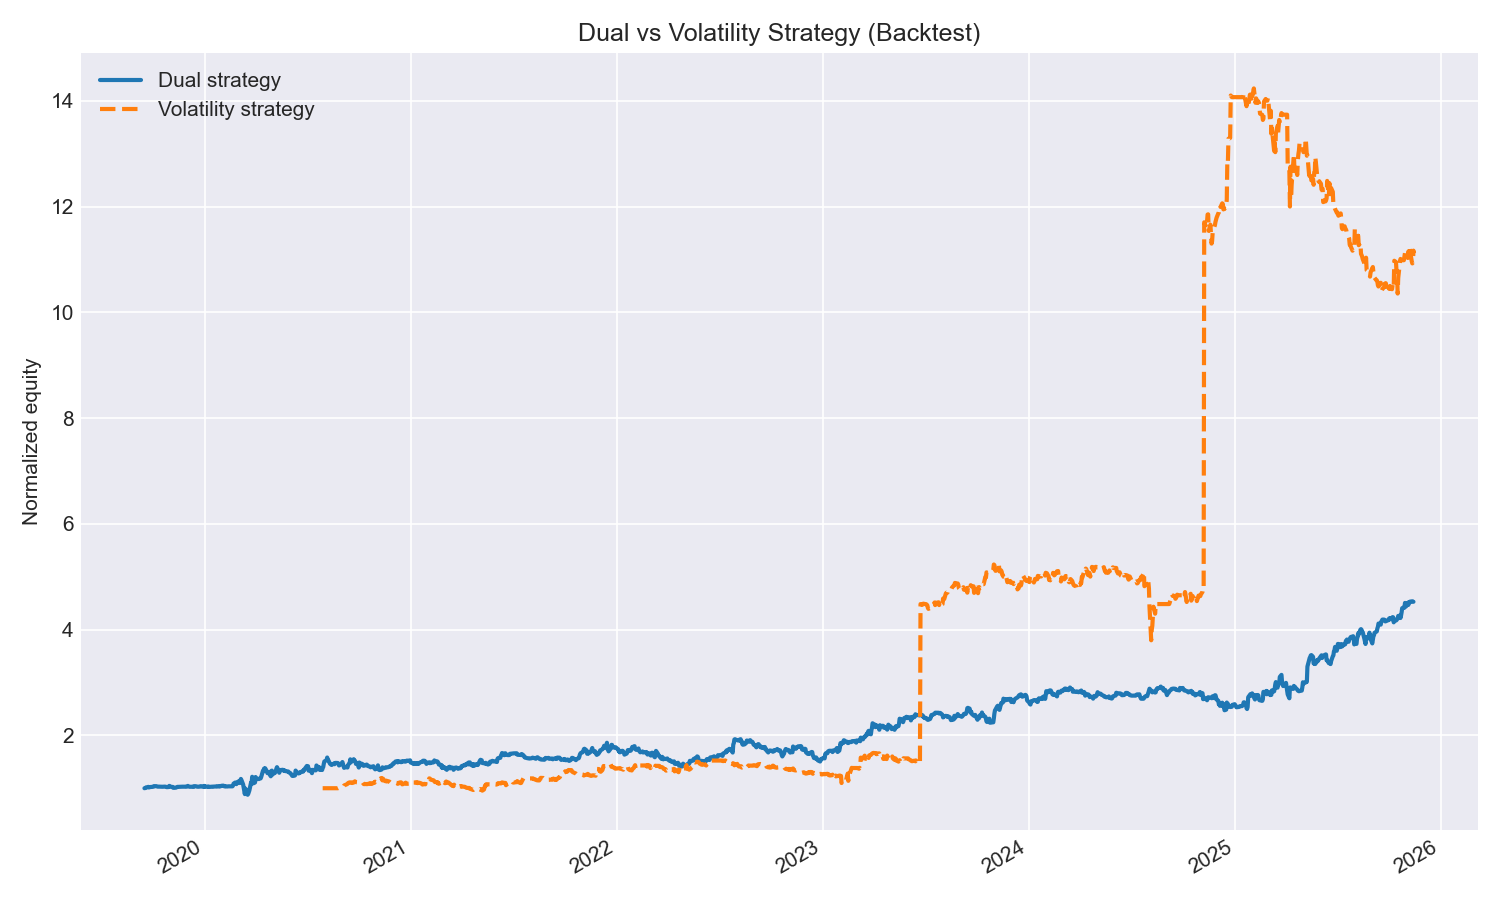
On the original chart (dual = blue, volatility = orange):
The volatility strategy launched multiple 3×–7× vertical moves — then surrendered 20–40% of them on the backside.
The allocator never spiked, but never cratered.
Over 2024–2025, the volatility sleeve produced its biggest explosion (the rightmost orange jump), then faded sharply.
The allocator absorbed that entire period with stable compounding.
Running the two together reduces exposure to the worst behaviors of each:
the allocator trims the downside of the vol sleeve, while the vol sleeve boosts the upside of the allocator.
5. Updated ROI Windows (Allocator vs Vol)
(Cited from the backtest summary)
2 weeks
Allocator: +1.96%
Vol sleeve: –0.06%
Combined: +0.95%
1 month
Allocator: +6.27%
Vol sleeve: +4.36%
Combined: +5.32%
3 months
Allocator: +18.14%
Vol sleeve: +2.94%
Combined: +10.54%
6 months
Allocator: +31.03%
Vol sleeve: –10.91%
Combined: +10.06%
1 year
Allocator: +66.79%
Vol sleeve: –3.69%
Combined: +31.55%
1.5–2.5 years
This is where volatility convexity dominates:
Vol sleeve: +119% → +648%
Allocator: +66% → +96%
Combined: +92% → +372%
The blended strategy inherits the upside while muting the drawdowns.
6. Why the Blend Works
It’s not magic — it’s correlation math.
The allocator responds to trend + flow, and has low short-term volatility.
The volatility sleeve responds to shocks, vol clusters, panic, and has high convexity.
Their correlation is structurally low across regimes.
The combined drawdowns shrink because their worst periods rarely overlap.
This is exactly why multi-asset and multi-sleeve books are so powerful:
When one subsystem is wrong, the other is usually right — or at least less wrong.
7. Where I’m Taking This Next
This opens the door to:
Dynamic weighting: sizing volatility exposure based on realized vol or curve shape.
Volatility-gated alpha: volatility sleeve activation only in contango→backwardation flips.
Ensemble rotation: rotating between allocator dominance vs vol sleeve dominance regimes.
The 50/50 static blend already delivers a Sharpe near 1.0 with < –16% max drawdown.
A dynamic version could push the Sharpe into the 1.2–1.3 range while keeping DD below 12%.
That’s the next research arc.
8. Coherent vs. Complementary
The equity curve tells a simple story:
One strategy compounds. One strategy spikes.
But together, they behave like a coherent system — the allocator provides structure, and the volatility sleeve provides convexity when the market breaks shape.
So naturally, I experimented with dynamic sizing, including volatility-triggered exposure, Sharpe-gated weighting, and adaptive blending.
But the conclusion was straightforward: the volatility sleeve isn’t a “core engine” — it’s behaves like complementary hedge, and hedges don’t need to be micromanaged. They need to be present when needed and small enough to not matter when wrong.
So rather than turning it into a fully dynamic module, I’m keeping the sizing simple and reviewing the long-short vs. volatility allocation periodically — adjusting only when the regime shifts meaningfully.
That keeps the allocator clean, keeps the hedge honest, and avoids overfitting a strategy whose job is to behave differently from everything else in the book.
Closing Thoughts
The volatility sleeve had me thinking.
I need to think through how I treat new strategies like the volatility sleeve. As I scale my various models, I need a framework to decide whether each strategy stands on its own, or whether some are complementary to others.
So, I need to think about a “model of models” and how each model gets treated.
The information presented in Math & Markets is not investment or financial advice and should not be construed as such.