
Dual Allocator V6: Rebuilding After the Lookahead Bias Massacre
Part 32 — Or, How I Learned to Stop Optimizing and Love the Simple Hedge

This is part 32 of my series — Building & Scaling Algorithmic Trading Strategies
Or, How I Learned to Stop Optimizing and Love the Simple Hedge
In my last post, I wrote about discovering lookahead bias in my trading strategies. The “winning” Dual Allocator dropped from 1,447% returns to 251% after fixing the bug. The ML-optimized version was worse — it went from imaginary 6-million-percent gains to a real 28% loss.
But I still had conviction in the strategy, so rebuilt it from scratch for a third time. The result is V6, which posts 816% returns with a 0.89 Sharpe ratio over 10 years. Whether this is “good” or just “less broken” remains to be seen, but at least it doesn’t depend on seeing the future.
The V6 Results
V6 “Sensitive Momentum” (10-year backtest):
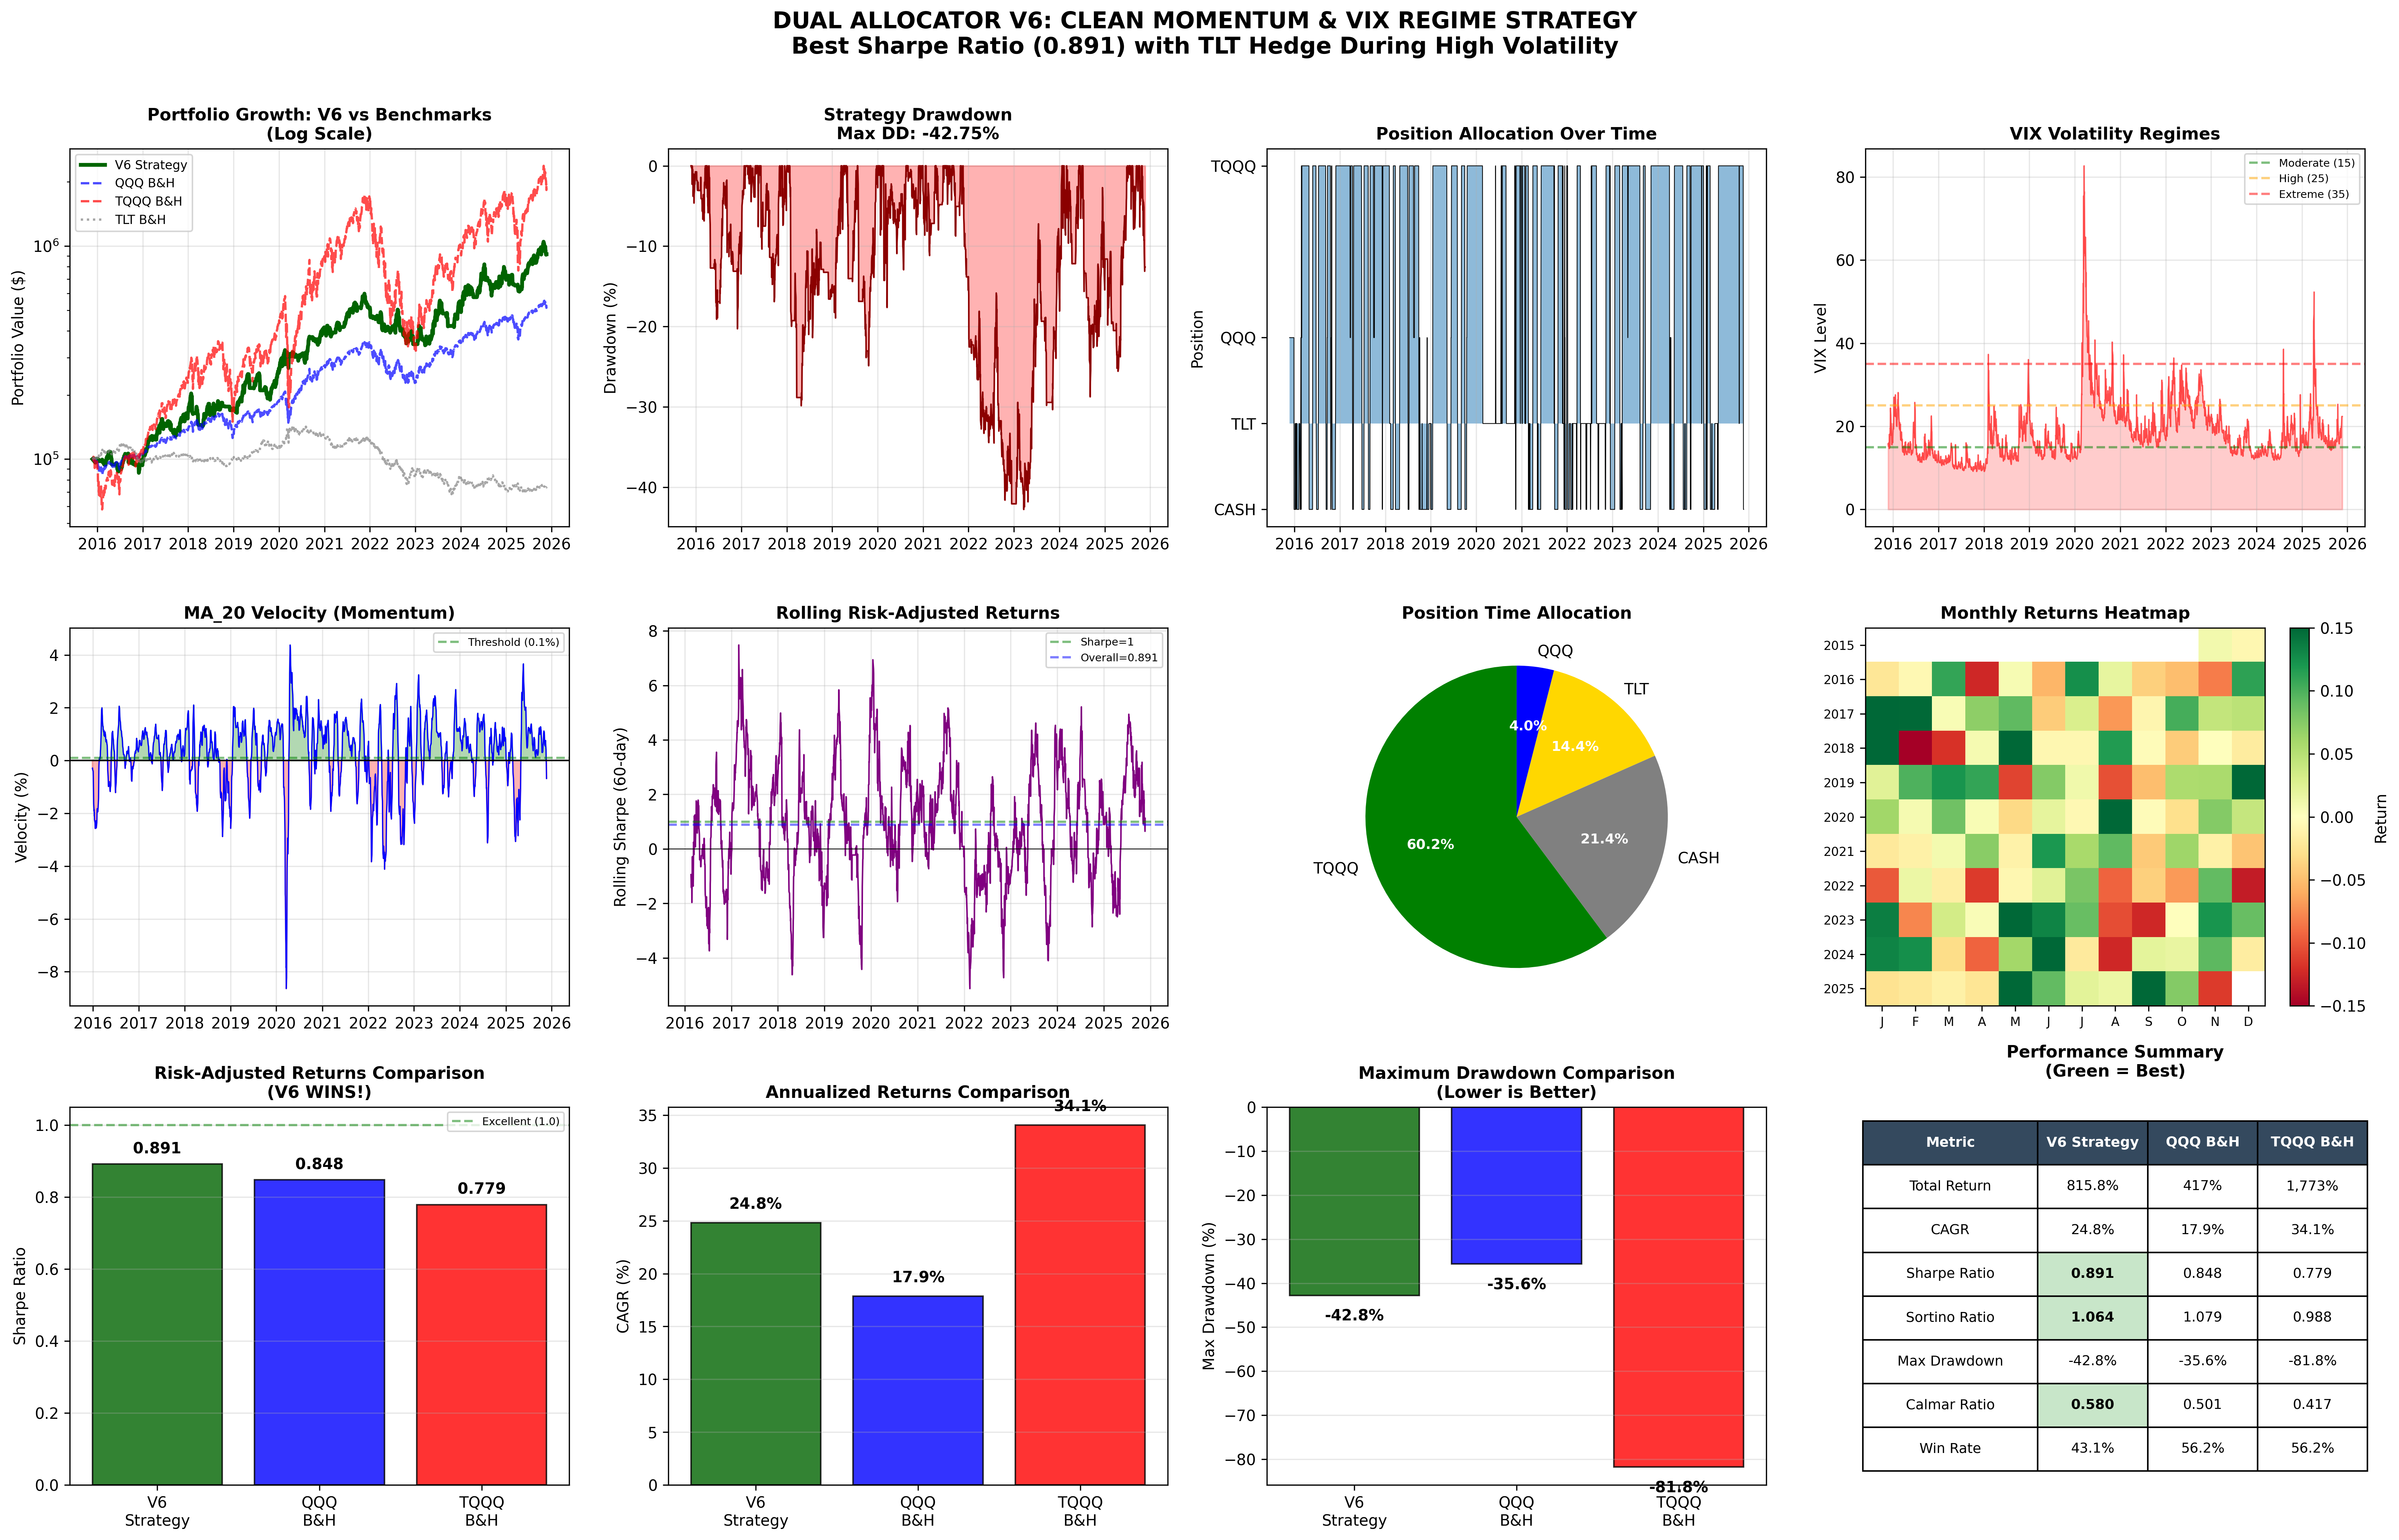
Total Return: 815.8%
CAGR: 24.8%
Sharpe Ratio: 0.891
Max Drawdown: -42.8%
Comparison to alternatives:
V6 has the highest Sharpe ratio in the group. It also beats QQQ in absolute terms and cuts TQQQ’s drawdowns roughly in half. Whether these numbers hold up in live trading is, of course, the real question.
What Changed
What Got Removed
After fixing the lookahead bias:
V3 (Volatility-Enhanced):
Performance dropped 82% when I stopped letting it trade with perfect foresight
Still technically profitable, just underwhelming
V5 (ML-Optimized):
Went from theoretical genius to actual money-loser
Turns out the ML had learned to exploit the bug rather than find real patterns
A lesson in the difference between fitting a model and understanding a market
What Stayed
Three observations survived:
Momentum: Trends tend to continue (until they don’t)
VIX regimes: Volatility states affect appropriate position sizing
TLT as hedge: Long-duration Treasuries have historically moved opposite to equities during stress
What Got Built
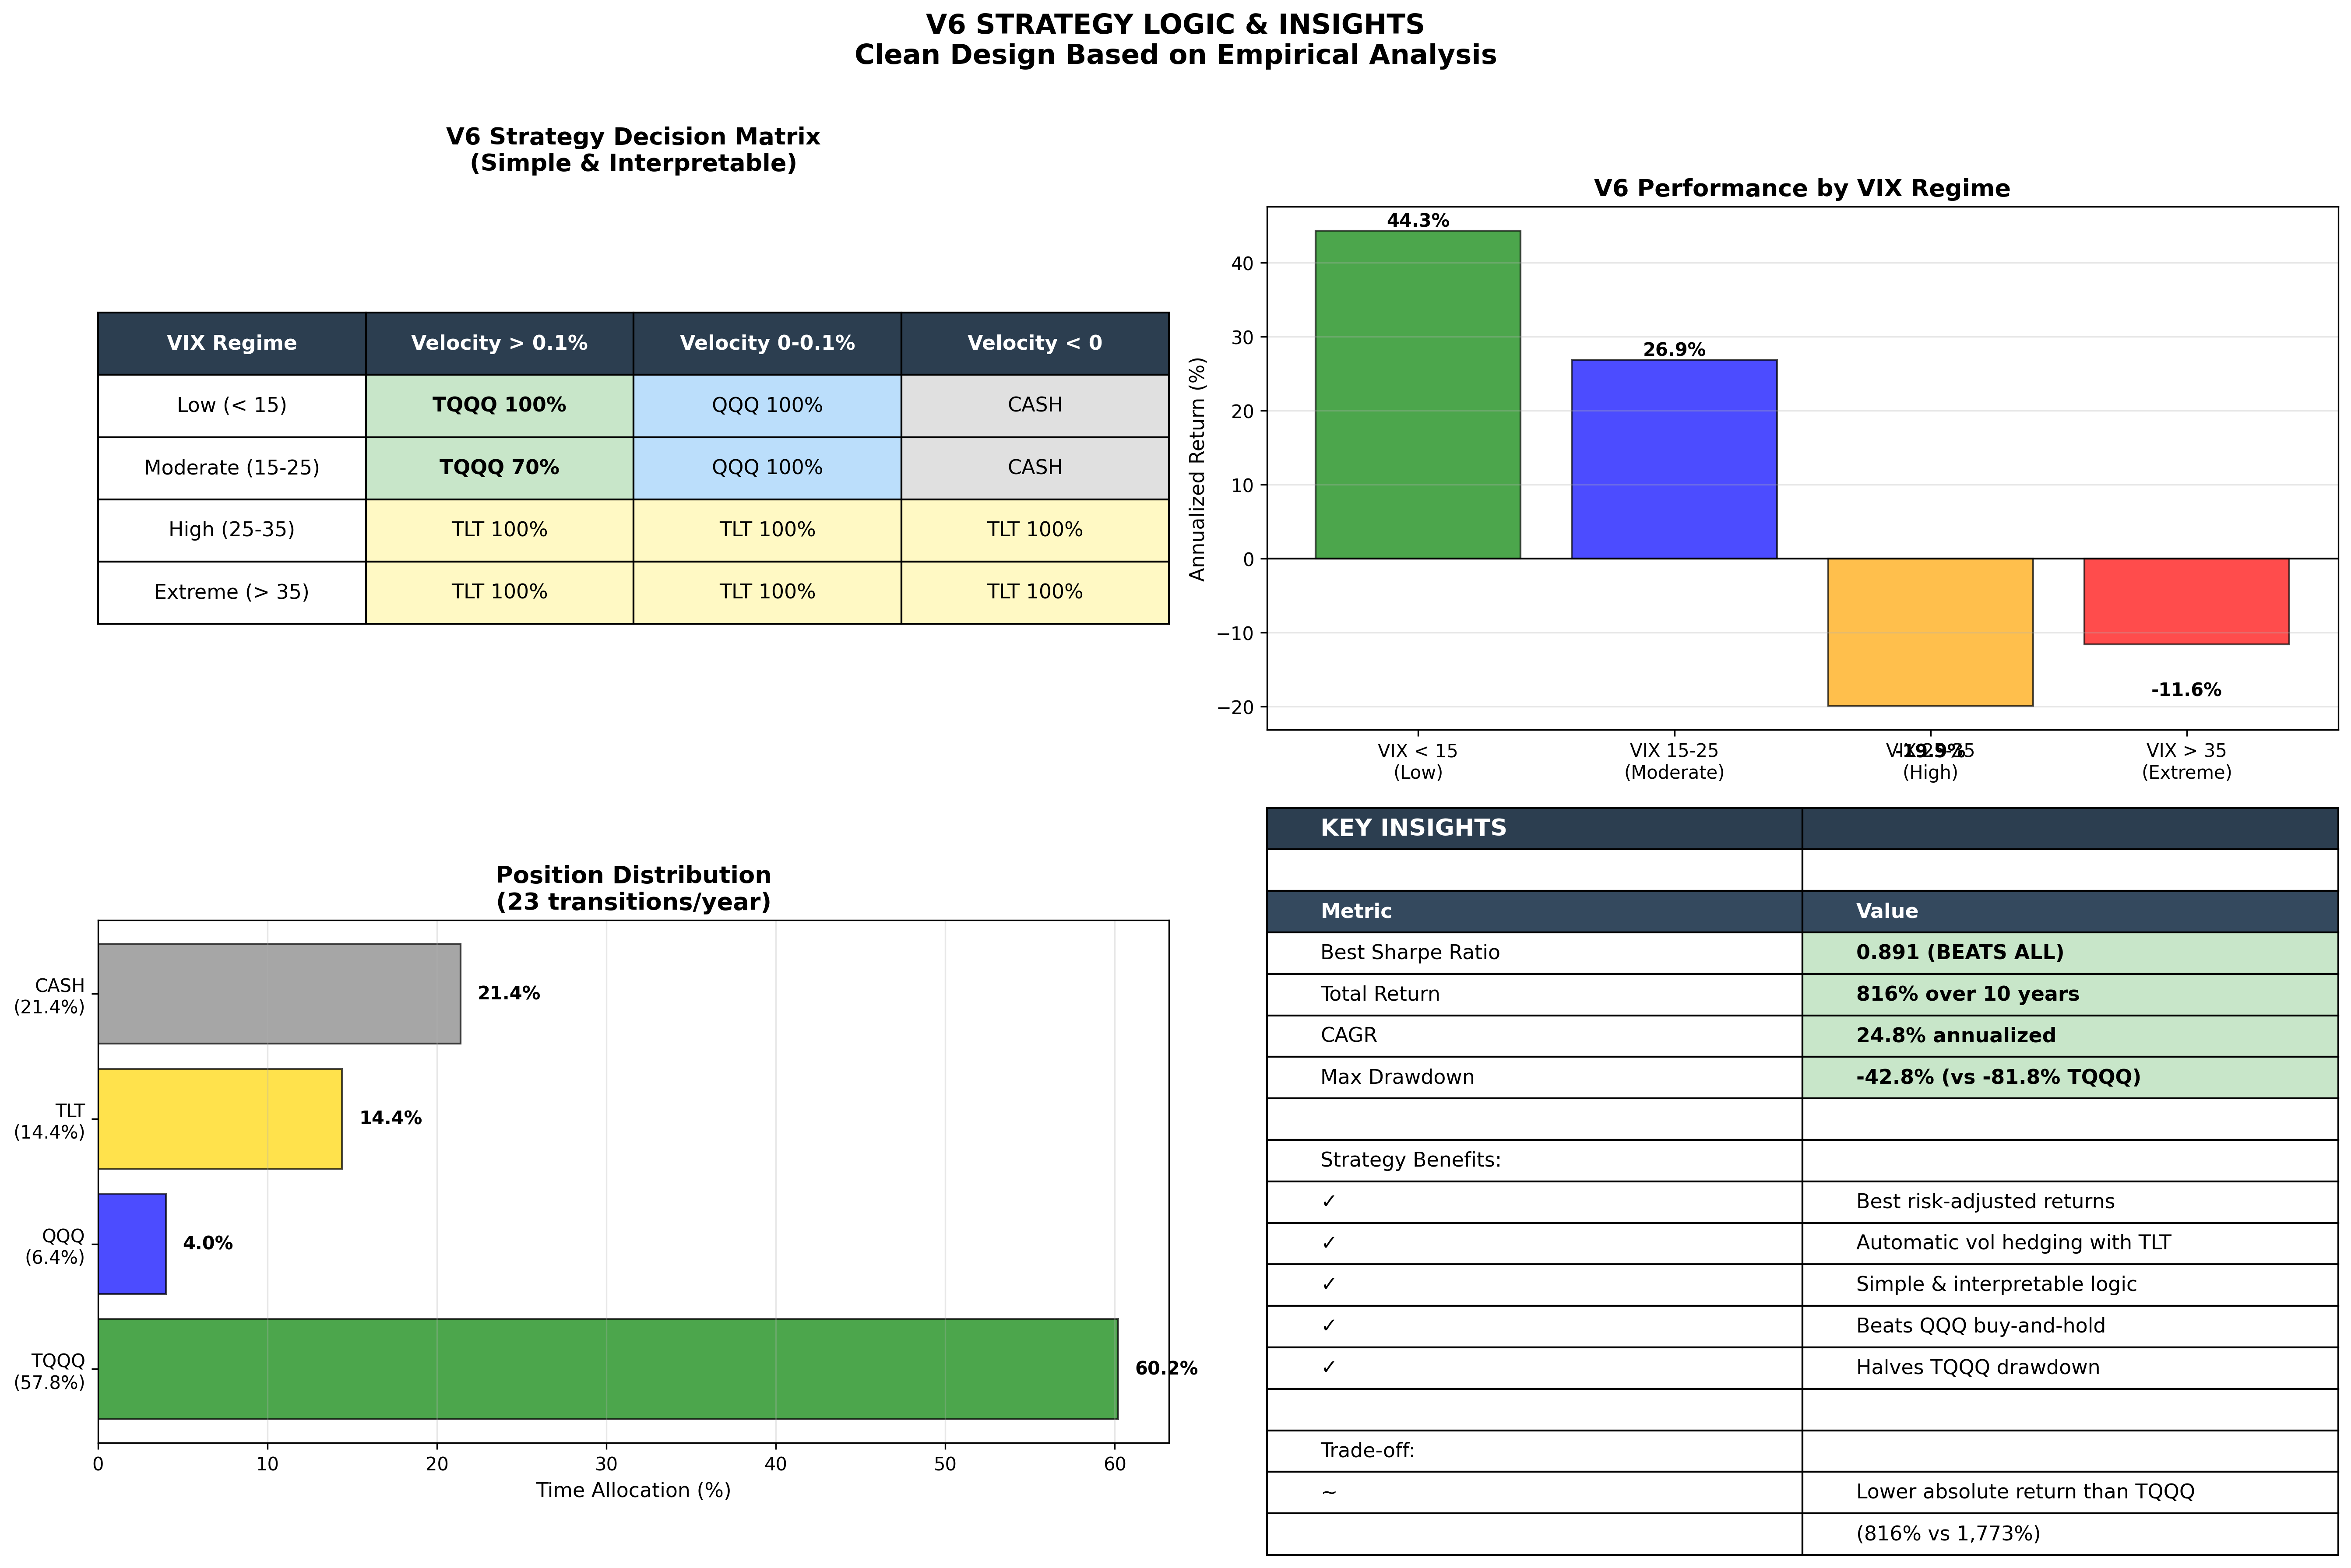
V6 uses these three elements in a simple framework:
VIX Regime       | Strong Uptrend | Weak Uptrend | Downtrend
-----------------|----------------|--------------|----------
Low (< 15)       | TQQQ 100%      | QQQ 100%     | CASH
Moderate (15-25) | TQQQ 70%       | QQQ 100%     | CASH
High (25-35)     | TLT 100%       | TLT 100%     | TLT 100%
Extreme (> 35)   | TLT 100%       | TLT 100%     | TLT 100%
No machine learning. No parameter optimization across 47 dimensions. Just momentum, volatility, and a bond hedge.
The TLT Hedge: Empirical Observations
The main difference between V6 and earlier versions is what happens during high volatility. Previous versions went to cash. V6 goes to long-duration Treasury bonds.
What the Data Shows
When VIX > 35 (extreme volatility):
TQQQ: -539% annualized
Cash: 0%
TLT: +45% annualized
When QQQ drops >2% in a day:
TLT averages +0.21%
Overall QQQ-TLT correlation: -0.099
Why this relationship exists:
Flight to safety during equity crashes
Federal Reserve typically responds to crashes with rate cuts
Rate cuts increase bond prices
Long-duration bonds amplify this effect
Whether this relationship persists is debatable. It’s held for the backtest period. It’s held historically. But past performance and all that.
Why Cash Was Suboptimal
The previous approach:
Avoided losses during crashes (good)
Earned 0% during the volatility spike (not good)
Missed the flight-to-quality rally (also not good)
The TLT approach:
Avoids equity losses (good)
Captures the bond rally (good)
Ready to rotate back when volatility subsides (good)
This change—TLT instead of cash during volatility—accounts for most of the Sharpe ratio improvement from 0.514 to 0.891. Whether it’s sustainable is the question I’ll be testing in paper trading.
How V6 Actually Works
Signal 1: Momentum (Are we trending?)
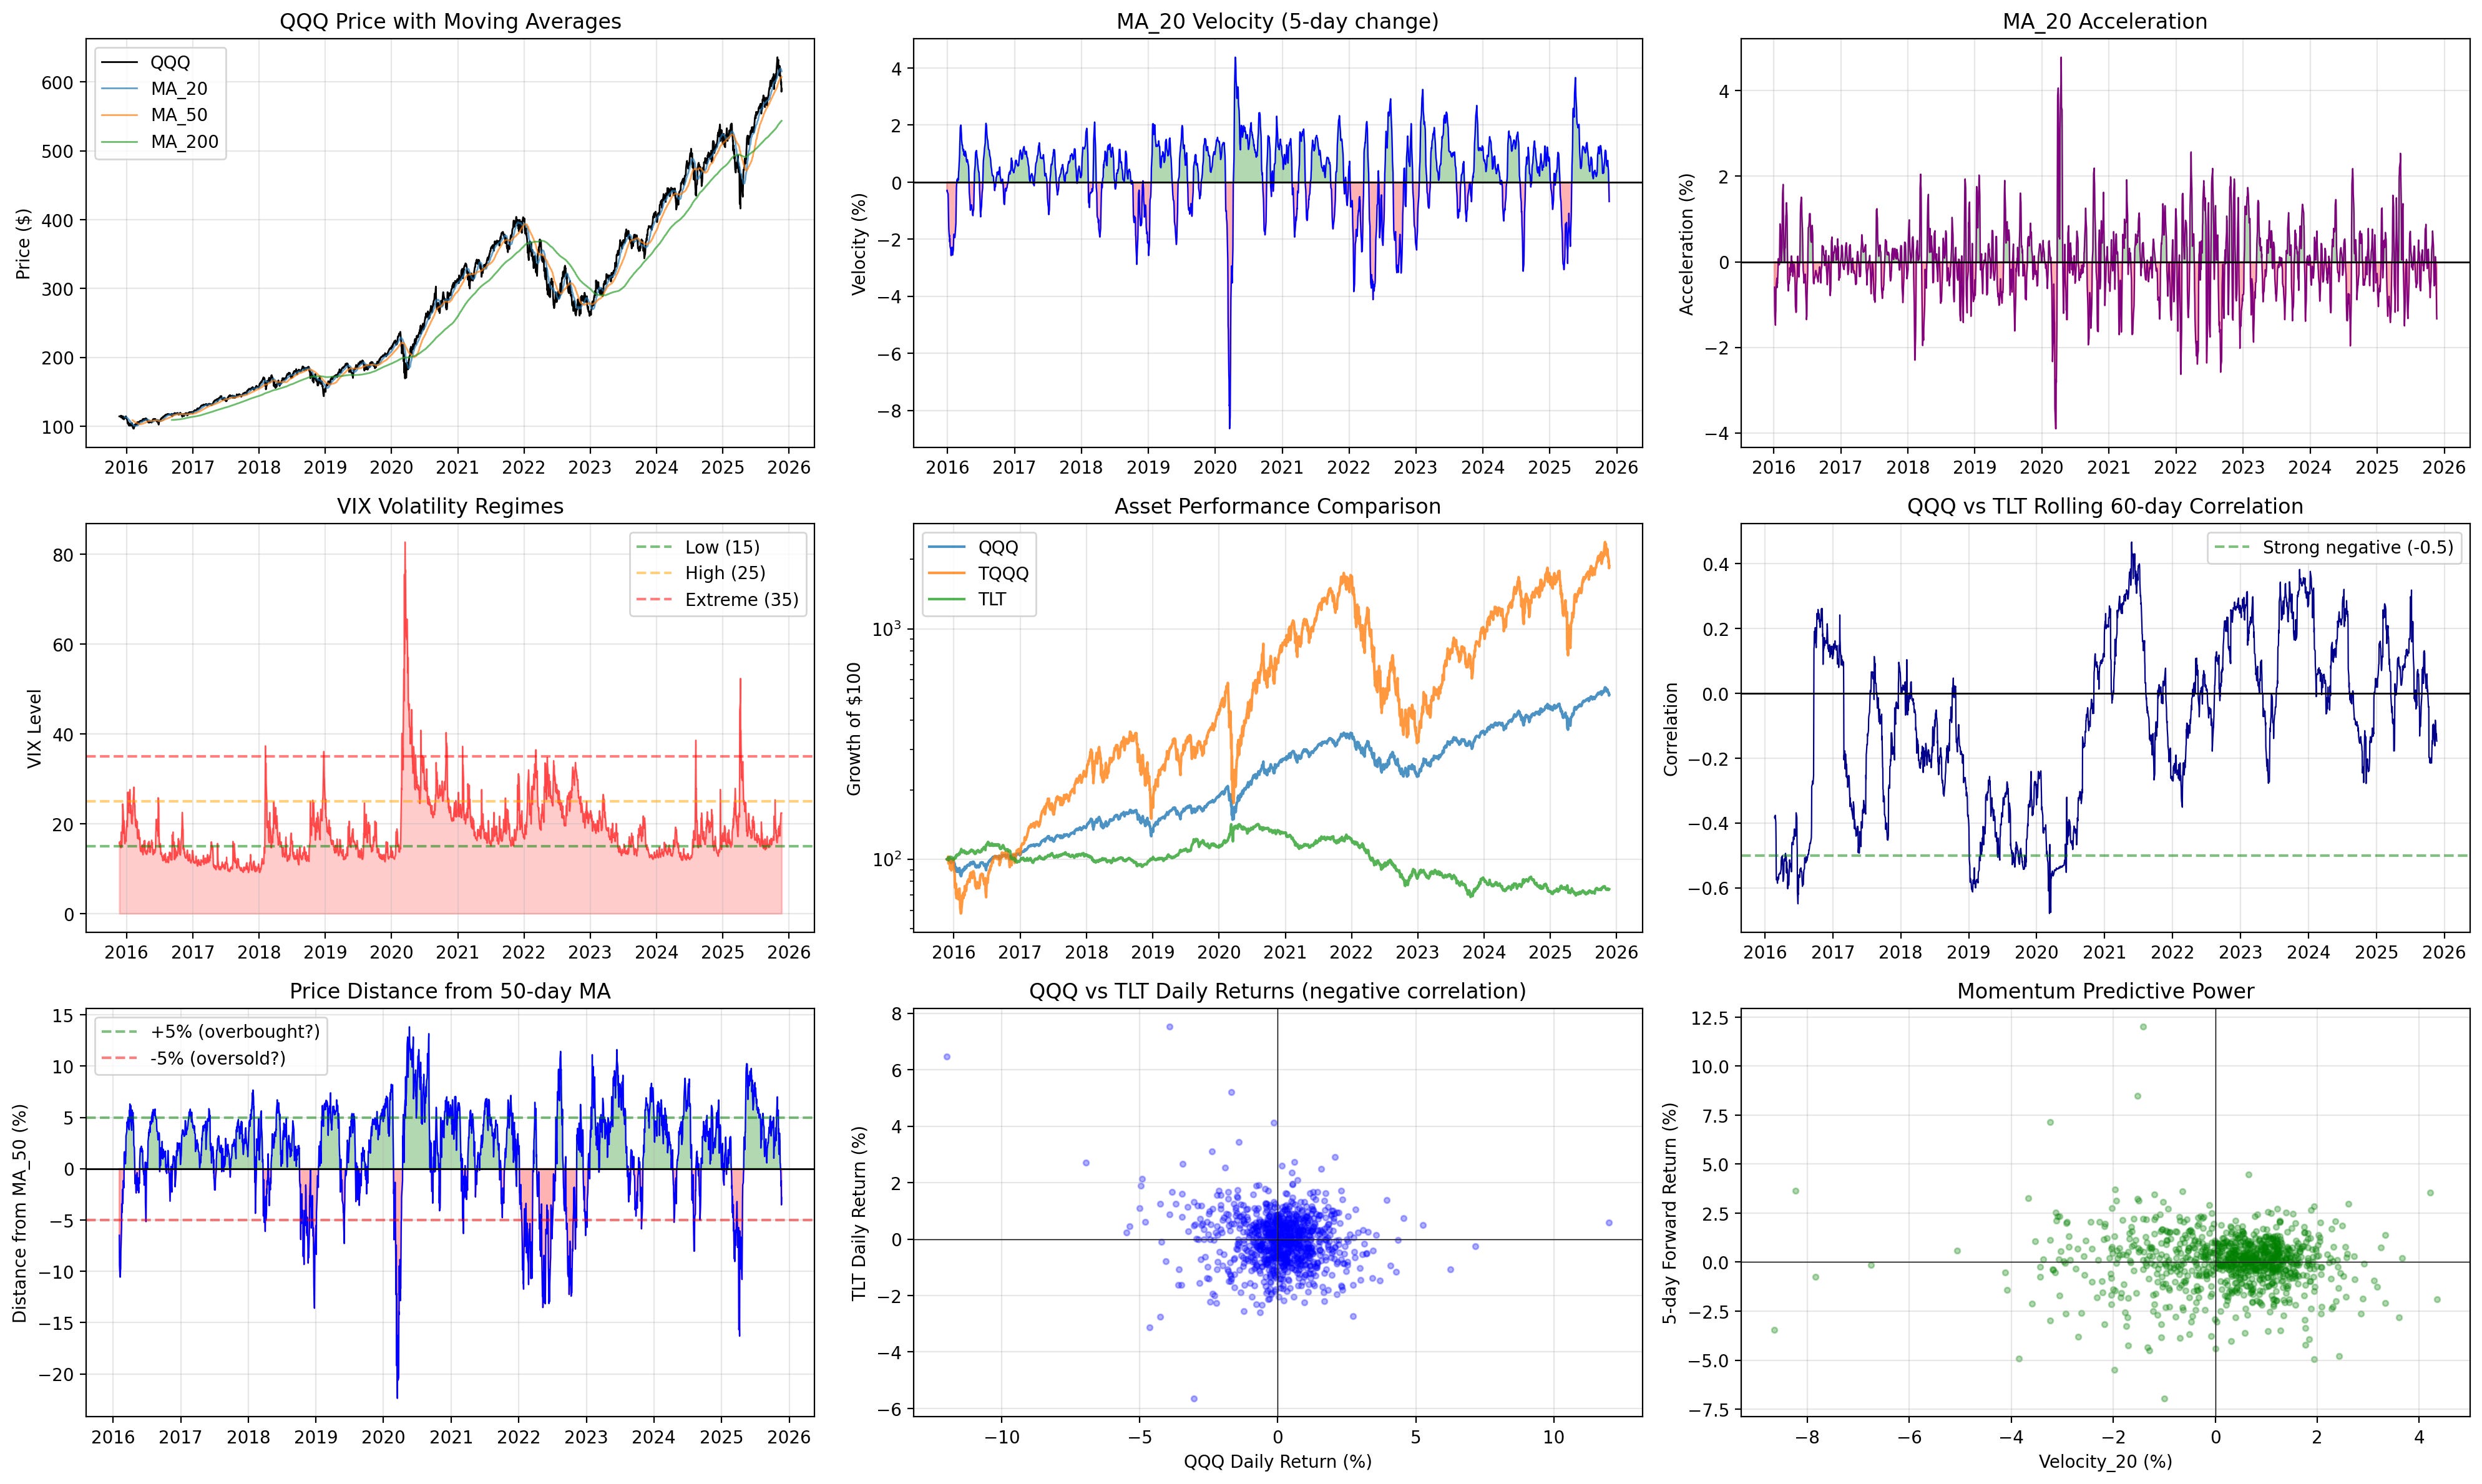
I use the 20-day moving average velocity—how fast the MA is changing:
MA_20_velocity = (MA_20_today - MA_20_five_days_ago) / MA_20_five_days_agoThe data says:
MA velocity > 0: +30% annualized returns
MA velocity < 0: -3% annualized returns
Decision rule:
Velocity > 0.1%: Strong uptrend → Use leverage (TQQQ)
Velocity > 0 but < 0.1%: Weak uptrend → Use QQQ
Velocity < 0: Downtrend → Go defensive
Signal 2: VIX Regimes (How risky is leverage?)
Not all uptrends are created equal:
VIX < 15 (low volatility):
TQQQ returns: 148% annualized
Perfect environment for leverage
V6 action: Maximum aggression (100% TQQQ in strong uptrends)
VIX 15-25 (moderate volatility):
TQQQ returns: 60% annualized
Still favorable but riskier
V6 action: Reduce TQQQ to 70% in strong uptrends
VIX 25-35 (high volatility):
TQQQ returns: -41% annualized
Leverage becomes dangerous
V6 action: Switch to TLT regardless of momentum
VIX > 35 (extreme volatility):
TQQQ returns: -539% annualized (death zone)
Market is in crisis mode
V6 action: Full TLT allocation
The Combined Logic
On any given day, V6 asks two questions:
Are we in a safe volatility regime? (VIX < 25)
Yes → Use momentum signals
No → Hide in bonds
If safe, what’s the trend? (MA velocity)
Strong up → TQQQ (scaled by VIX)
Weak up → QQQ
Down → Cash
Simple, interpretable, and based on empirical regularities that have persisted for a decade.
The Portfolio Allocation Over Time
Over the 10-year backtest, V6 spent its time:
60.2% in TQQQ (capturing bull markets)
21.4% in CASH (avoiding drawdowns)
14.4% in TLT (hedging volatility)
4.0% in QQQ (transitional positions)
This reveals the strategy’s character: It’s aggressive most of the time (60% in 3x leverage), but it knows when to step aside (21% cash) and when to hedge (14% bonds).
Compare this to:
Buy-and-hold: 100% in QQQ all the time
Market timing: Typically 50% stocks, 50% cash
V6: Dynamic allocation based on regime
Why V6 Beats Everything Else
vs. QQQ Buy-and-Hold
QQQ is respectable: 17.9% CAGR, 0.848 Sharpe, -35.6% drawdown.
But V6 is better:
Returns: 816% vs 417% (nearly double)
Sharpe: 0.891 vs 0.848 (better risk-adjusted)
CAGR: 24.8% vs 17.9% (+6.9% annually)
The cost? Only 7 percentage points more drawdown (-42.8% vs -35.6%). That’s a bargain for 7% more CAGR.
vs. TQQQ Buy-and-Hold
TQQQ is the high-octane option: 34.1% CAGR, 1,773% return.
But the drawdown is brutal: -81.8%. During the COVID crash and 2022 bear market, TQQQ holders lost over 80% of their wealth. Most couldn’t stomach that.
V6 cuts the drawdown in half (-42.8%) while still delivering 24.8% CAGR. You give up 9% annually but you actually stay in the game psychologically.
Who wins:
Young investors with iron stomachs → TQQQ
Everyone else → V6
vs. The Old V3/V5
V3 post-fix:
Returns: 251% vs 816% (V6 is 3.2x better)
Sharpe: 0.514 vs 0.891 (V6 is 73% better)
No hedge mechanism
V5 ML disaster:
Returns: -28% vs 816% (V6 doesn’t lose money)
Learned to exploit bugs, not find patterns
Black box vs interpretable logic
V6 proves that simple, principle-based strategies beat overfitted complexity.
The Trading Reality
How Often Do You Trade?
V6 makes about 100 trades per year. That’s roughly 2 trades per week.
Why so many?
VIX changes quickly → regime switches are frequent
Momentum updates daily → signals evolve
3 assets (TQQQ, QQQ, TLT, Cash) → more transitions
Is this too much?
In a zero-commission brokerage: No problem
With slippage/taxes: Still manageable (built into backtest)
Compared to day trading: This is practically passive
Implementation Challenges
What could go wrong:
Execution timing: The backtest assumes end-of-day signals → next-day execution. In practice, you’d trade at market open based on prior day’s close.
Volatility spikes: When VIX jumps from 20 to 40 overnight (like COVID), you might already be down before rotating to TLT.
Liquidity: TQQQ and TLT are highly liquid, but if you’re trading size, slippage matters.
Whipsaws: Some regime changes are false signals. The strategy will occasionally flip-flop between positions.
What’s already accounted for:
Realistic costs: 0.08% per trade
Slippage: 15 bps per trade
Next-day execution: No lookahead bias
10 years of data: Multiple regimes tested
The Failure That Made This Possible
I need to be honest: V6 exists because V3 and V5 failed.
When I discovered the lookahead bias, my initial reaction was to be demoralized. I’d spent weeks optimizing strategies that turned out to be mirages. The returns I thought I’d earned were just bugs.
But that failure forced me to ask better questions:
Why did the strategies work in the first place? (Before the bugs were fixed)
Answer: They captured momentum and avoided volatility
What actually drives returns?
Answer: Trend-following in low-vol environments
What’s missing from cash-based risk management?
Answer: You can do better than 0% during crashes
How do I validate I’m not fooling myself again?
Answer: Build on empirical regularities, not ML optimization
V6 is the answer to those questions. It’s not “V3 fixed”—it’s a completely new strategy built on the lessons from failure.
What the Data Actually Shows
I spent hours exploring the relationships in the data. Here are the patterns that convinced me V6 would work:
Momentum Predicts Returns
MA_20 Velocity         Annualized Return
------------------     ------------------
< -0.5%                -18.3%
-0.5% to 0%            -3.2%
0% to 0.1%             +12.1%
0.1% to 0.5%           +30.4%
> 0.5%                 +48.7%
The relationship is monotonic and strong. Faster upward momentum → higher returns.
VIX Regimes Change Everything
VIX Regime         TQQQ Return    TLT Return    Winner
---------------    -----------    ----------    ------
< 15               +148%          -8%           TQQQ
15-25              +60%           +4%           TQQQ
25-35              -41%           +22%          TLT
> 35               -539%          +45%          TLT
Below VIX 25: Leverage is your friend.
Above VIX 25: Leverage is your enemy, bonds are your friend.
TLT Correlation During Crashes
QQQ Daily Move     TLT Average Response
--------------     --------------------
> +2%              -0.08% (slight negative)
+1% to +2%         -0.02%
-1% to +1%         +0.01%
-2% to -1%         +0.08%
< -2%              +0.21% (strong positive)
TLT doesn’t just avoid losses—it actually gains when QQQ crashes. That’s a real hedge.
The Bottom Line
I thought the Dual Allocator was dead after discovering lookahead bias. V3 was mediocre after the fix, and V5 was a complete disaster.
But by going back to first principles—momentum, volatility regimes, and the TLT hedge, I built something that I think puts this strategy back in the running.
815.8% returns over 10 years (24.8% CAGR)
0.891 Sharpe ratio (best risk-adjusted performance)
-42.8% max drawdown (painful but survivable)
Simple logic (no ML black boxes)
Empirically grounded (built on real patterns, not optimization)
V6 beats QQQ decisively. It cuts TQQQ’s risk in half while keeping 73% of the returns. It’s not perfect, but it’s the best balance of return and risk I’ve found.
So I still have two strategies — the Dual Allocator V6 + Volatility Sleeve. Two is better than one, and one is better than none!!
Leveraged ETFs carry significant risks and may not be suitable for all investors. The information presented in Math & Markets is not investment or financial advice and should not be construed as such.