
Documenting 7 Asymmetric Return Strategies
Part 51: A framework for high-ROI options strategies (with the usual caveats)

This is part 51 of my series — Building & Scaling Algorithmic Trading Strategies
I’ve been putting together documentation for a set of options strategies that prioritize absolute returns over risk-adjusted metrics. The common thread: asymmetric payoff structures where the upside significantly exceeds the downside, even if win rates are lower.
This is different from the usual approach. Most institutional strategies optimize for Sharpe ratio, which penalizes volatility equally in both directions. But if you’re trying to grow a smaller account and can stomach drawdowns, the math changes. A strategy with 20% win rate and 15x average payoff has a positive expected value, even though it feels terrible to execute.
I’ve documented 7 strategies across the volatility, event-driven, and commodity spaces. None of these are backtested yet — they’re frameworks with entry criteria, position sizing rules, and risk management guidelines. Think of this as the spec sheet before the engineering work.
The 7 Strategies
I came up with this list looking for what I could realistically execute without a prime brokerage account and while staying true to this theme.
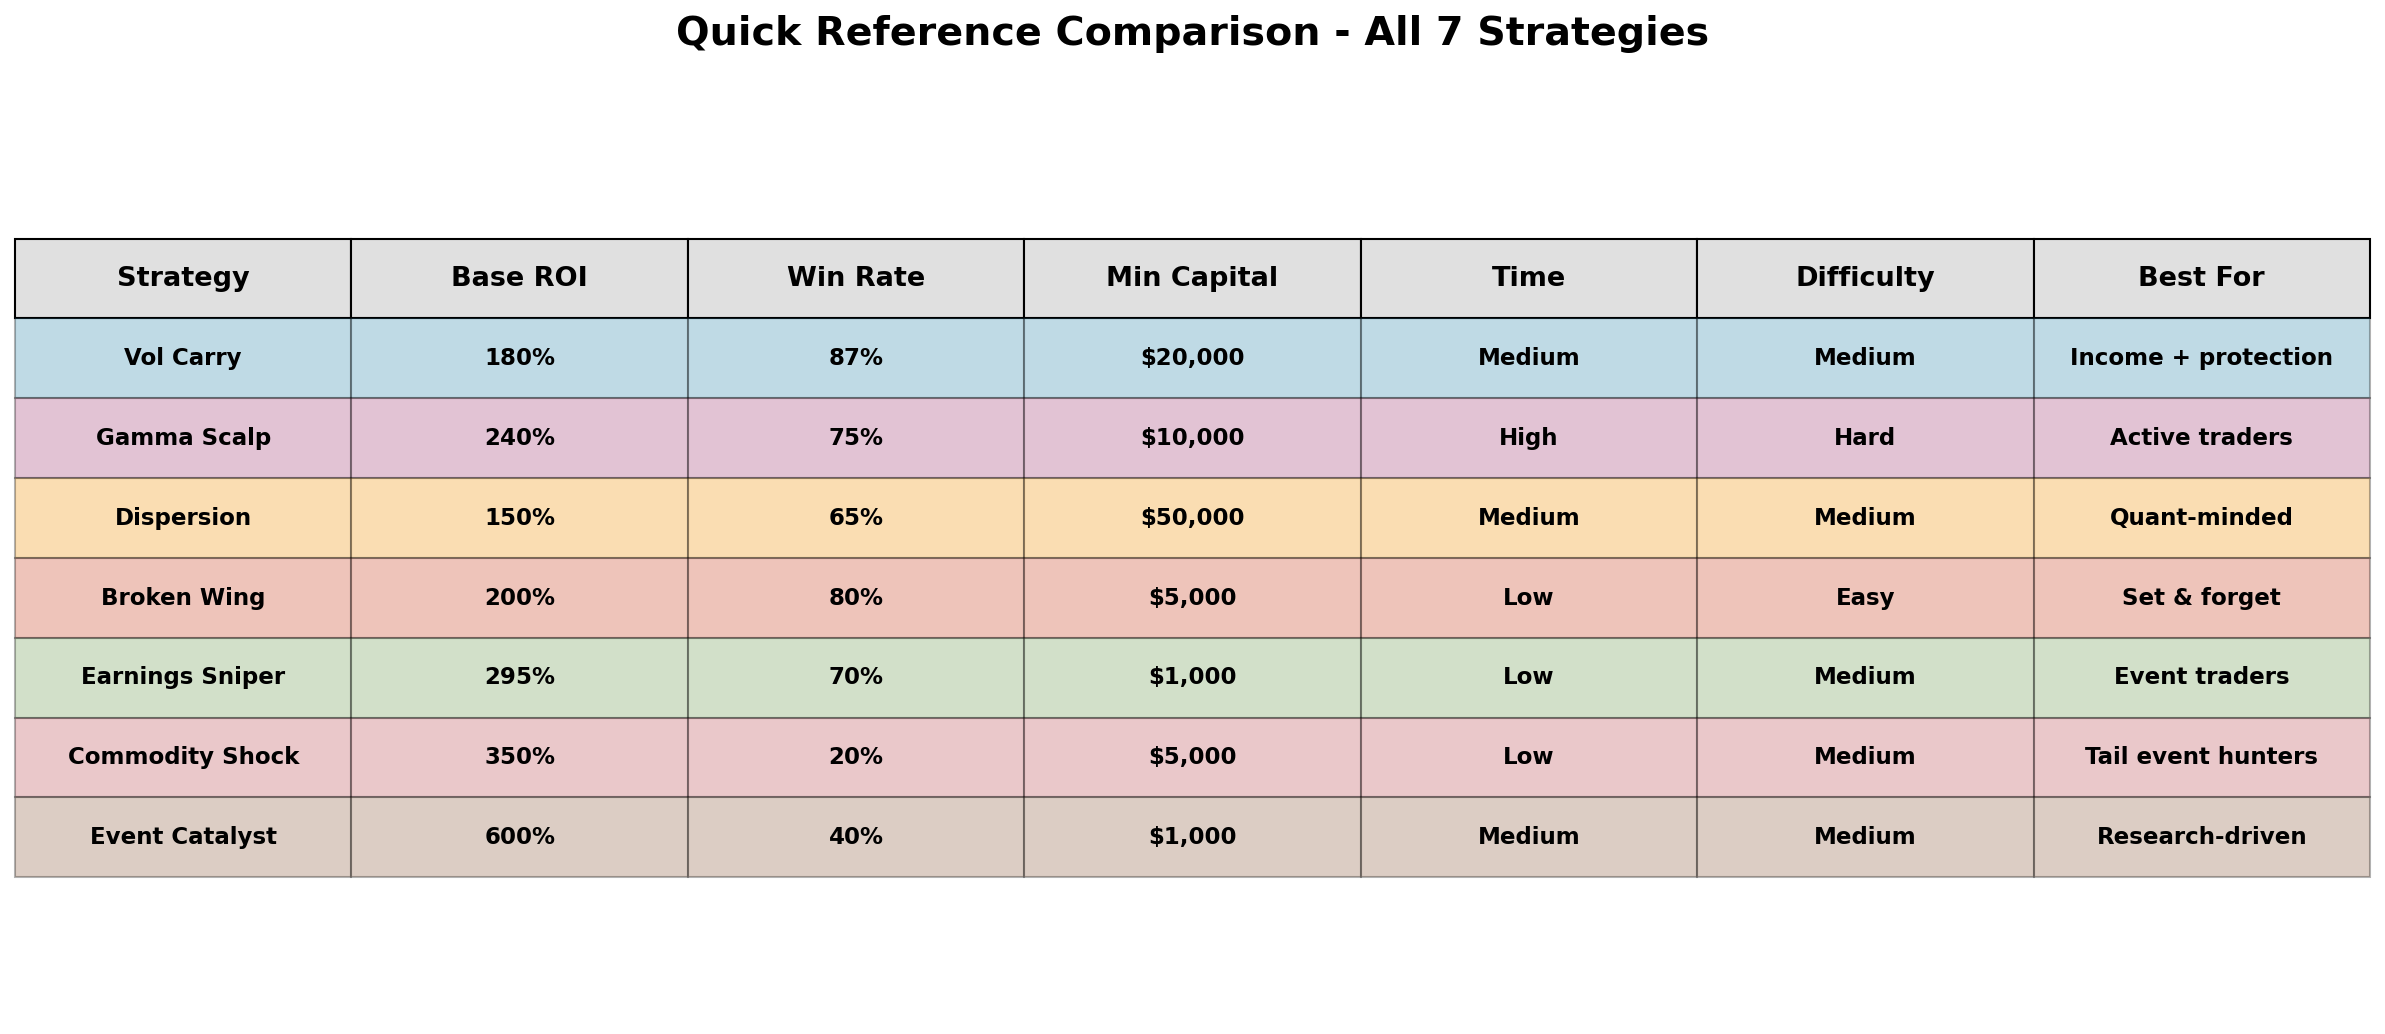
Strategy              Target ROI   Win Rate   Min Capital   Time/Week
─────────────────────────────────────────────────────────────────────
Vol Carry Harvest        180%        87%        $20k         2-5 hrs
Gamma Scalping           240%        75%        $10k         5-15 hrs
Dispersion Bomb          150%        65%        $50k         2-5 hrs
Broken Wing Butterfly    200%        80%        $5k          <2 hrs
Earnings Sniper          295%        70%        $1k          <2 hrs
Commodity Shock          350%        20%        $5k          <2 hrs
Event Catalyst           600%        40%        $1k          2-5 hrs
The numbers look absurd, and they should raise flags. These are theoretical targets based on the strategy mechanics, not realized performance. The actual results will depend on execution, market conditions, and whether the underlying edge actually exists.
Two Discarded Strategies (Might Revisit Later!!)
Busted converts near bond floor
The idea is that you purchase distressed convertible bonds trading close to credit value; you get equity optionality almost for free with downside buffered by the bond floor. The upside can explode on restructuring/turnaround.
You can scale by focusing on issues with hard collateral, short borrow available (for hedging), and defined catalysts.
However, this is only feasible if you get prime brokerage access and understand credit markets. Not beginner-friendly.
Parabolic trend pyramiding with tight loss caps
This would involve trading strong breakouts with very tight initial stops; you’d add (pyramid) only when price extends in our favor and trail stops to lock gains.
Many small losses, few very large wins. ROI can be high due to convex sizing.
You’d scale by keeping fixed fractional risk per trade, predefining add points, and cutting fast on reversals.
But this is a different style entirely (not options). Add only if we want to diversify into systematic futures trading.
The Win Rate vs. ROI Tradeoff
The strategies cluster into two camps: high win rate with moderate returns, and low win rate with massive payoffs.
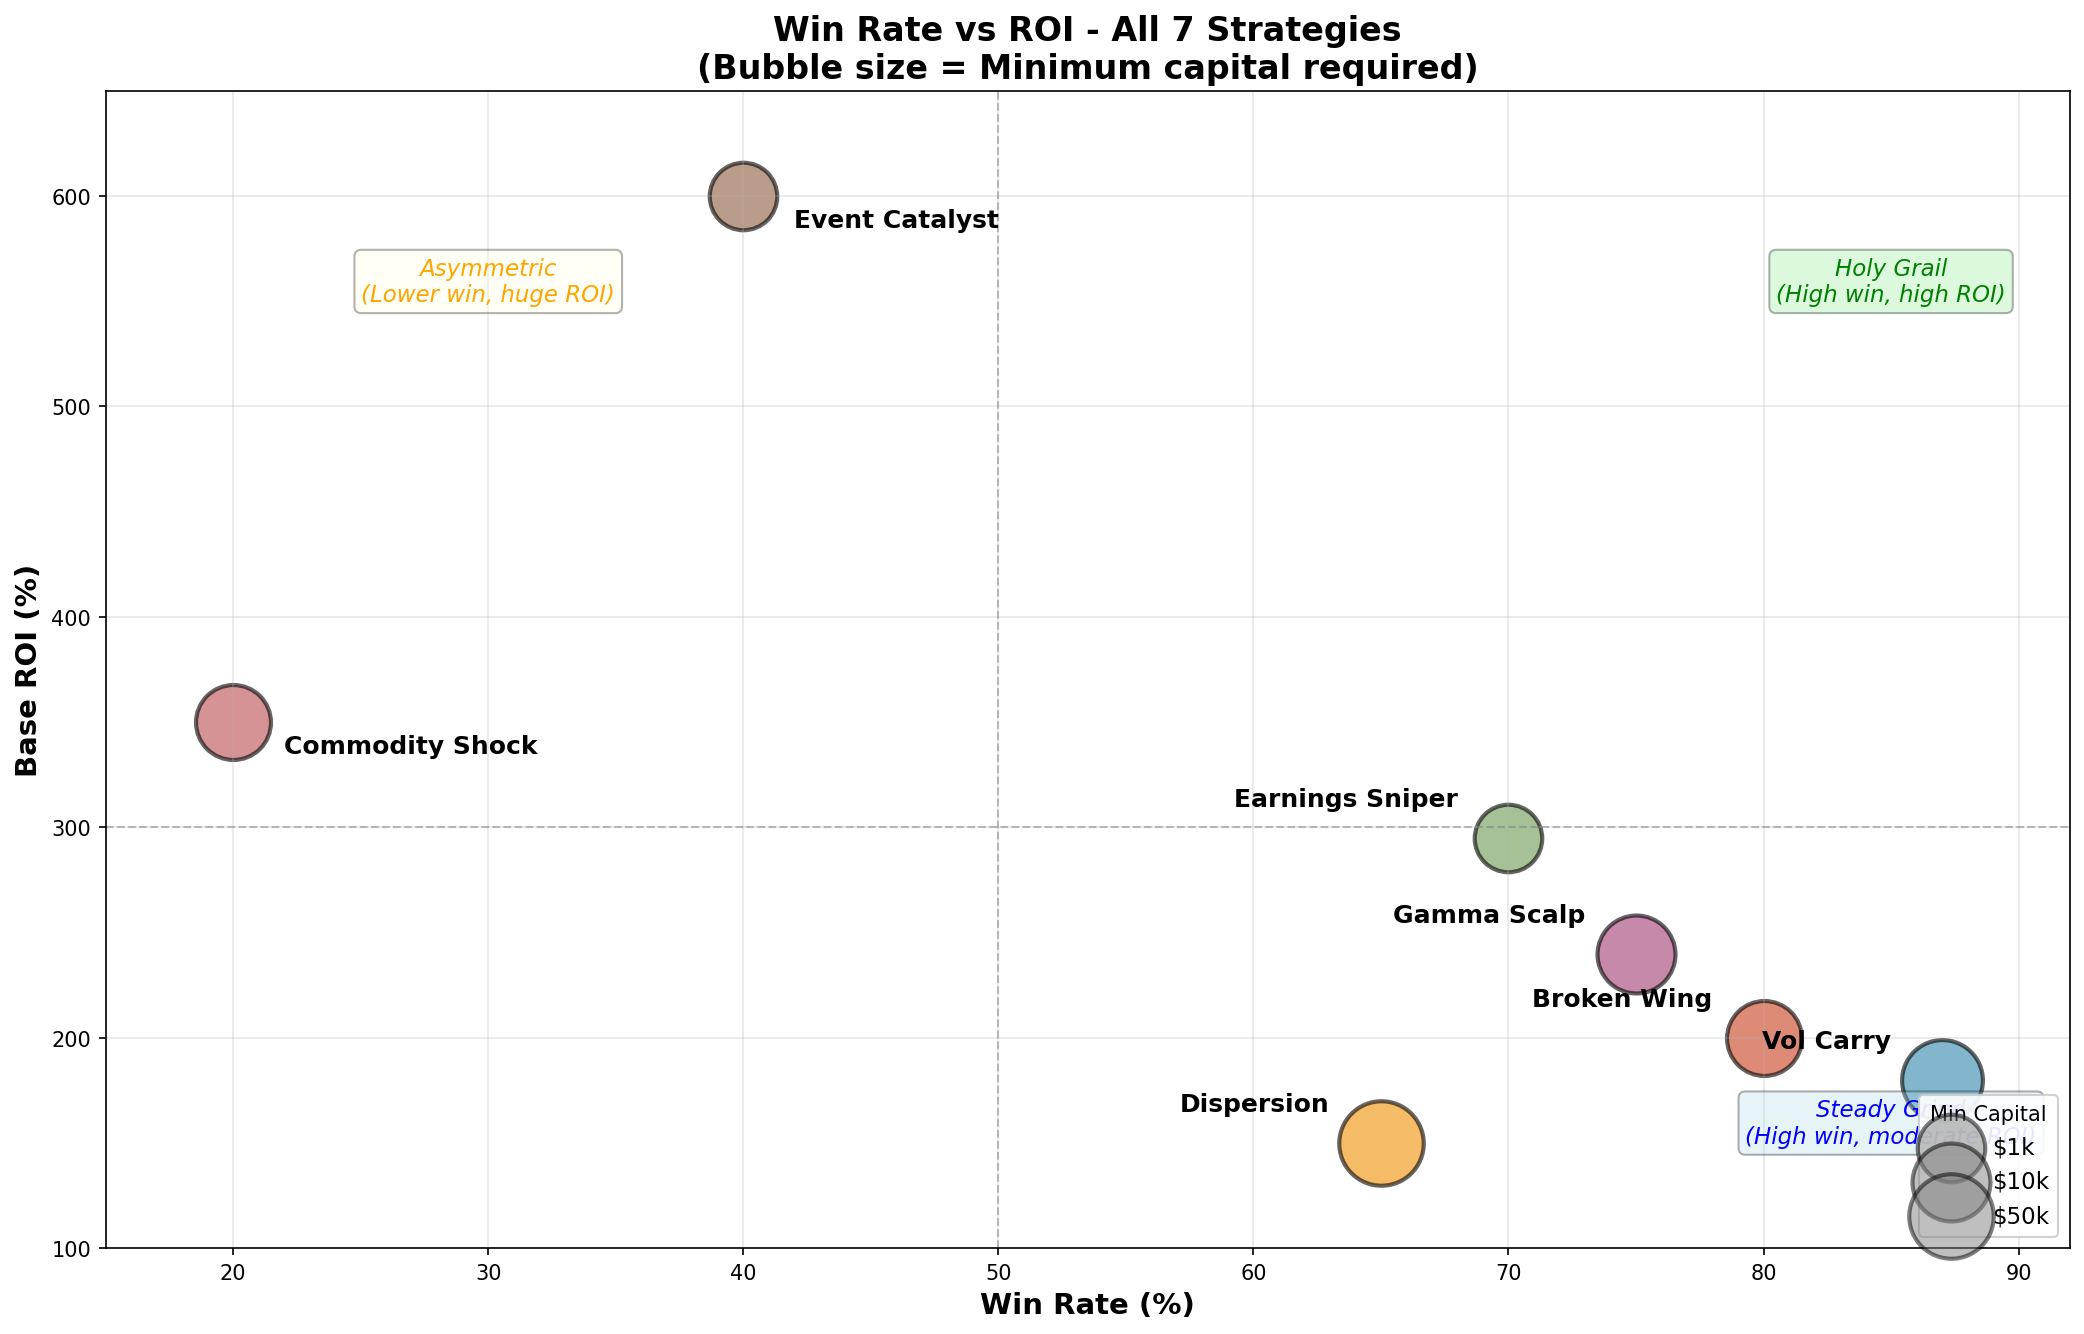
The high win rate strategies (Vol Carry, Broken Wing, Gamma Scalping) sit in the 75-87% range with 150-240% target returns. These feel good to trade because you’re usually right, but the winners are capped.
The low win rate strategies (Commodity Shock, Event Catalyst) are the opposite: 20-40% winners, but the payoffs can be 10-20x. This is emotionally brutal. You’ll have 5-10 losers in a row as the baseline, not the exception.
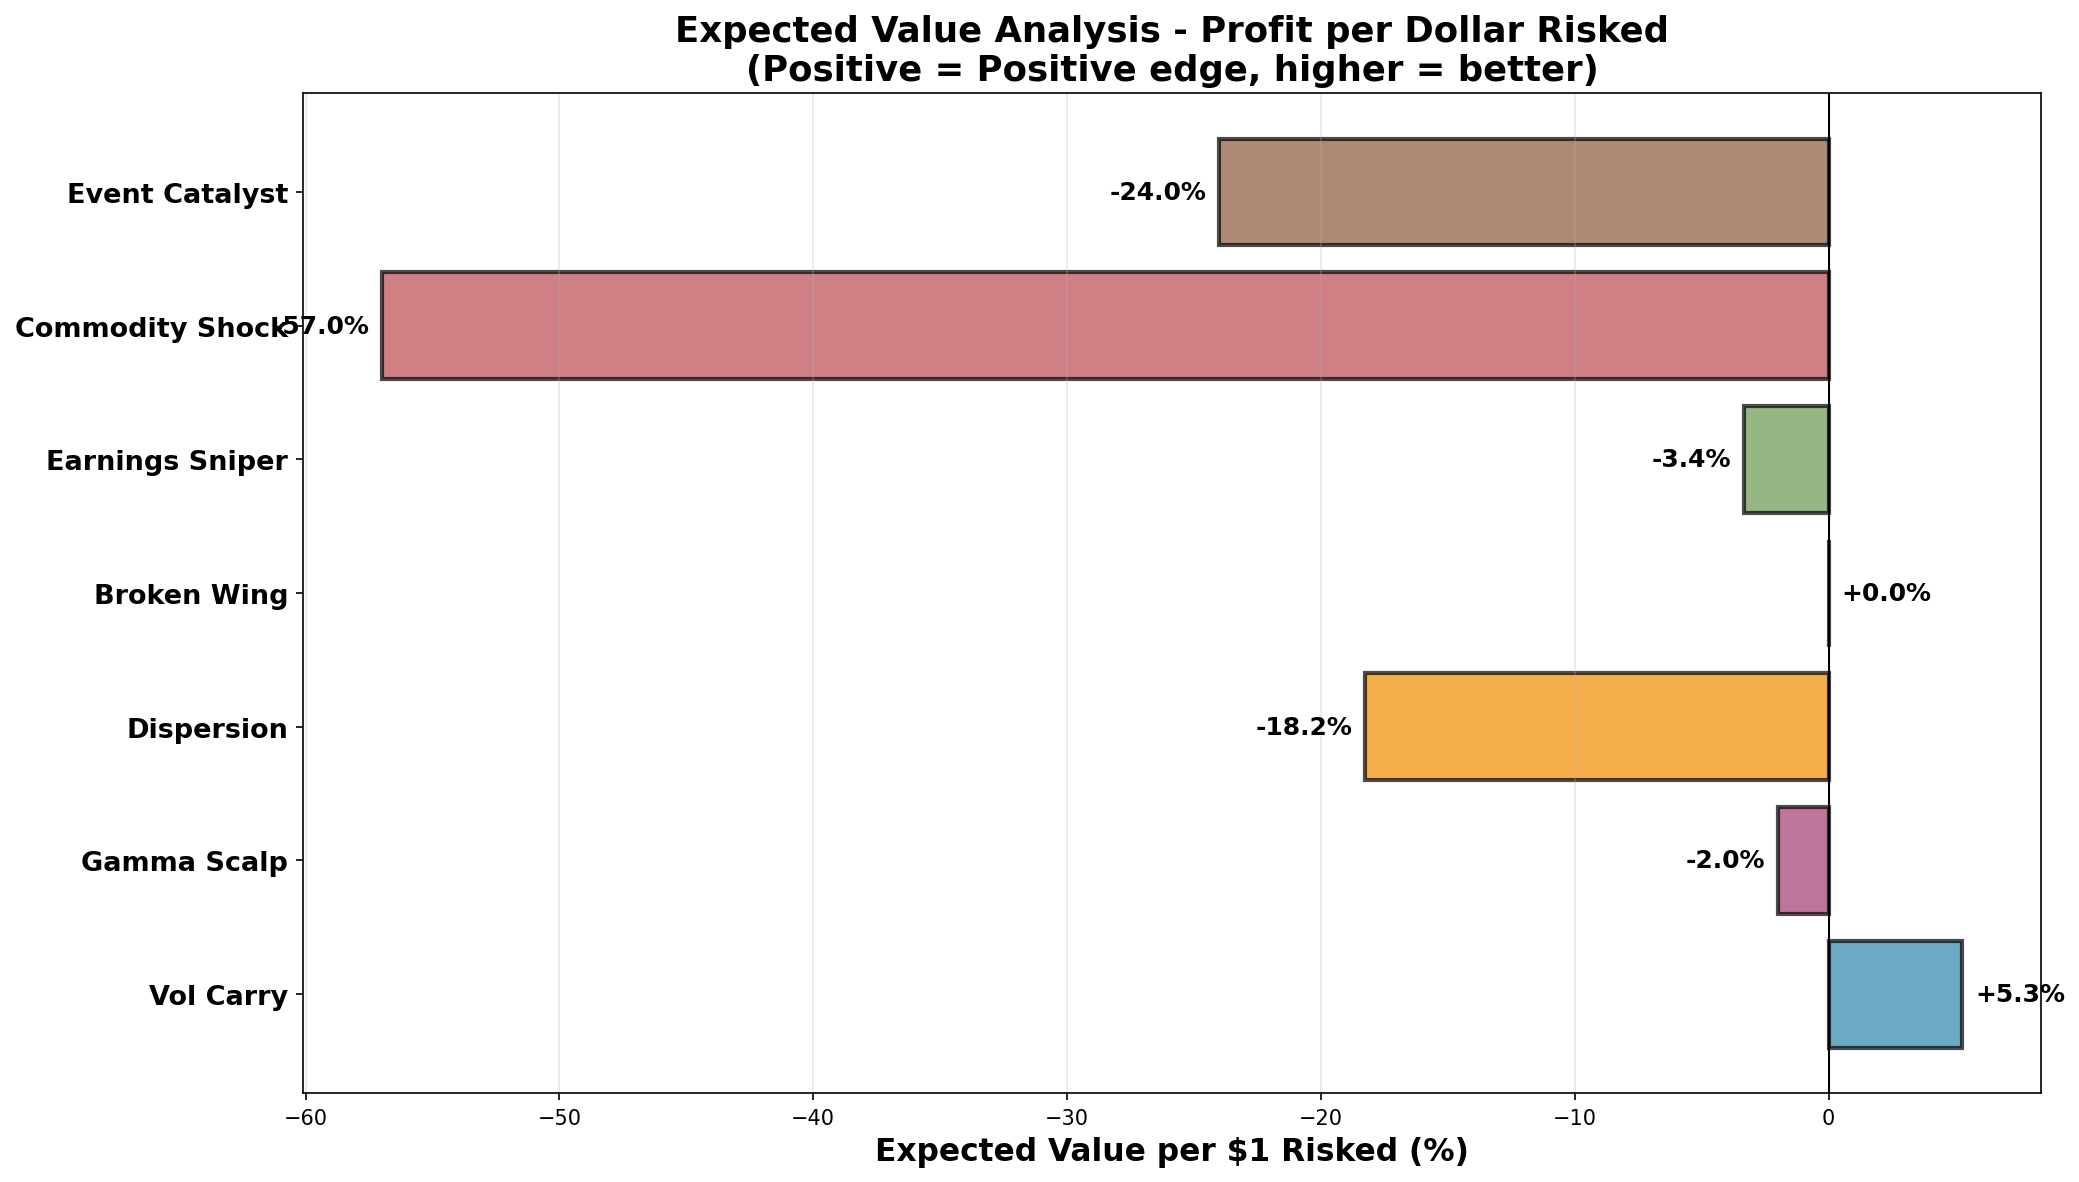
The math for why this works:
Expected Value = (Win Rate × Avg Win) - (Loss Rate × Avg Loss)

Commodity Shock example:
  Win rate: 20%
  Avg winner: 15x (1500% ROI)
  Avg loser: -100% (premium expires worthless)

EV = (0.20 × 15) - (0.80 × 1) = 3.0 - 0.8 = +2.2x per trade
A positive expected value of 2.2x per trade is excellent, but the path to get there involves watching 80% of your positions go to zero. Most people can’t do this psychologically, which is partly why the edge exists.
Comparing All Dimensions
The radar chart compares each strategy across six dimensions: ROI potential, win rate, scalability, time commitment, difficulty, and capital efficiency.
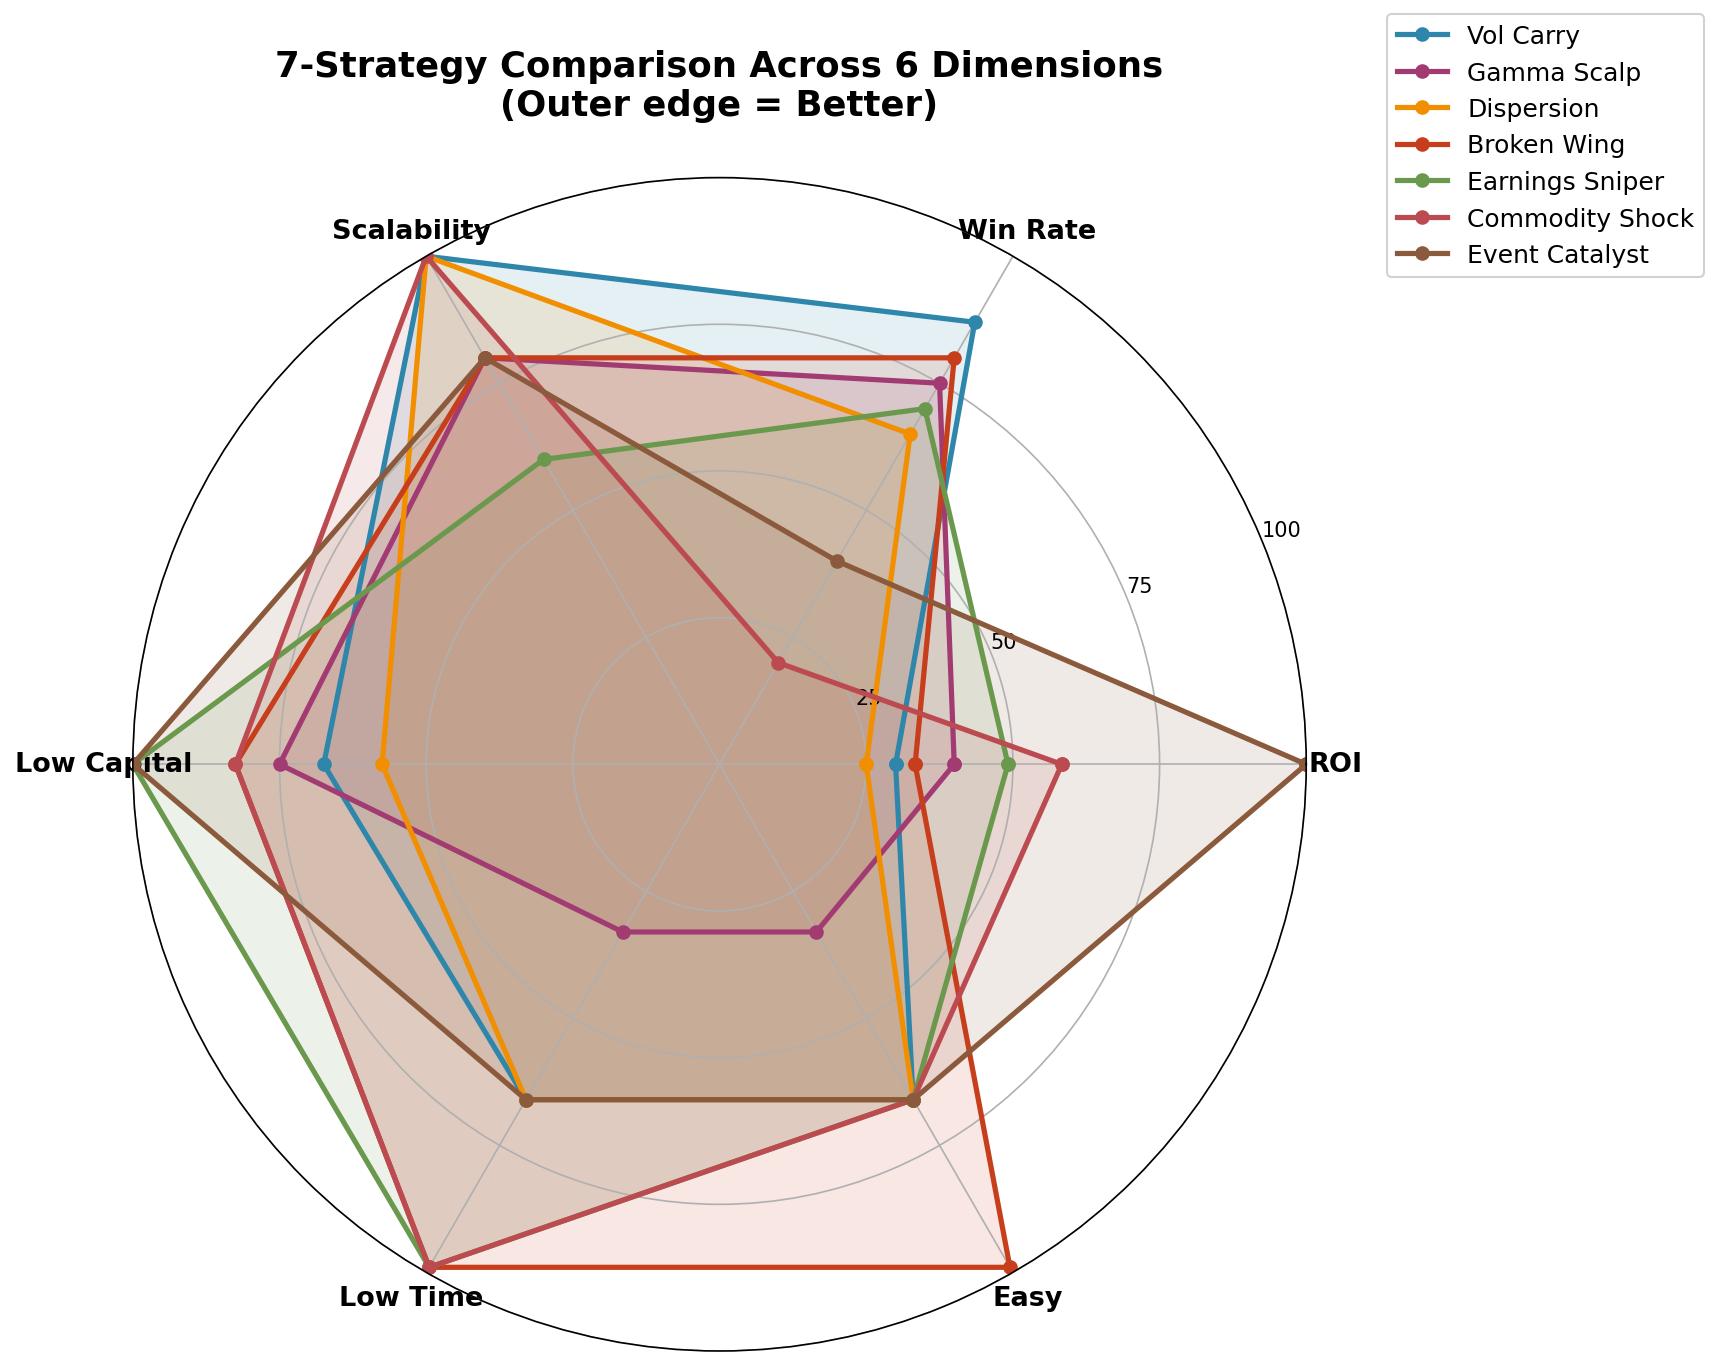
Some observations:
Vol Carry Harvest scores highest on scalability because VIX futures have deep liquidity. You can run this at $20k or $20M without materially impacting execution.
Gamma Scalping has the worst time commitment because continuous delta-hedging requires intraday attention. The math is straightforward — you’re betting realized vol exceeds implied vol — but the execution is labor-intensive.
Event Catalyst and Earnings Sniper are the most capital-efficient for small accounts. You can run meaningful positions with $1-5k, which isn’t true for strategies requiring portfolio margin or futures approval.
Dispersion requires the most capital ($50k+) because you’re simultaneously short index straddles and long single-stock straddles. The margin requirements add up.
The Risk/Return Picture
Plotting expected return against expected volatility shows how these strategies differ from traditional approaches.
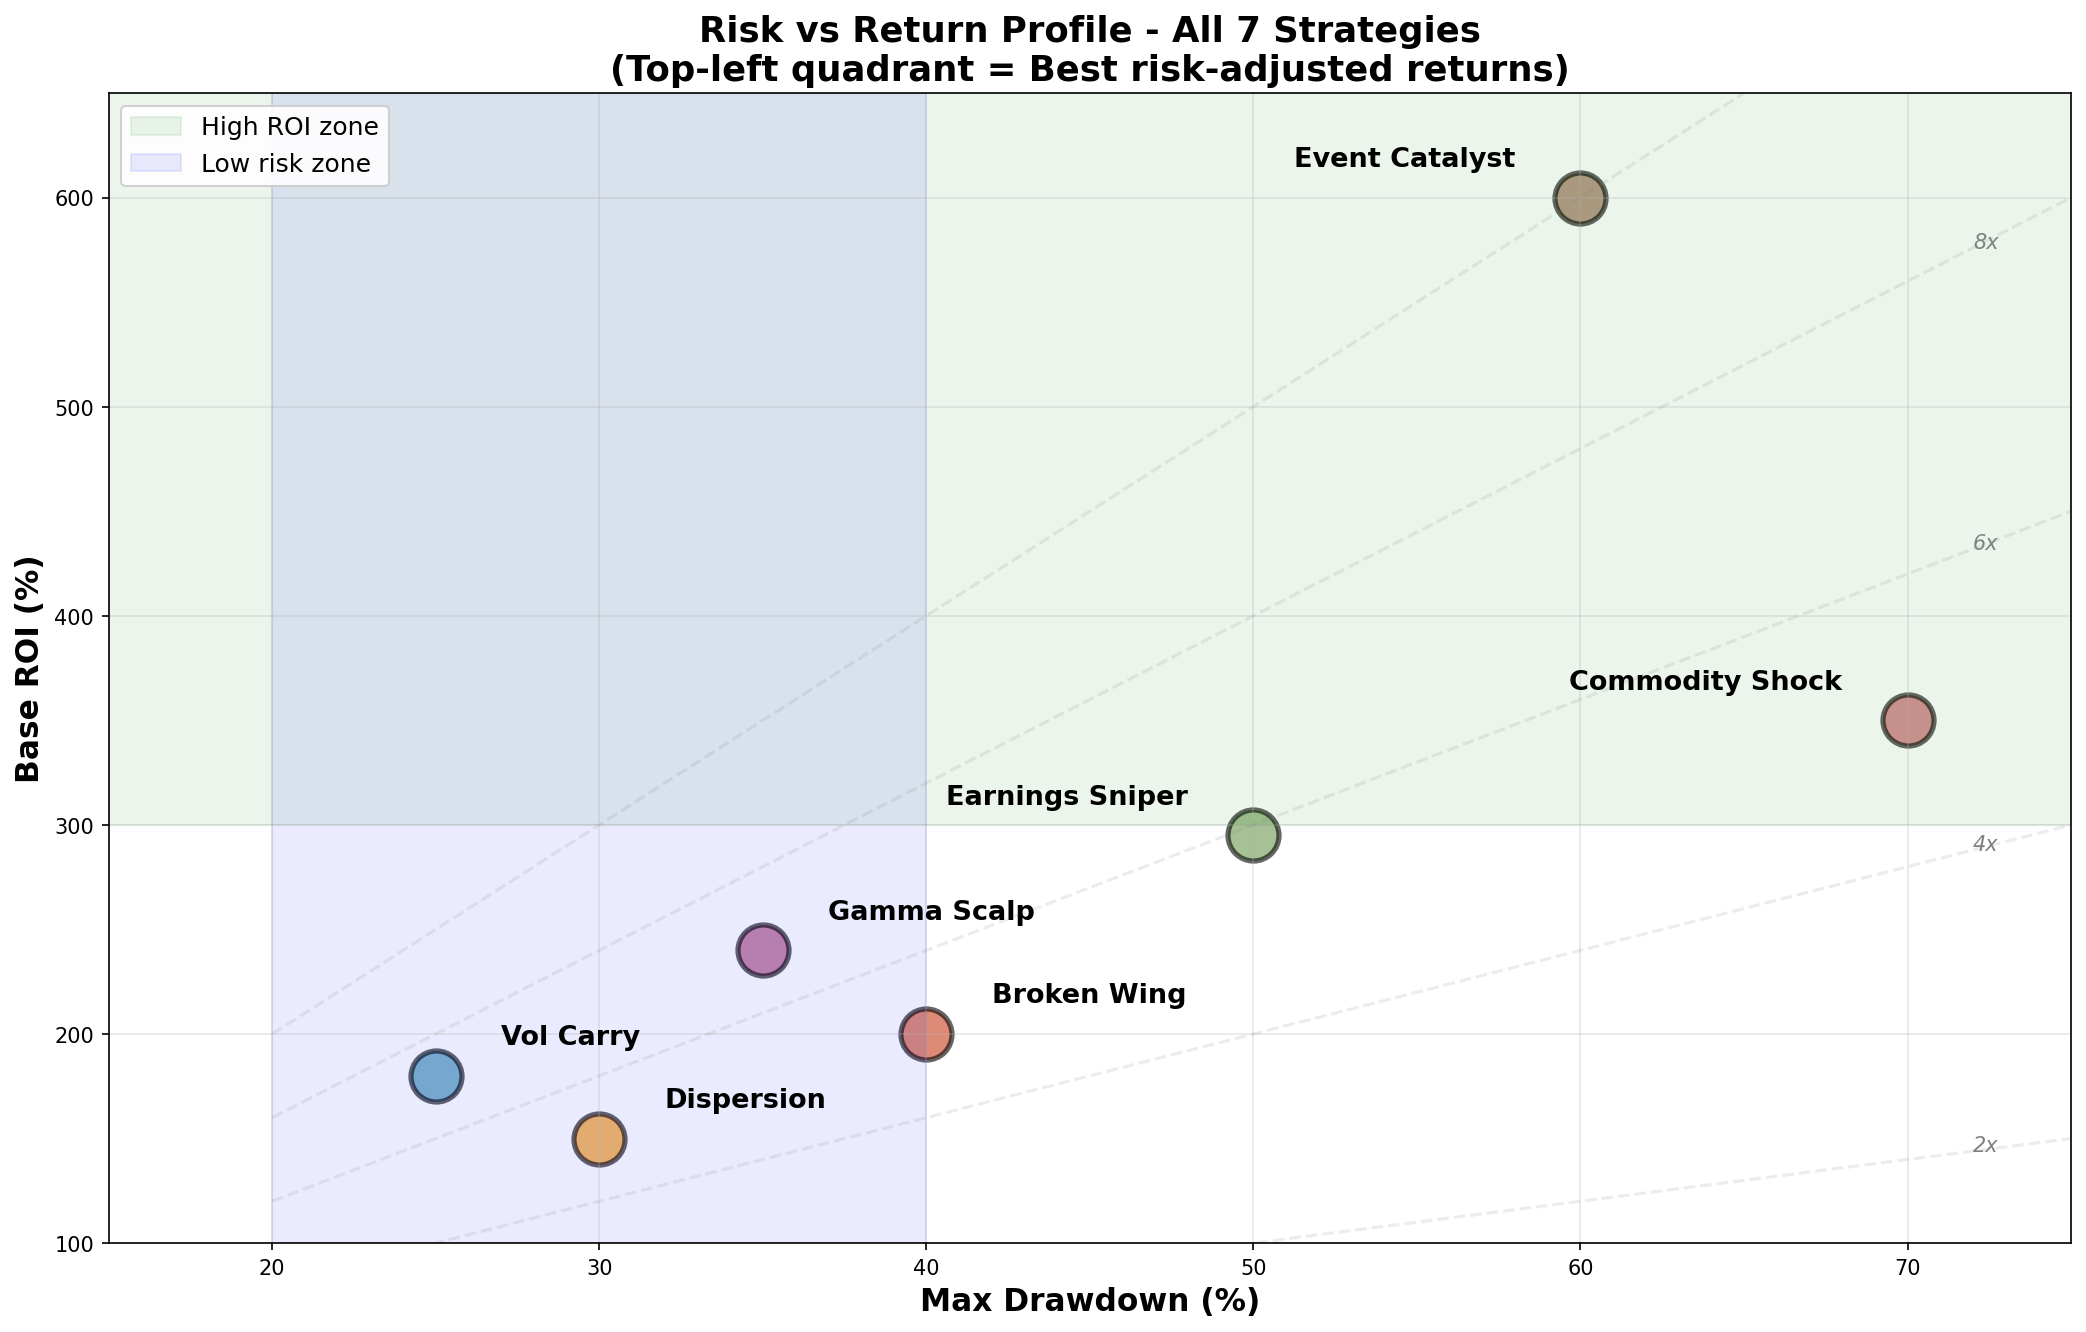
The commodity and event strategies sit in the upper-right quadrant: high expected return, high expected volatility. Vol Carry is more balanced — decent returns with lower volatility, which makes sense given the 87% win rate.
The key insight is that these strategies don’t optimize for the efficient frontier. A risk-adjusted purist would argue you should lever up Vol Carry to match the return of Commodity Shock at lower volatility. That’s technically correct, but leverage introduces its own risks (margin calls, forced liquidation), and the whole point of asymmetric strategies is capturing convexity you can’t replicate with leverage.
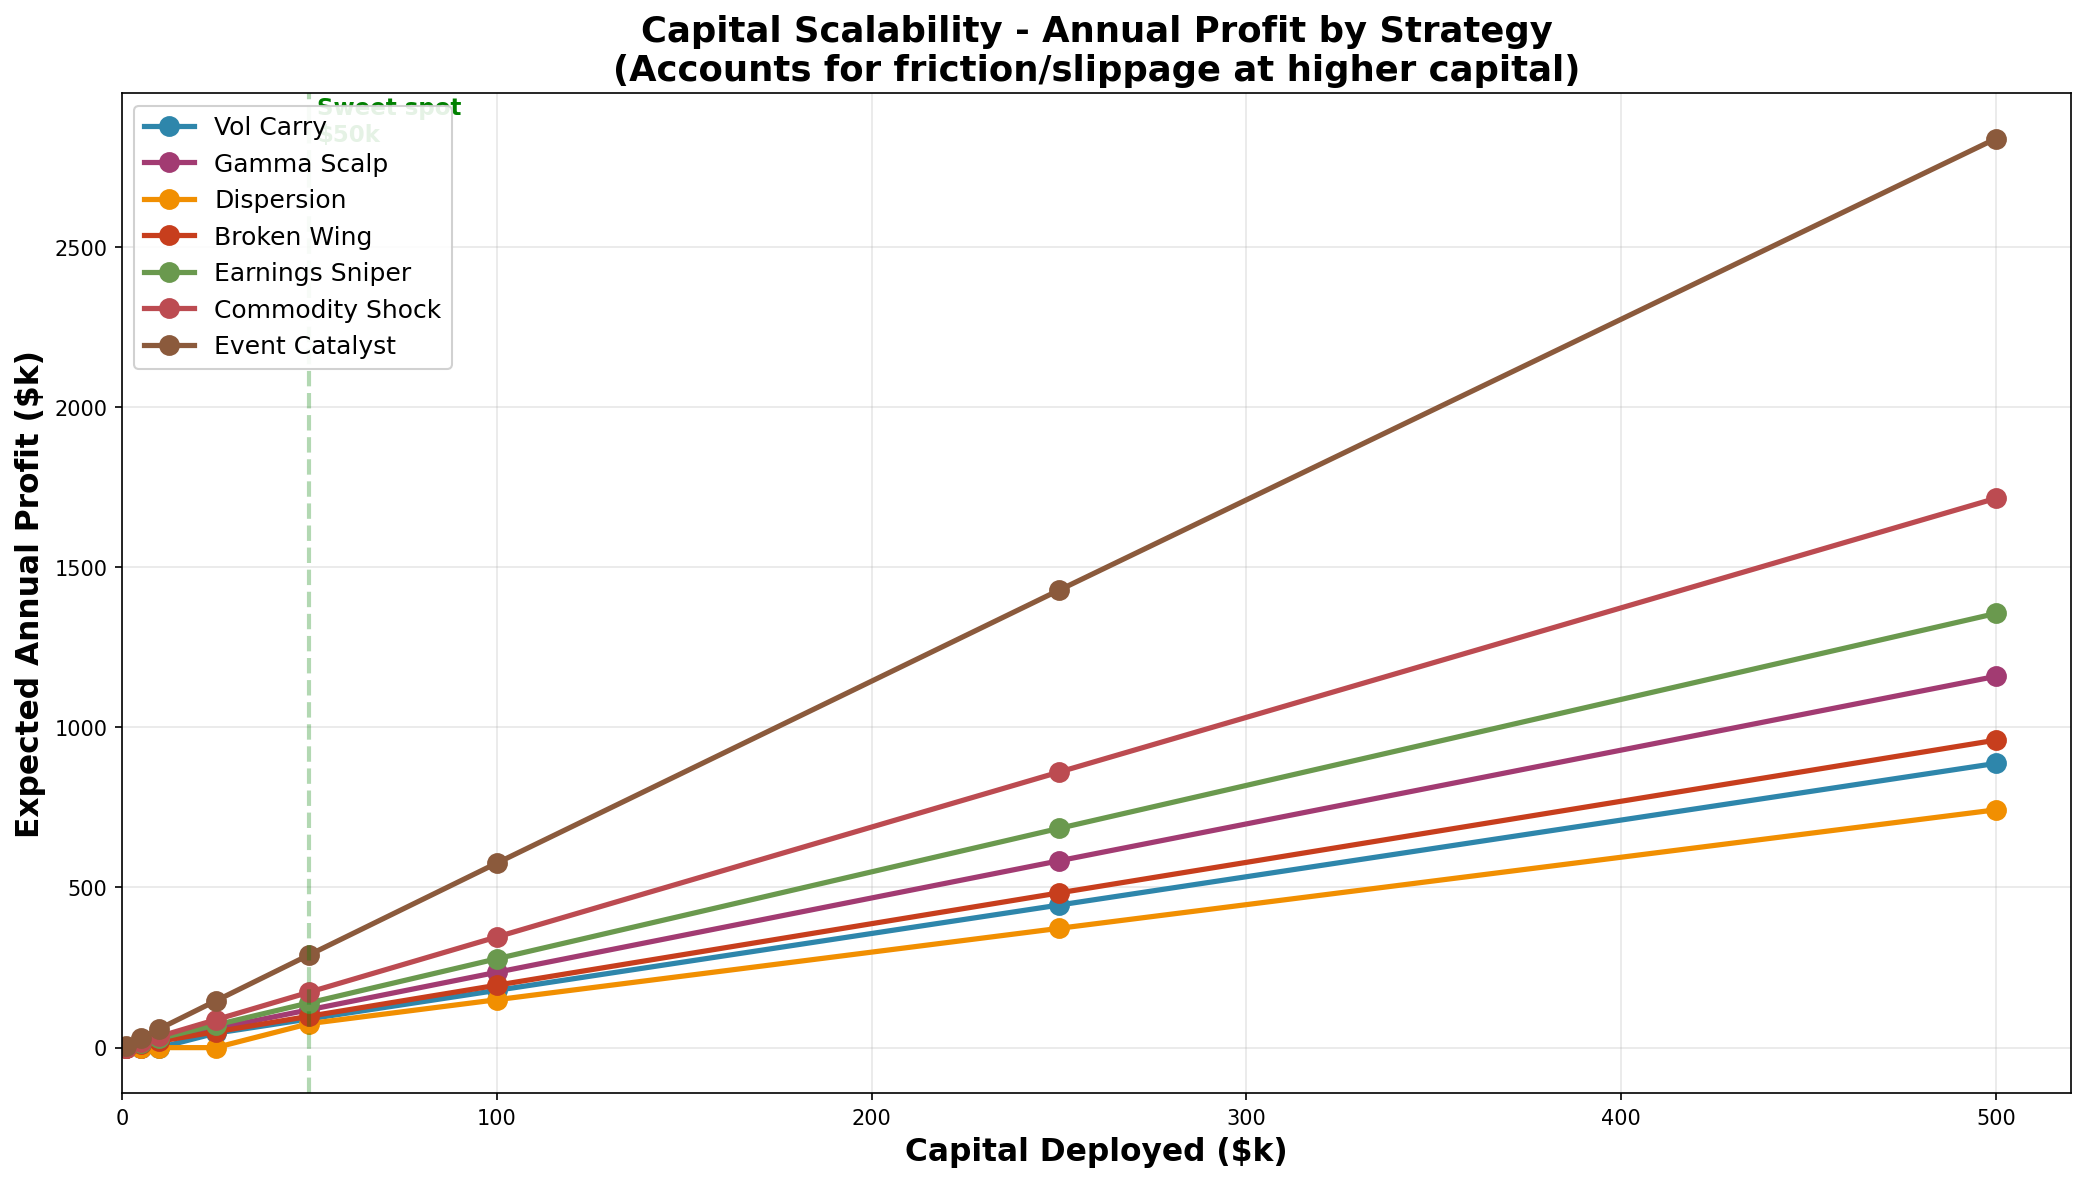
Capital Allocation by Portfolio Size
The right strategy mix depends on your capital. Smaller accounts need strategies with low minimums and high capital efficiency. Larger accounts can diversify across all seven.
Here’s the suggested progression:
Capital       Primary Strategies           Allocation
──────────────────────────────────────────────────────────
$1k-5k        Earnings Sniper              50%
              Event Catalyst               30%
              Commodity Shock              20%

$5k-10k       Broken Wing Butterfly        30%
              Earnings + Events            40%
              Commodity Shock              20%
              Vol Carry (small)            10%

$10k-50k      Earnings + Events            30%
              Broken Wing                  25%
              Gamma Scalping               20%
              Commodity Shock              15%
              Vol Carry                    10%

$50k-100k     Vol Carry                    25%
              Gamma Scalping               20%
              Dispersion                   15%
              Broken Wing                  15%
              Earnings/Events              15%
              Commodity Shock              10%

$100k+        All 7 strategies             (see chart)
The logic: start with high-capital-efficiency strategies (Earnings, Events, Commodity) while building capital, then add the income-generating strategies (Vol Carry, Broken Wing) as your account grows, and finally add Dispersion and scale Gamma Scalping when you have the capital and time.
ROI Comparison
Laying out all seven strategies by ROI target shows the range of outcomes we’re aiming for.
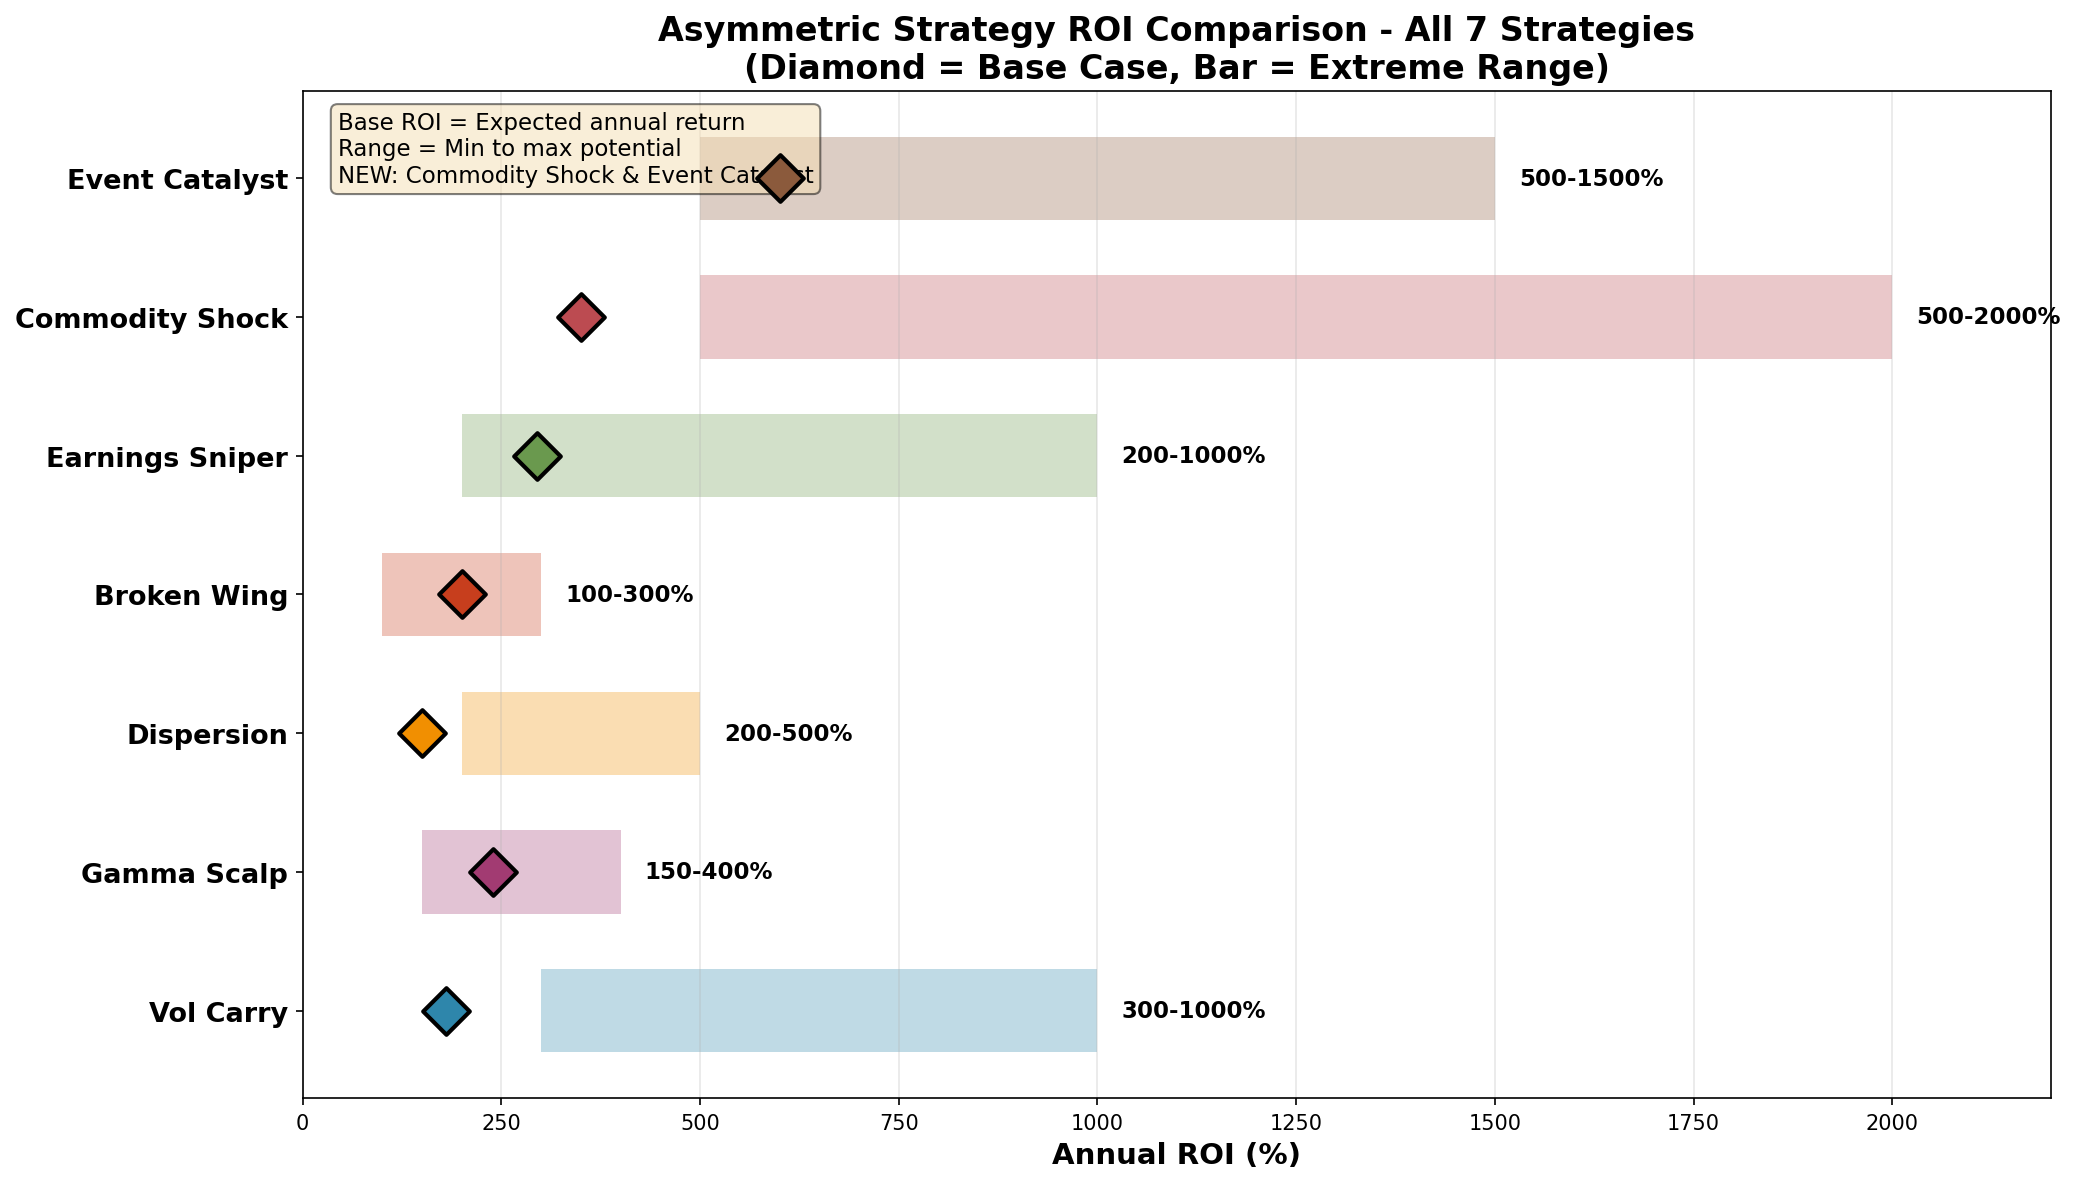
The spread between Dispersion (150%) and Event Catalyst (600%) is 4x. That gap exists because Event Catalyst takes binary risk on FDA approvals, litigation outcomes, and M&A announcements — events where the outcome is genuinely uncertain and the market underprices the tails.
Dispersion is more systematic: you’re harvesting the spread between index implied vol and single-stock implied vol, which exists because index options buyers drive up index IV while single-stock vol is more fairly priced. The edge is smaller but more reliable.
Quick Strategy Summaries
1. Volatility Carry Harvest
Sell near-term VIX products, buy far-dated tail protection. The VIX term structure is usually in contango (near-term cheaper than far-term), so you collect carry while staying protected against crashes.
The math during normal conditions: +$50-80/day in carry from short positions, minus the bleed on your long puts. During crashes, the long puts can pay 10-20x while the shorts lose moderately.
Entry signals: VIX term structure in contango, VIX percentile below 50, SPY above 50-day MA.
2. Gamma Scalping Machine
Buy long-dated ATM straddles when realized vol exceeds implied vol. Delta-hedge continuously to capture gamma profits.
Gamma profit = 0.5 × Gamma × (Stock move)²
Theta loss = Theta × Time
Net P&L = Gamma profit - Theta loss
This works in choppy, range-bound markets where the stock whipsaws enough to offset theta decay. It fails in trending markets where gamma doesn’t accumulate.
3. Dispersion Bomb
Short index vol, long single-stock vol. When correlation breaks down (sectors rotate, stocks diverge), index vol drops faster than single-stock vol.
Entry when: implied correlation above 0.75, dispersion percentile below 50, ahead of earnings season.
4. Broken Wing Butterfly
Asymmetric butterflies where one wing is shifted further OTM. You get a cheap entry, defined max loss, and 5-8x payoff if the stock pins near your short strike.
Deploy 15-20 positions simultaneously in range-bound stocks. Target 80% winners at $1,500 avg profit, 20% losers at $300 avg loss.
5. Earnings Volatility Sniper
Sell expensive weekly options before earnings (IV at 90%+), buy cheaper monthly options (IV at 45%). Post-earnings IV crush destroys the short position while the long retains most of its value.
Entry 1-3 days before earnings. Exit morning after.
6. Commodity Shock Convexity
Far OTM calls on shock-prone commodities (oil, natural gas, wheat, copper). Most expire worthless, but supply disruptions can produce 20-50x returns.
This is pure tail-event hunting. Win rate is 20%, but the winners are catastrophically large. You’re betting on geopolitical events, weather disasters, and infrastructure failures.
7. Multi-Catalyst Event Options
Binary events: FDA approvals, M&A announcements, litigation outcomes. Deploy across 40-50 events per quarter, sized at 1-2% each.
Research-intensive. You need to understand the probability distributions — what’s the real chance of FDA approval, and how does that compare to the implied probability in option prices?
The Usual Caveats
These strategies look good on paper. They haven’t been tested against real execution, slippage, and the specific market regimes of the past decade.
The return assumptions deserve scrutiny:
Win rates are theoretical. The 87% win rate for Vol Carry assumes you exit before VIX spikes and roll positions at optimal timing. Real win rates are lower.
ROI targets assume optimal sizing. The 300%+ returns require aggressive position sizing that most people won’t maintain through drawdowns.
Tail events cut both ways. Commodity Shock betting on supply disruptions is great until you’re short vol during a flash crash that wipes out your long puts.
Correlation assumptions break during stress. Dispersion works when correlations drop. During genuine market stress, correlations spike to 1.0 and everything moves together — exactly when you don’t want to be short index vol.
The expected value math suggests these strategies work. The question is whether the implementation details destroy the edge, like they’ve done with approximately half the strategies I’ve tested in this series.
Remember: Alpha is never guaranteed. And the backtest is a liar until proven otherwise.
Options and derivatives are complex instruments and not suitable for all investors. This analysis probably contains errors — if you find them, let me know.
The material presented in Math & Markets is for informational purposes only. It does not constitute investment or financial advice.