
Detecting Volatility Regimes: Floor, Compression, Breakout, Panic, Decay (and What a Scaled Quant Stack Could Do Better)
Part 9 below talks about volatility regimes and how I use them

This is part 9 of my series — Building & Scaling Algorithmic Trading Strategies
Let’s talk volatility! Everyone’s favorite topic.
One of the themes that keeps coming up in this project is the idea that volatility isn’t just a number — it’s a state machine. So how do I really go about handling it?
Markets cycle through recognizable volatility phases, each with different microstructure, liquidity, flows, and risk appetite.
If you can label those states, you can decide:
how big the allocator should be,
when the volatility sleeve should matter,
when to stand down, and
when to lean in.
I’m not doing anything exotic yet — no Kalman filters, no hidden Markov models, no intraday realized volatility surfaces.
But even with simple tools, you can pull useful signals out of the morass.
This post lays out the volatility regime map I’m using and how those tags influence the system. I’ll also talk about what’s possible with a professional quant infrastructure, and where my setup hits its current limits.
1. The Volatility Regime Map
(Floor → Compression → Breakout → Panic → Decay)
Volatility doesn’t move randomly. It clusters, compresses, and transitions — often in the same order.
So I wanted to think about volatility through the lens of a “lifecycle”.
A. Volatility Floor
Vol is abnormally low, stable, and mean-reverting downward.
Characteristics
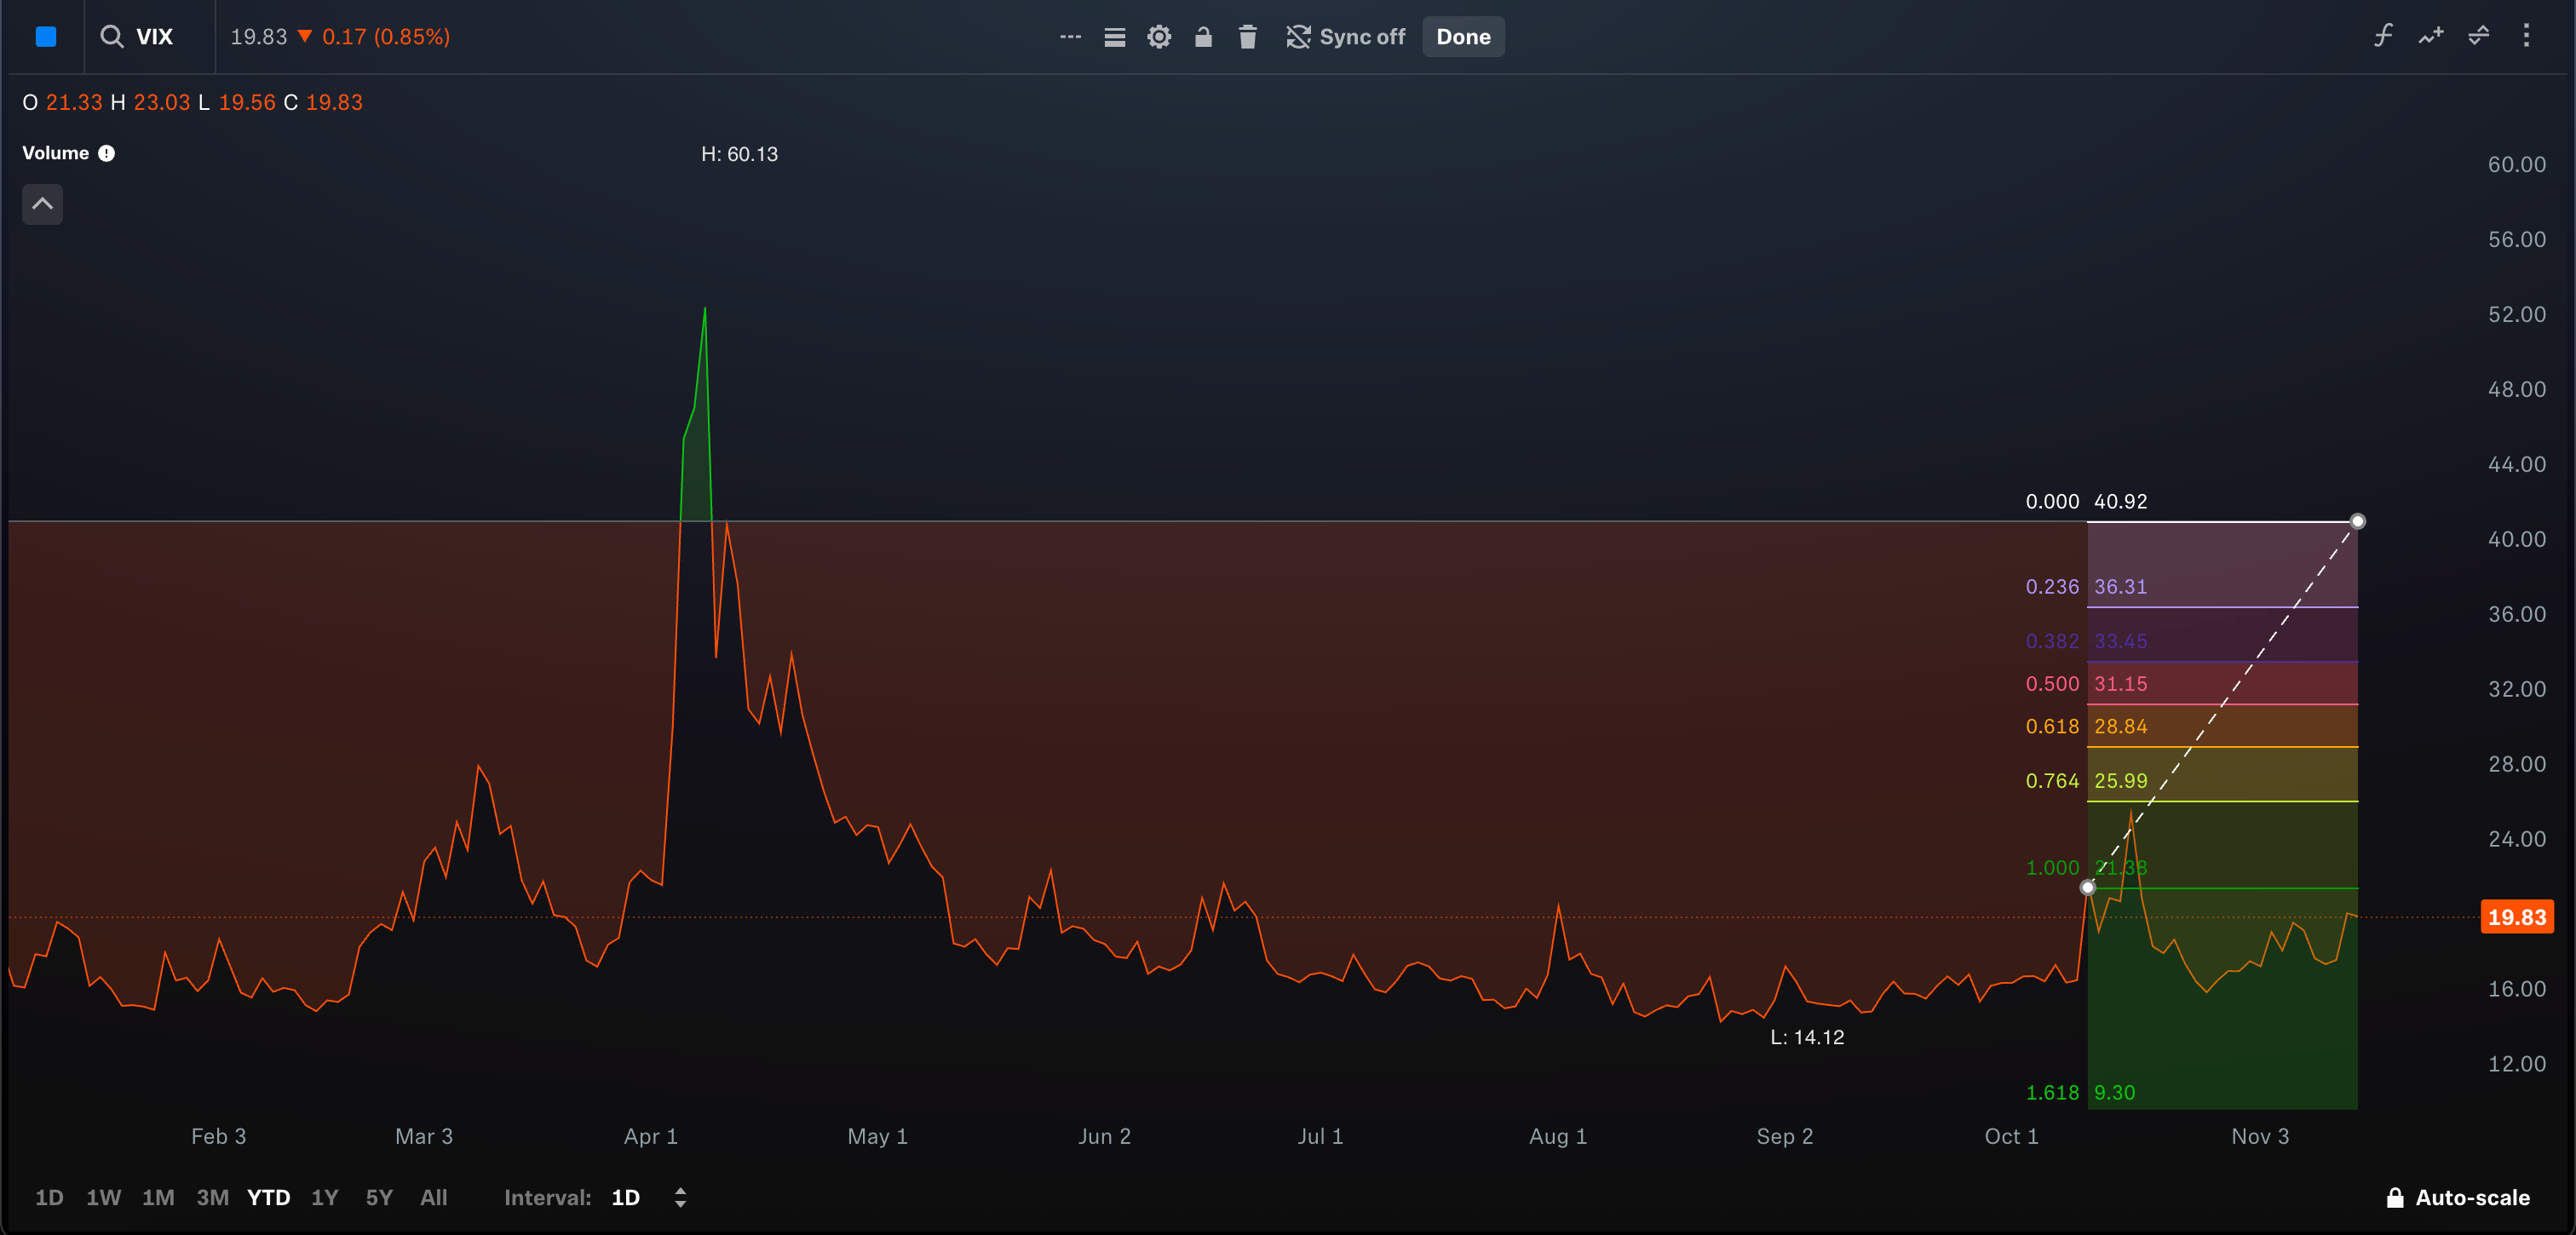
VIX < long-term trend
realized vol decaying
tight intraday ranges
options skew flattening
liquidity deep, spreads tight
Risk appetite: high
Allocator: can size up
Vol sleeve: expect bleed, size small
Market behavior: slow-grind rallies, sharp but short dips
This is when the long–short allocator makes most of its steady gains.
B. Volatility Compression
Vol stops falling but hasn’t risen yet — everything is coiling.
Characteristics
realized vol at multi-week lows
implied vol stops dropping
intraday ranges start widening slightly
futures term structure flattens
dispersion picks up
Risk appetite: cautious
Allocator: maintain size but watch for velocity decay
Vol sleeve: still bleeds, but coiling signals can precede convex runs
Compression phases often precede the big moves — up or down.
C. Volatility Breakout
Vol expands above a threshold and keeps expanding.
Characteristics
realized jumps
implied lifts first at the front-end
VIX futures roll yield collapses
liquidity at the bid/ask thins
correlations spike
Risk appetite: declining
Allocator: reduce gross exposure or tighten leverage tier
Vol sleeve: can size slightly up if the burst looks persistent
Market behavior: directional moves with force (trend days)
This is usually where trend + vol combine well.
D. Volatility Panic
True volatility regime shift. This is where things break.
Characteristics
VIX term structure inverts
realized vol explodes
multi-sigma intraday ranges
options skew steepens massively
systematic flows forced to de-risk
liquidity evaporates
Risk appetite: collapse
Allocator: go defensive or flat
Vol sleeve: potential home run, but path becomes chaotic
Market behavior: gaps, forced liquidations, sentiment cascades
This is the “don’t be cute” regime — you survive it, not trade it.
E. Volatility Decay
Vol spikes settle, order returns, and the system re-stabilizes.
Characteristics
vol mean reverts lower
risk premia re-open
dispersion increases
systematic flows begin re-levering
skew normalizes
Risk appetite: recovering
Allocator: can scale back in gradually
Vol sleeve: give back some gains here
Market behavior: sloppy rallies and wider ranges
Decay is where trend signals reset and volatility trades unwind.
2. How These Regimes Influence My Sleeves
Allocator (long–short engine)
Floor: full sizing, trend/velocity strong
Compression: watch MA spreads, tighten stops, reduce leverage slightly
Breakout: reactive trimming (vol up = size down)
Panic: flatten or minimal exposure
Decay: re-enter slowly as trend resets
The allocator hates volatility surprises.
Volatility Sleeve
Floor: small exposure (bleed regime)
Compression: wait — no premature sizing
Breakout: sleeve begins to show life
Panic: sleeve can explode upward but path is messy
Decay: sleeve often gives back — do not size up
The vol sleeve loves the transitions, not the destinations.
Combined Book
Floor → allocator dominates
Breakout → both contribute
Panic → vol sleeve shines if sized properly
Decay → allocator recovers
Compression → uncertainty; do nothing fancy
This regime logic is more important than any single indicator.
3. What I Can Do Right Now (Simple but Effective)
Because this is a one-person stack running on Python, CSVs, and nightly runs, I’m keeping regime detection simple and transparent.
Inputs I use today
20-day vs 60-day realized vol ratio
VIX front-month vs 3rd month
Implied vs realized vol spread
ATR bands
MA compression (50/100/250)
Simple clustering on vol-of-vol
Advantages
Easy to compute
Zero black boxes
Near-zero latency needs
Robust and interpretable
Limitations
No intraday realized vol
No options-surface modeling
No regime inference via HMM/HSMM
No flow-of-funds integration (CTA, volatility targeters)
No cross-asset implied vol cross-checks
No model that adapts mid-day
This keeps me honest — I’m doing only the parts that improve stability without over-complicating live operations.
4. What a Scaled Quant Infrastructure Could Do
A scaled quant shop would treat volatility regime detection as a research domain, not a feature.
With infrastructure, you could incorporate:
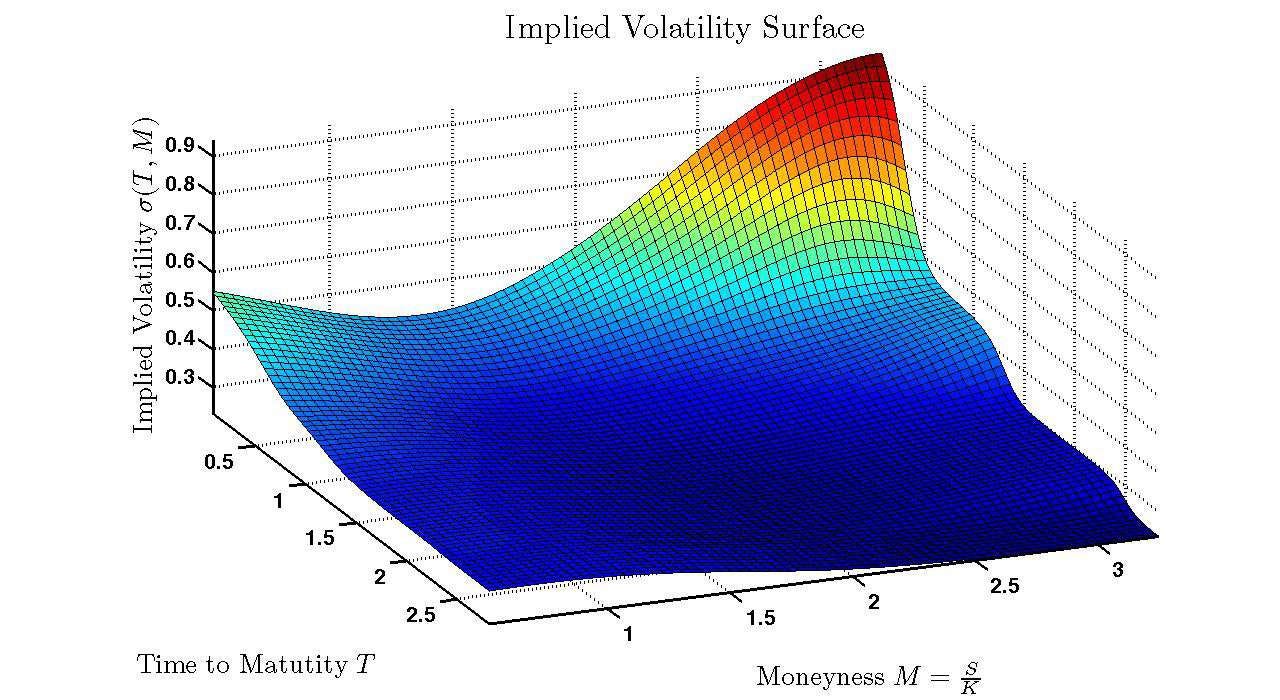
A. Full volatility surface modeling
fit SVJ, SABR, Heston parameters intra-day
detect skew and curvature shifts
derive structural regime probabilities
B. High-frequency realized volatility
1-min, 5-min subsampling
microstructure-aware estimators (HARC, RVOL, bipower)
detect volatility-of-volatility expansions before they hit EOD stats
C. Cross-asset volatility
Treasury volatility (MOVE)
FX implied vol indexes
commodity vol (OVX, GVZ)
vol-risk-premium across markets
The best signals come from cross-asset shock correlation, not just equity vol.
D. Machine learning for regime inference
hidden Markov models (HMM)
hierarchical state-space models
Bayesian filters
clustering on correlation matrices
autoencoders on options smiles
This is how institutions detect regime transitions earlier than everyone else.
E. Systematic flow modeling
CTA positioning
vol-targeting flows
dealer gamma exposure
systematic re-leveraging mechanics
These flows drive vol regimes more than fundamentals.
5. My Approach: Stay Simple, Avoid Overfitting, Use Regimes Sparingly
For now, I’m using regime tags as context, not instructions.
They help me decide:
whether the allocator should be at full size
whether the volatility sleeve should stay small
how much to trust short-term velocity
when to flatten vs. trade through noise
I’m not hard-switching strategies based on regime labels — mostly using them to avoid the big mistakes.
As the system matures, regimes will guide:
how much capital each sleeve gets,
how often the allocator rebalances,
and how aggressively I allow the system to take convexity.
Not by micromanaging but by keeping the system out of environments where it shouldn’t be aggressive.
6. Closing
Volatility regimes matter because different strategies respond to volatility in fundamentally different ways. The allocator loves floors and hates panics.
The vol sleeve loves breakouts and gets sloppy in decay. But truthfully, neither should be sized the same way across all phases.
For now, my goal is simple: Use regimes as a lens, not a lever.
As I scale up the infrastructure — with better intraday vol estimates, cross-asset implied metrics, HMM tagging, and structural flow data — the regime engine will evolve from a handcrafted classifier into something closer to what real quant shops use.
But the logic will stay the same:
Before you size anything, you must know what regime you’re in —
and what type of strategy you’re sizing.
This ties back to the strategy-classification framework.
Next, I’ll write about how I plan to integrate cross-asset volatility and rate-macro stress indicators into the allocator so the system becomes truly multi-dimensional.
The information presented in Math & Markets is not investment or financial advice and should not be construed as such.
Thanks for writing this, it clarifies a lot; thinking about volatility as a lifecycle makes so much sense, it's way more intutive than just a plain number. It kinda makes you wonder how much more predictive power you'd unlock once you layer in some proper ML models to detect those transitions dynamically, especially with all the unstructured data floating around.