
Deconstructing Buffett: The Trading Mechanics of Berkshire Hathaway
Part 55 — What AQR’s Factor Research Tells Us About Replicating the Oracle of Omaha

This is part 55 of my series — Building & Scaling Algorithmic Trading Strategies
Warren Buffett officially retired as Berkshire Hathaway’s CEO yesterday — December 31, 2025 — ending a 60-year run that turned a failing textile mill into a $1 trillion conglomerate. The timing feels right to ask the question: Can Buffett’s performance be explained, quantified, and replicated?
The short answer: Yes, mostly. The longer answer involves leverage, insurance float, factor exposures, and some uncomfortable truths about what retail investors can and can’t do.
This post isn’t about whether Buffett is a genius (he obviously is). It’s about whether his mechanics can be understood well enough to inform algorithmic strategies. The answer is yes, they can be, but with significant caveats.
(Yes, these are my tags from my first Berkshire Hathaway Annual Shareholders Meeting…)
The Empirical Record
Let’s start with what we actually know. The seminal research here is Frazzini, Kabiller, and Pedersen’s “Buffett’s Alpha” (2018), published in the Financial Analysts Journal after circulating as an NBER working paper since 2013. These aren’t random bloggers — Frazzini and Pedersen are AQR researchers who literally invented the factors we’ll discuss.
Berkshire Hathaway Performance (1976–2017):
Metric                      Berkshire Hathaway    S&P 500 Market
--------------------------  --------------------  --------------
Excess Return (annualized)  18.6%                 7.5%
Volatility                  23.5%                 15.3%
Sharpe Ratio                0.79                  0.49
Market Beta                 0.69                  1.00
Information Ratio           0.64                  —
What this means:
Buffett’s Sharpe ratio of 0.79 is higher than any stock or mutual fund with a history exceeding 30 years. That’s not cherry-picking — that’s the entire universe of comparable investments.
The low beta (0.69) is important: Berkshire doesn’t just ride the market. It delivers excess returns while taking less market risk than average.
The 18.6% excess return over T-bills, sustained for 40+ years, compounds to staggering wealth. A dollar invested in 1976 became $1,500+ by 2011.
If you could travel back to 1976 and pick one stock, Berkshire would be your pick. No other security comes close on risk-adjusted terms.
Sharpe Ratio Across Regimes: The Decay of Outperformance
The aggregate Sharpe ratio of 0.79 obscures significant variation across time periods. Understanding this variation is critical for anyone thinking about what Berkshire returns might look like going forward under Greg Abel.
Performance by Decade:
Period    BRK Ann. Return   S&P 500 Return   BRK Value-Add   Est. Sharpe
-------   ----------------  --------------   -------------   -----------
1976-1985   ~32%             ~14%              +18%/yr         ~1.1-1.3
1986-1995   ~29%             ~15%              +14%/yr         ~0.9-1.0
1996-2005   ~11%             ~10%              +1%/yr          ~0.4-0.5
2006-2017   ~10%             ~8%               +2%/yr          ~0.4-0.5
2018-2025   ~12%             ~13%              -1%/yr          ~0.3-0.4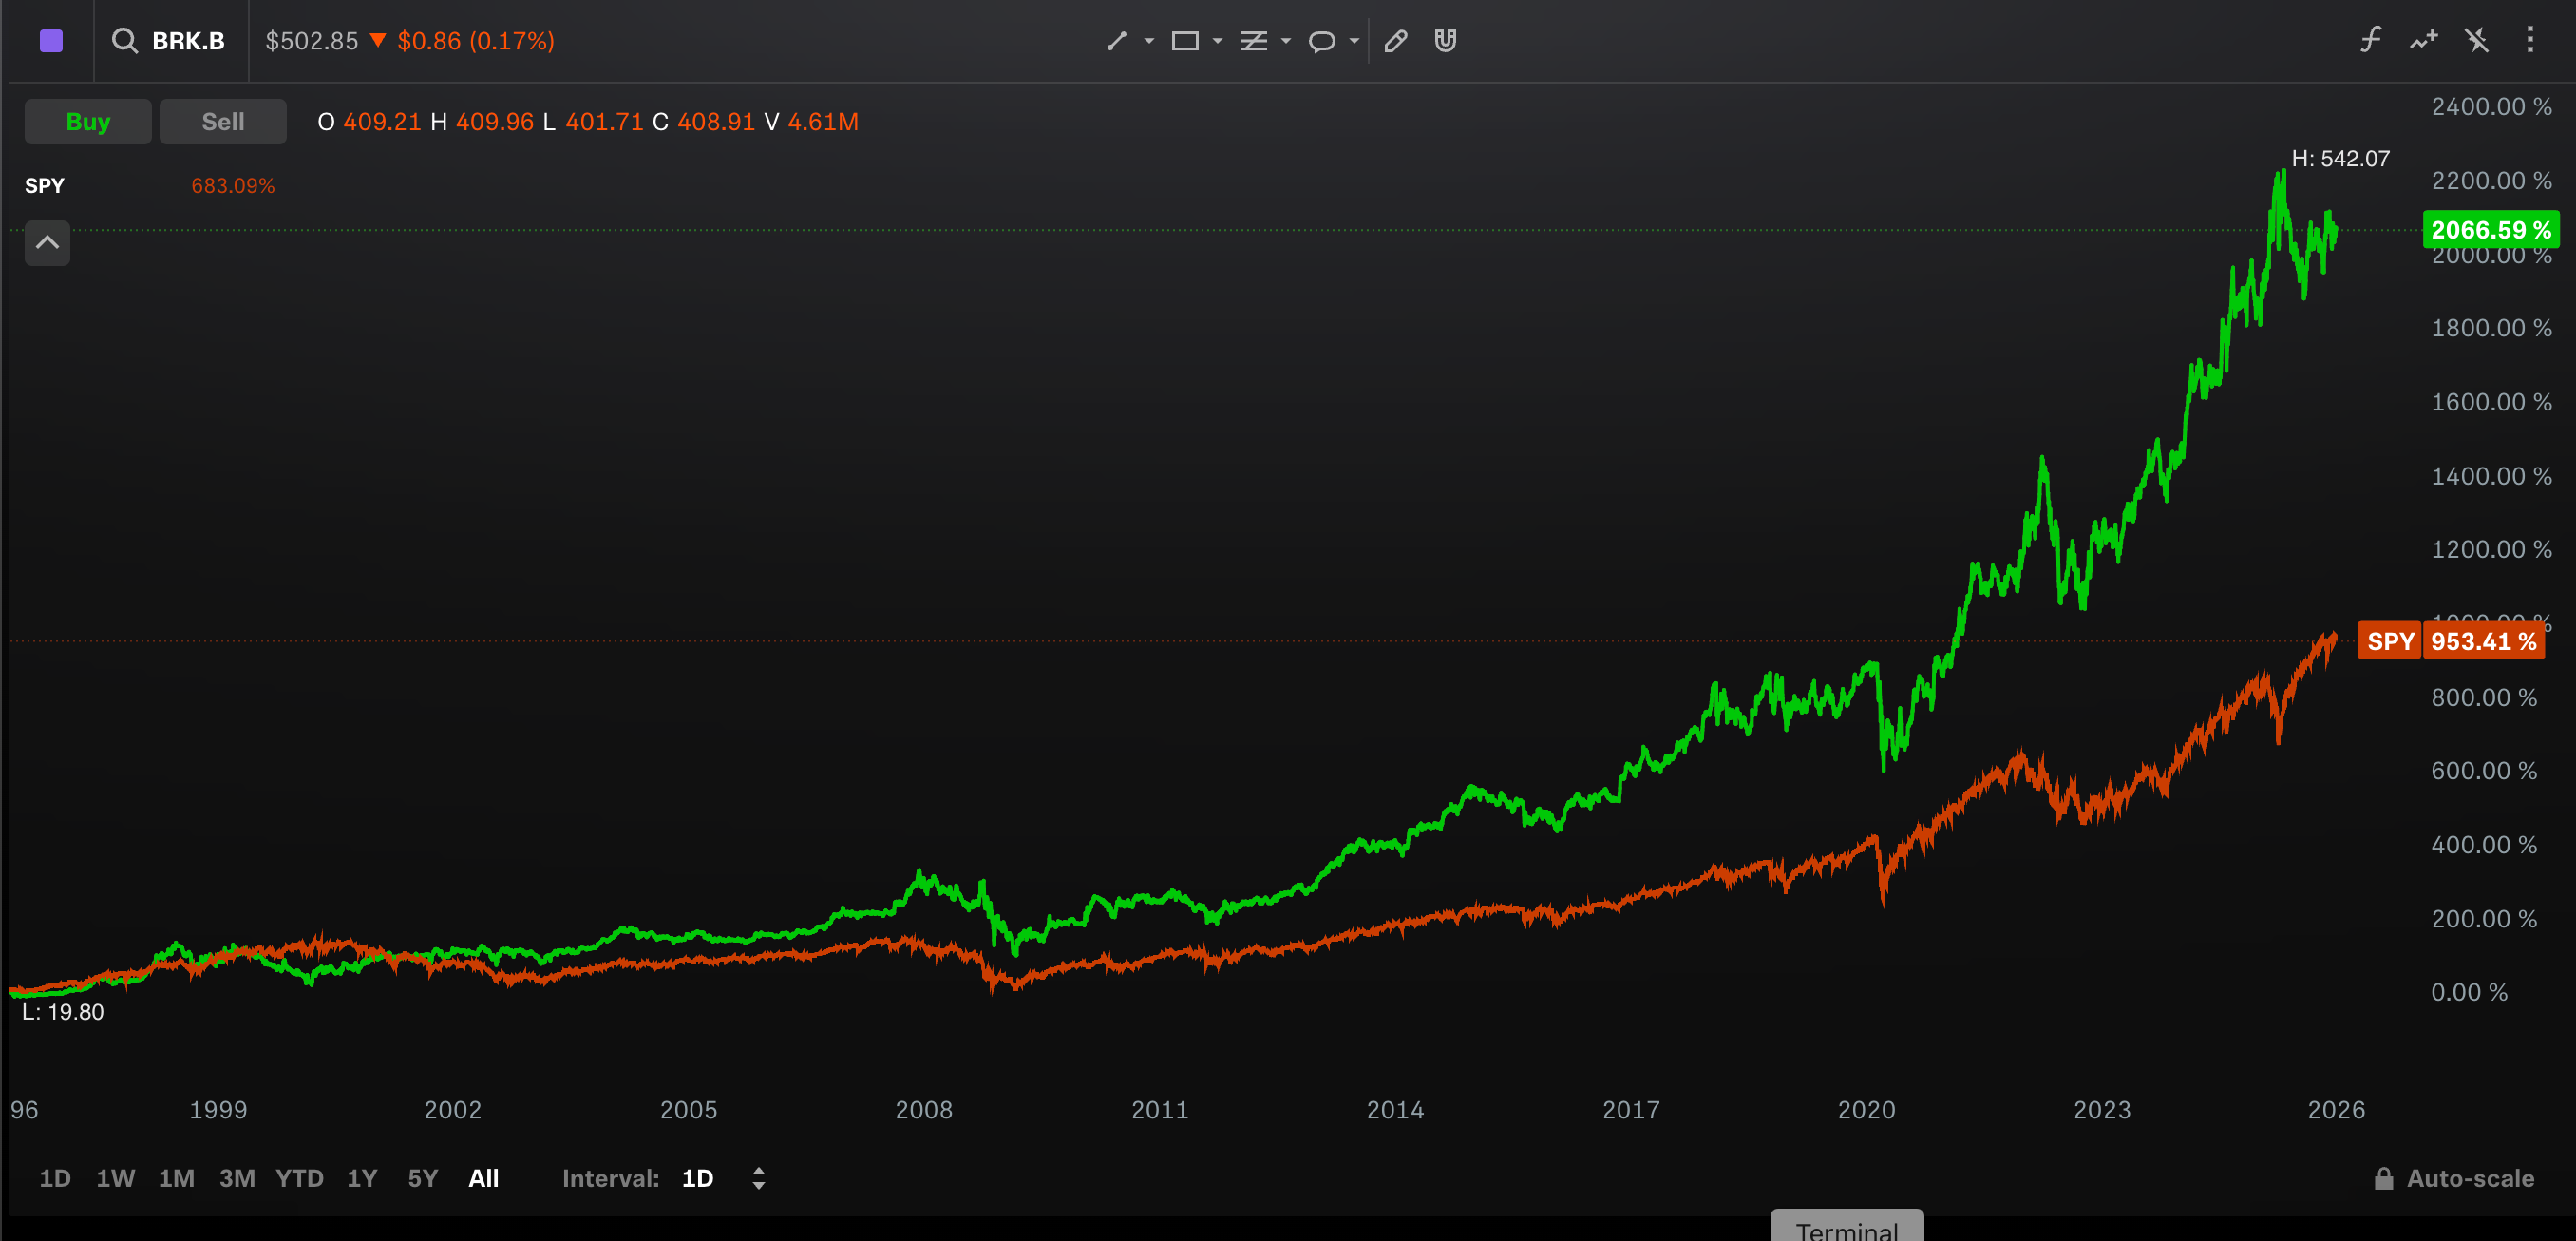
The Pattern:
The data tells an uncomfortable story: Buffett’s alpha decayed steadily over time. The cumulative annualized value-add was:
End of 1970s: +19.7% per annum
End of 1980s: +20.4% per annum
End of 1990s: +15.1% per annum
End of 2000s: +13.1% per annum
End of 2010s: +10.5% per annum
End of 2025: ~+10% per annum
Since approximately 2002, rolling 10-year value-add has been essentially zero. Berkshire returned ~650% from 2002-2022; so did the S&P 500 Total Return Index.
Why the Decay?
Size constraints: In 1980, Berkshire’s market cap was $420 million — a double meant $420 million of gain. Today at $1 trillion+, that same return requires $1 trillion of gain. The opportunity set for needle-moving investments shrinks dramatically.
Factor crowding: The factors Buffett exploited (quality, value, low-beta) are now well-documented. Thousands of funds and ETFs pursue similar strategies, compressing premiums.
Market efficiency improvement: Information asymmetries that Buffett exploited in 1970s are harder to find. The “GEICO is undervalued” trade worked when almost nobody was analyzing insurance companies carefully.
The dot-com exception: Buffett lagged badly in 1998-2000 (down 44% while S&P gained 32%) by avoiding tech. He was vindicated when the bubble burst, but this obscures that his value-add in the 1990s was concentrated in the crash aftermath, not the preceding years.
Performance in Bear Markets:
Here’s where Berkshire shines even in the modern era:
Bear Market            S&P 500 Drawdown   BRK Relative Performance
---------------------  ----------------   --------------------------------
2000-2002 (Dot-com)    -49%               BRK +10% (outperformed by 59%)
2007-2009 (GFC)        -57%               BRK -51% (slight outperformance)
2020 (COVID)           -34%               BRK -24% (outperformed by 10%)
2022 (Rate Shock)      -25%               BRK +4% (outperformed by 29%)
Since 1980, Berkshire has beaten the S&P 500 during bear markets by a median of 14.89 percentage points and during recessions by 4.41 percentage points (per Bespoke Investment Group data).
The Regime Story:
Berkshire’s Sharpe ratio is highly regime-dependent:
Speculative bull markets (late 1990s, 2020-2021): Underperforms. Low-beta, quality stocks lag when investors chase lottery tickets.
Crises and bear markets: Outperforms. Cash hoards enable opportunistic buying; insurance float is cheap and stable; low-beta holdings fall less.
Steady growth environments: Roughly matches the market, with lower volatility.
For algorithmic traders, the implication is clear: a Buffett-style factor portfolio is essentially a bet on mean reversion and crisis protection. You’re sacrificing upside in speculative rallies for downside protection in crashes. Whether that’s a good trade depends on your risk preferences and time horizon.
Bonds vs. Equity: Buffett’s Opportunistic Capital Allocation
Buffett is universally known as the ultimate equity investor. But a closer look at Berkshire’s history reveals sophisticated opportunistic switching between stocks and bonds — a flexibility most investors lack and few discuss.
When Buffett Chose Bonds Over Stocks
1. The 2002 Junk Bond Raid
In 2002, as the dot-com bust created panic in credit markets, Berkshire quietly purchased approximately $8 billion in high-yield “junk” corporate bonds. As Buffett described in his 2003 shareholder letter:
“In 2002, junk bonds became very cheap, and we purchased about $8 billion of these. The pendulum swung quickly though, and this sector now looks decidedly unattractive to us. Yesterday’s weeds are today being priced as flowers.”
Charlie Munger elaborated at a shareholder meeting: Berkshire was buying bonds yielding 30-35%, which within 12 months were yielding only 6% as spreads normalized. The trade made billions — yet received almost no attention because Buffett’s public persona centers on stocks.
Notable 2002 bond investments included:
Finova Group (distressed finance company): Purchased 13% of $11 billion in debt at ~67 cents on the dollar, expecting bankruptcy but also expecting liquidation value to exceed cost
Amazon.com junk bonds: Buffett bought $98 million in 10% senior notes, likely netting 17-22% annualized returns when Amazon redeemed them early
Level 3 Communications: Part of a $500 million debt investment with Legg Mason and Longleaf Partners
Multiple telecom high-yield bonds at 30%+ yields
The lesson: When spreads blow out and equity outcomes become path-dependent, senior debt can offer equity-like returns with a margin of safety.
2. Harley-Davidson 2009: Choosing Seniority Over Equity Upside
In February 2009, during the depths of the financial crisis, Harley-Davidson needed cash to fund its financing arm. Berkshire committed $300 million in senior unsecured notes at 15% annual interest.
At the 2010 shareholder meeting, an investor asked Buffett why he chose debt over equity — especially since Harley-Davidson stock subsequently quadrupled, meaning equity would have returned $1 billion+ versus the ~$150 million profit on the debt.
Buffett’s response was characteristically honest:
“I knew enough to lend them money; I didn’t know enough to buy the equity... I was confident that a) Harley-Davidson was not going out of business, and that b) 15% was going to look pretty damned attractive.”
He added: “I kind of like a business where your customers tattoo your name on their chest. But figuring out the economic value of that... I’m not sure even going out and questioning those guys I’d learn much from them.”
This reveals a key principle: When equity outcomes are highly uncertain but survival is likely, senior debt with equity-like yields may be the smarter risk-adjusted play. Berkshire’s insurance liabilities are long-dated; locking in contractual 15% returns matches those liabilities better than binary equity bets.
In fact, I’d argue this has been a spectacular choice on Berkshire’s part when you look at $HOG’s stock performance.
3. Municipal Bond Accumulation (2008-2009)
Regulatory filings revealed Berkshire’s municipal bond holdings nearly doubled in nine months to $4.05 billion by March 2009, up from roughly $2 billion in mid-2008.
In his 2008 shareholder letter, Buffett marveled at the opportunity:
“The investment world has gone from underpricing risk to overpricing it. A few years ago, it would have seemed unthinkable that yields like today’s could have been obtained on good-grade municipal or corporate bonds...”
Berkshire’s insurance operations naturally need tax-advantaged income streams; munis fit perfectly. But Buffett was also making a tactical call: with equity valuations uncertain and credit spreads at extremes, high-grade municipals offered attractive risk-adjusted returns while he waited for better equity opportunities.
4. The Massive Treasury Bill Position (Ongoing)
As of June 2025, Berkshire holds $344 billion in Treasury bills — representing close to 5% of the entire T-bill market. This is larger than the Federal Reserve’s T-bill holdings.
Buffett’s explanation in the 2022 annual report: “Berkshire will always hold a boatload of cash and U.S. Treasury bills.”
Why T-bills specifically?
Safety: Full faith and credit of U.S. government, no credit risk
Liquidity: Can deploy within days when opportunities arise
No counterparty risk: Unlike money market funds, which involve repo facilities and bank exposure
Competitive yields: At 4-5% in the current rate environment, T-bills offer meaningful return while waiting
Optionality: Dry powder for the next crisis
The T-bill position reflects Buffett’s view that current equity valuations are stretched and better opportunities will emerge. The famous “Buffett Indicator” (total market cap / GDP) sits at ~208% — far above historical averages.
When Buffett Chose Equity Over Bonds
The Classic Long-Term Holdings
For companies with durable competitive advantages — Coca-Cola, American Express, Apple — Buffett deliberately chose common equity despite periodically attractive bond yields.
His reasoning, articulated repeatedly:
“Over long horizons, I expect a diversified portfolio of strong equities to outperform bonds.”
For Coca-Cola (held since 1988), bonds might have yielded 7-8% at purchase. But equity has compounded at 10%+ annualized with dividends reinvested, and Berkshire’s cost basis is now so low that the dividend yield on original investment exceeds 50% annually.
The Decision Framework:
Based on Berkshire’s historical behavior, Buffett’s equity vs. bond decision appears to follow this logic:
Favor bonds/senior securities when:
Credit spreads are at extreme wides (2002, 2009)
You can demand equity-like returns (15%+) in a senior position
Equity outcomes are highly path-dependent but survival is assured
You need safety and liquidity while waiting for better equity opportunities
Insurance liabilities require contractual cash flows
Favor equity when:
You can buy a durable business at a price implying high long-term compounding
The business has strong competitive moats that make earnings predictable
Current bond yields, even if temporarily competitive, are below expected equity returns over your holding period
You have conviction in management and capital allocation
Crisis-Era Hybrid Deals:
During the 2008-2009 crisis, Berkshire structured several deals that captured both debt-like safety and equity-like upside:
Deal                    Structure                          Returns
----------------------  ---------------------------------  ------------------
Goldman Sachs (2008)    $5B preferred at 10% + warrants    ~$3.7B profit
General Electric (2008) $3B preferred at 10% + warrants    ~$1.2B profit
Bank of America (2011)  $5B preferred at 6% + warrants     ~$12B profit
Dow Chemical (2009)     Preferred shares                   ~$500M profit
Mars/Wrigley (2008)     $6.5B subordinated debt            ~$680M+ in interest
These deals weren’t available to retail investors — they were negotiated directly with distressed companies who needed Berkshire’s capital and reputation. But they illustrate the principle: in crisis, you can often get equity-like economics with senior security protections.
For Retail Investors:
The bond vs. equity framework has practical applications:
Monitor credit spreads: When high-yield spreads exceed 800-1000 bps (as in 2002 and 2009), corporate bonds may offer better risk-adjusted returns than equities
T-bills as strategic asset: In high-rate environments with stretched equity valuations, short-term Treasuries aren’t “doing nothing” — they’re optionality
Quality of earnings matters: For companies with uncertain cash flows, senior debt may be smarter than equity even at lower expected returns
The Alpha Decomposition
Here’s where it gets interesting for quants. The researchers ran Berkshire’s returns through increasingly sophisticated factor models to see what explains the performance:
Stage 1: Traditional CAPM Regressing Berkshire against market returns leaves huge unexplained alpha. Buffett beats the market by a lot, even after adjusting for beta.
Stage 2: Fama-French Three-Factor (Market + Size + Value) Adding size (SMB) and value (HML) factors reduces but doesn’t eliminate the alpha. Buffett does tilt toward value stocks, but that’s not the whole story.
Stage 3: Carhart Four-Factor (+ Momentum) Adding momentum (UMD) barely moves the needle. Buffett doesn’t systematically chase momentum — his holding periods are famously long.
Stage 4: Six-Factor Model (+ BAB + QMJ) Adding two new factors — ”Betting Against Beta” (BAB) and “Quality Minus Junk” (QMJ) — makes the alpha statistically insignificant.
This is the key finding: Once you control for Buffett’s exposure to low-beta stocks and high-quality stocks, his outperformance is explained.
The factor loadings tell the story:
Berkshire Return = α + β₁(MKT) + β₂(SMB) + β₃(HML) + β₄(UMD) + β₅(BAB) + β₆(QMJ) + ε

Where:
- MKT (market): β₁ ≈ 0.69 (low market exposure)
- SMB (size): β₂ < 0 (prefers large-caps)
- HML (value): β₃ > 0 (value tilt)
- UMD (momentum): β₄ ≈ 0 (no momentum loading)
- BAB (betting against beta): β₅ > 0 (SIGNIFICANT)
- QMJ (quality minus junk): β₆ > 0 (SIGNIFICANT)
The BAB and QMJ loadings are what distinguish Buffett from a typical value investor. He’s not just buying cheap stocks — he’s buying cheap, safe, high-quality stocks.
What Are These Factors, Exactly?
Betting Against Beta (BAB)
The BAB factor, documented by Frazzini and Pedersen (2014) in the Journal of Financial Economics, exploits a well-known anomaly: low-beta stocks outperform high-beta stocks on a risk-adjusted basis.
This contradicts CAPM, which predicts higher beta = higher returns. In reality, the Security Market Line is too flat — high-beta stocks don’t deliver enough extra return to compensate for their extra risk.
Why does this happen?
Leverage constraints: Most investors (pension funds, mutual funds, individuals) can’t use leverage. If you want higher returns, you’re forced to buy higher-beta stocks instead of levering up low-beta stocks.
Lottery preferences: Retail investors overpay for high-beta stocks because they behave like lottery tickets — small chance of huge gains.
Benchmark pressure: Fund managers are evaluated against market benchmarks. Going underweight high-beta stocks feels risky even if it’s mathematically smart.
The BAB strategy: Go long leveraged low-beta stocks, short high-beta stocks. This has delivered significant risk-adjusted returns across global markets and asset classes.
Buffett implicitly runs a BAB strategy. His portfolio of “boring” insurance companies, utilities, and consumer staples all have below-market betas. By applying leverage (via insurance float), he amplifies returns from these low-volatility holdings.
Quality Minus Junk (QMJ)
The QMJ factor, from Asness, Frazzini, and Pedersen (2014), defines quality through four components:
Profitability: High margins, high ROE, high asset turnover
Growth: Stable and growing earnings
Safety: Low beta, low volatility, low leverage
Payout: High dividend yields, high buyback yields
High-quality stocks have all of these characteristics. Junk stocks have the opposite.
The puzzle: Quality stocks command higher prices than junk stocks — but not by enough. High-quality stocks consistently deliver higher risk-adjusted returns than their elevated valuations would suggest.
Why does this happen?
Mispricing: Investors don’t fully appreciate how persistent quality is. They treat quality improvement as mean-reverting when it’s actually sticky.
Risk preferences: Quality stocks are “defensive” — they outperform during crises and underperform during speculative rallies. Investors who want excitement avoid them.
Story stocks: Junk stocks often have compelling narratives (disruption! growth! transformation!). Quality stocks are boring.
Buffett explicitly targets quality. His famous line — ”Whether we’re talking about socks or stocks, I like buying quality merchandise when it is marked down”— is the QMJ strategy in plain English.
The Leverage Secret: Insurance Float
Factor exposures explain what Buffett buys. But they don’t explain how he amplifies returns. That’s where insurance float comes in.
What is float?
Insurance companies collect premiums upfront and pay claims later. The money sitting between collection and payout is “float” — it belongs to policyholders but can be invested by the insurer.
Berkshire’s float at end of 2024: $171 billion.
That’s $171 billion of essentially free leverage. Actually, better than free — because Berkshire’s insurance operations run at underwriting profits, they’re getting paid to hold this money.
Comparison to other leverage sources:
Leverage Source       Cost                   Call Risk              Duration
--------------------  ---------------------  ---------------------  ----------
Berkshire Float       ~0% (often negative)   Very low (<3%/year)    Perpetual
Margin Loans          ~7-8%                  High (margin calls)    Callable
PE/Hedge Fund Debt    7-15%                  Medium                 Fixed term
Corporate Bonds       5-8%                   Low                    Fixed term
Buffett’s leverage advantage isn’t that he uses leverage — it’s that his leverage is cheap, stable, and non-callable.
The math:
Frazzini et al. estimate Buffett’s average leverage at 1.6-to-1. For every $1 of equity, Berkshire controls $1.60 of assets.
This leverage amplifies returns from his factor-tilted portfolio:
Berkshire Return ≈ 1.6 × (BAB + QMJ + Value Premium) + Float IncomeA 10% return on the underlying portfolio becomes 16% with 1.6x leverage. Over 40 years, this compounds to an enormous difference.
Can You Replicate This?
The honest answer is: partially.
What You CAN Replicate
1. Factor Exposures
You can gain exposure to BAB and QMJ factors through:
ETFs: Invesco S&P 500 Quality ETF (SPHQ), iShares MSCI USA Quality Factor ETF (QUAL), Invesco S&P 500 Low Volatility ETF (SPLV)
Mutual funds: Dimensional, AQR, and Bridgeway offer factor-tilted funds
Direct factor strategies: AQR publishes updated BAB and QMJ factor data monthly at aqr.com
AQR’s research shows that a systematic “Buffett-style” portfolio—long BAB, long QMJ, levered appropriately—delivers returns that closely track Berkshire’s public stock holdings.
2. Stock Selection Criteria
If you want to pick individual stocks, Buffett’s criteria are well-documented:
Low beta (<1.0)
Low volatility
Low price-to-book ratio (value)
High profitability (ROE, margins)
Low leverage
High payout ratios
Stable, growing earnings
Screen for stocks meeting these criteria, and you’ll have a Buffett-like portfolio.
What You CANNOT Replicate
1. Insurance Float
You don’t have access to $171 billion of cost-free leverage. Neither do hedge funds—they pay 7%+ for borrowed capital.
This is Buffett’s true edge. The factor exposures explain his stock selection, but the leverage explains how 10% returns become 18% returns.
2. Access and Deal Flow
Berkshire gets preferential deals unavailable to retail investors:
Goldman Sachs: 10% dividend on preferred stock during 2008 crisis
Bank of America: Below-market warrant terms
Occidental Petroleum: Preferred stock with 8% dividend
These sweetheart deals add alpha that can’t be systematically captured.
3. “Patience Capital”
Buffett survived a 44% drawdown from June 1998 to February 2000 while the market rallied 32%. He then outperformed massively in the 2000-2002 crash.
Most fund managers would be fired for underperforming by 76%. Berkshire’s structure—no redemptions, permanent capital—allowed Buffett to ride out periods when his factors were out of favor.
Retail investors can mimic this patience, but it’s psychologically brutal.
Current Market Regime Analysis
With Buffett stepping back and Greg Abel taking the reins, how do Berkshire’s factor exposures fit the current environment?
VIX Regime (as of late December 2025):
The VIX closed 2025 around 14-15, relatively calm after spiking to 60 during “Liberation Day” (April 2025) when tariff announcements roiled markets. The year’s pattern—spiky volatility events with rapid mean reversion—suggests we’re in a “fragile calm” regime.
Factor Performance Context:
Factor          2025 Performance                 2026 Outlook
--------------  -------------------------------  ----------------------
BAB (Low Vol)   Lagged (AI speculation hurt)     Favored if IV rises
QMJ (Quality)   Mixed (safety bid in April)      Defensive positioning
Value (HML)     Underperformed vs. growth        Wide spreads = MR?
Berkshire-Specific Factors:
$344 billion in T-bills as of June 2025—the largest cash position of any U.S. public company. This suggests Buffett (now Abel) sees valuations as stretched and is waiting for better opportunities.
CEO transition risk: Berkshire shares underperformed the S&P 500 in 2025 (10.9% vs 16.4% total return) largely due to uncertainty around Buffett’s retirement announcement. Some discount may persist until Abel establishes his track record.
Float continues growing: Despite market conditions, insurance operations remain strong. This structural advantage persists regardless of who’s CEO.
A Simple Buffett-Style Strategy
Given all this, here’s a systematic approach to capturing Buffett-like factor exposures without the leverage advantage:
Strategy: Quality + Low Volatility + Value Overlay
Allocation Framework:
Base Portfolio (70%):
- 40% Quality ETF (SPHQ or QUAL)
- 30% Low Volatility ETF (SPLV or USMV)

Value Overlay (20%):
- 20% Value ETF (VTV or VLUE)

Opportunistic Allocation (10%):
- Cash or short-duration bonds during high VIX (>25)
- Rotate to quality stocks during VIX spikes
Expected Characteristics:
Lower beta than market (~0.7-0.8)
Higher quality metrics (profitability, stability)
Modest value tilt
Lower volatility than S&P 500
What you’re giving up:
Leverage amplification (no insurance float)
Concentration (Buffett holds ~40 stocks; ETFs hold hundreds)
Deal flow (no preferred stock deals)
Estimated Sharpe Ratio:
Based on historical factor returns, a systematic Buffett-style portfolio without leverage has delivered Sharpe ratios around 0.5-0.6—better than the market’s 0.49 but below Berkshire’s 0.79.
The gap is leverage. If you could apply 1.6x leverage at 0% cost, you’d approach Berkshire’s returns. But you can’t.
The Honest Assessment
Let me be direct: You cannot replicate Buffett’s returns as a retail investor.
The factor exposures are replicable. The leverage advantage is not. The patience required is rare. The deal flow is unavailable.
What you can do:
Tilt toward factors that have worked: Quality, low volatility, and value have delivered long-term premiums. Overweighting these relative to the market is a reasonable strategy.
Use modest leverage carefully: If you use margin at low rates (currently ~7%), you can amplify factor returns—but you’re paying for leverage that Buffett gets for free, and you’re exposed to margin calls he never faces.
Be patient: Factor premiums come in waves. There will be multi-year periods where quality and low-vol underperform. Buffett survived the late-90s tech bubble; you’ll need similar conviction.
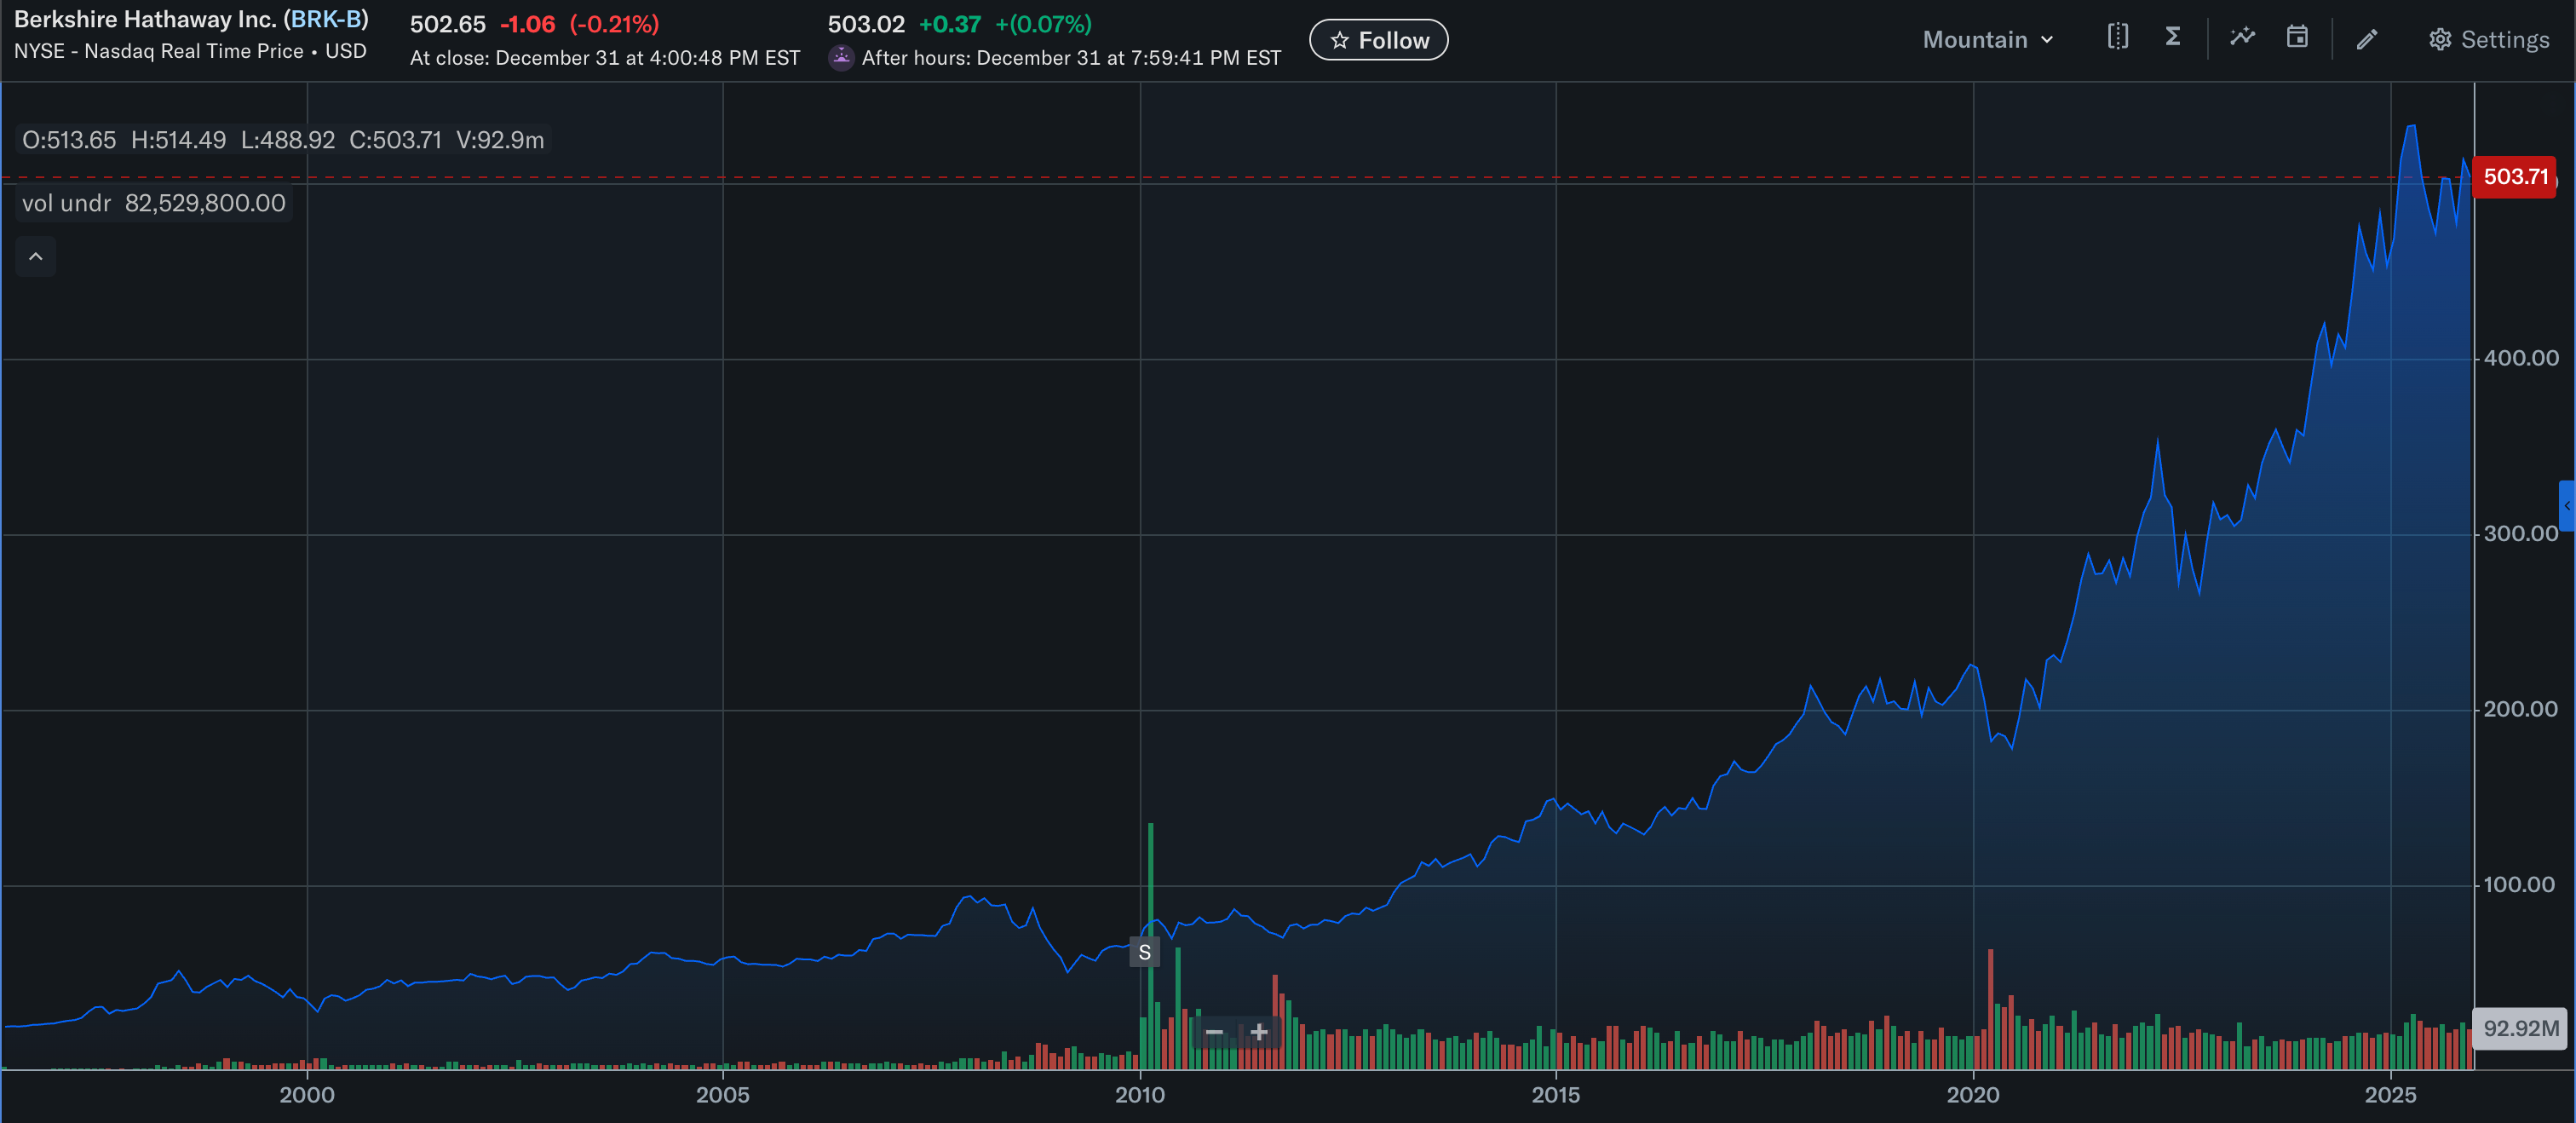
Consider BRK.B directly: At $500-ish per share, Berkshire’s B shares give you direct exposure to the entire mechanism—factor portfolio, insurance float, deal flow, and Abel’s management. The “Buffett premium” may compress post-transition, creating entry opportunities.
What This Means for My Trading Strategies
I’ve written extensively about factor-based strategies in this series. How does Berkshire fit?
Consistency with V6 Dual Allocator:
V6 uses VIX regimes, momentum signals, and TLT hedging. The Berkshire analysis reinforces several principles:
Low volatility works: Berkshire’s low-beta tilt is consistent with V6’s preference for stable, lower-volatility exposures during high-VIX regimes.
Quality matters: The QMJ loading suggests that beyond momentum, filtering for quality metrics might improve strategy robustness.
Leverage amplifies but requires cheap funding: Buffett’s edge is leverage cost. V6 uses leverage (TQQQ) but only in favorable VIX regimes—a crude proxy for managing leverage risk when you can’t access free float.
Potential Strategy Enhancement:
A hybrid approach might incorporate quality screening into the V6 framework:
VIX Regime       | Strong Uptrend | Weak Uptrend | Downtrend
-----------------|----------------|--------------|----------
Low (< 15)       | TQQQ (Quality) | QQQ 100%     | CASH
Moderate (15-25) | TQQQ (Quality) | QQQ 100%     | CASH
High (25-35)     | TLT 100%       | TLT 100%     | TLT 100%
Extreme (> 35)   | TLT 100%       | TLT 100%     | TLT 100%
Where “TQQQ (Quality)” means holding TQQQ only when underlying QQQ constituents pass quality screens. This adds complexity but might reduce whipsaw risk during factor rotation.
I haven’t backtested this yet — consider it a research direction rather than a recommendation.
The Bottom Line
Buffett’s genius was recognizing factor premiums decades before academics documented them, then structuring a business to exploit them with free leverage.
The factors he exploited—low beta, high quality, value—are now well-understood and accessible through ETFs. The leverage advantage is not replicable.
A systematic Buffett-style strategy can deliver:
Sharpe ratio ~0.5-0.6 (vs. market’s 0.49)
Lower volatility than the market
Reasonable long-term returns (10-12% CAGR)
It cannot deliver:
Sharpe ratio of 0.79
18%+ annualized excess returns
The full Berkshire experience
For most retail investors, the simplest Buffett implementation is buying BRK.B. You get the factors, the leverage, and the deal flow in one package. The transition discount may actually be an opportunity.
For quants, the lesson is that factors matter — and so does implementation. Buffett’s stock selection was systematic and replicable. His financing structure was not.
As always: The backtest is a liar until proven otherwise. This analysis is methodology, not recommendation.
Key References
Frazzini, A., Kabiller, D., & Pedersen, L.H. (2018). “Buffett’s Alpha.” Financial Analysts Journal, 74(4).
Frazzini, A. & Pedersen, L.H. (2014). “Betting Against Beta.” Journal of Financial Economics, 111(1).
Asness, C., Frazzini, A., & Pedersen, L.H. (2019). “Quality Minus Junk.” Review of Accounting Studies, 24.
Berkshire Hathaway Annual Reports (2001-2024). berkshirehathaway.com
AQR Data Library: aqr.com/Insights/Datasets
Bespoke Investment Group analysis on BRK performance during recessions and bear markets.
This post marks the end of the Buffett era at Berkshire Hathaway. Whatever you think of his politics, philanthropy, or folksy persona, the man’s investment record is unimpeachable. Greg Abel has an impossible act to follow.
Remember: Alpha is never guaranteed. And the backtest is a liar until proven otherwise.
These posts are about methodology, not recommendations. Some of the approaches discussed here involve complex instruments and are not suitable for all investors. Many of my analyses probably contain errors — if you find them, please let me know.
The material presented in Math & Markets is for informational purposes only. It does not constitute investment or financial advice. While I hold positions in Berkshire Hathaway, this is not an endorsement or a recommendation of Berkshire Hathaway.