
Crypto’s Overnight Tell: Forecasting the VIX with Bitcoin and Ethereum
A 1% positive overnight return in Bitcoin or Ethereum predicts a 0.4% drop in the VIX during the next U.S. trading session. One signal, eight years of data, a Sharpe of 2.36 net of costs

The signal in plain sight.
The VIX is a forecast of the next 30 days of S&P 500 volatility, and it only trades during the 6.5 hours U.S. equities are open. The other 17.5 hours of every day, the world keeps happening — and there is exactly one freely-traded, leverage-funded, globally accessible risk asset that doesn’t stop: cryptocurrency. Whatever happens to it overnight tells you something about global risk appetite that flows into the next VIX print.
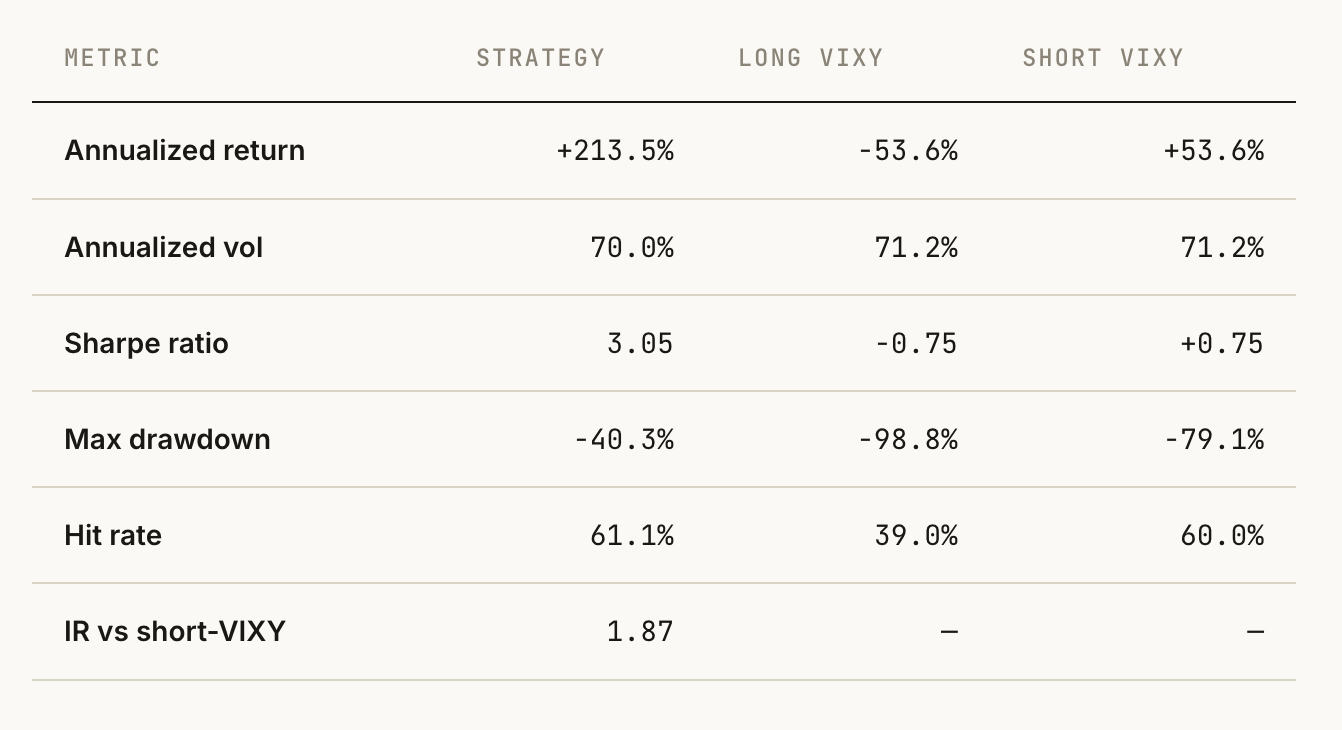
A 1% positive overnight return in Bitcoin or Ethereum — the hours when U.S. equity markets are closed — predicts a roughly 0.4% drop in the VIX during the next U.S. trading session. The signal is large by predictive-regression standards (t ≈ −5), and a single-signal VIXY long/short strategy built on it produces an out-of-sample Sharpe of 3.05 gross, 2.36 net of 25 bps.
Nam Nguyen Ph.D. had recently posted a paper on VIX Forecasting Using Crypto Overnight Returns. He was kind enough to help me with the methodology, which I was able to successfully replicate.
The replication target is Gu, Lin & Liu (2026), “Beyond Conventional Sentiment Indicators: Cryptocurrency’s Hidden Potential in VIX Forecasting” (Economic Modelling). Their paper uses 5-minute CoinDesk data; this version uses only what’s publicly accessible on Yahoo Finance, January 2018 through December 2025. The headline findings replicate cleanly.

The decile sort makes it unmissable
Sort every trading day into ten buckets by overnight crypto return, then plot the mean VIX trading-hour change in each bucket. The gradient is monotone: +2.4% to +2.6% in the bottom decile (big crypto sell-off), down to −2.7% in the top decile (big crypto rally). No nonlinearity to hide behind. No subset of the data carrying the result. A clean, monotone, economically interpretable signal.

Regression coefficients with HAC standard errors
Four nested OLS specifications, all with Newey-West (5 lags) standard errors. The baseline controls for VIX overnight, SPX futures overnight, FOMC dummies, and post-holiday dummies — and reaches an R² of just 0.43%. Adding BTC alone takes R² to 5.51%; adding ETH alone, 5.73%; both together, 6.16%. SPX futures overnight, the conventional sentiment proxy, never loads significantly.

The signal is small in absolute magnitude — but stable in sign, significant in every regime, and untainted by the conventional sentiment proxies you’d expect to dominate.
Out-of-sample: a rolling-window forecast
Forecasts are produced with a 666-day rolling window — re-estimated every day, used to forecast the next day’s VIX trading-hour log change. Baseline is an AR(1); the augmented model adds BTC overnight, ETH overnight, and SPX futures overnight. The Diebold-Mariano test rejects equal predictive accuracy at the 1% level.
METRICAR(1) BASELINECRYPTO-AUGMENTEDΔn (OOS observations)1,3421,342—MSE0.0049160.004653−5.3%MAE0.048360.04728−2.2%OOS R² (vs zero)2.19%7.43%+5.2 ppDiebold-Mariano stat—2.70p = 0.0069

From forecast to position.
The forecast is converted into a daily position on VIXY, the ProShares VIX short-term futures ETF. Long if predicted ΔVIX is positive, short if negative. Position taken at 09:30 ET, held to 16:00 ET. (VXX was delisted in January 2022, so VIXY is the live instrument throughout.)

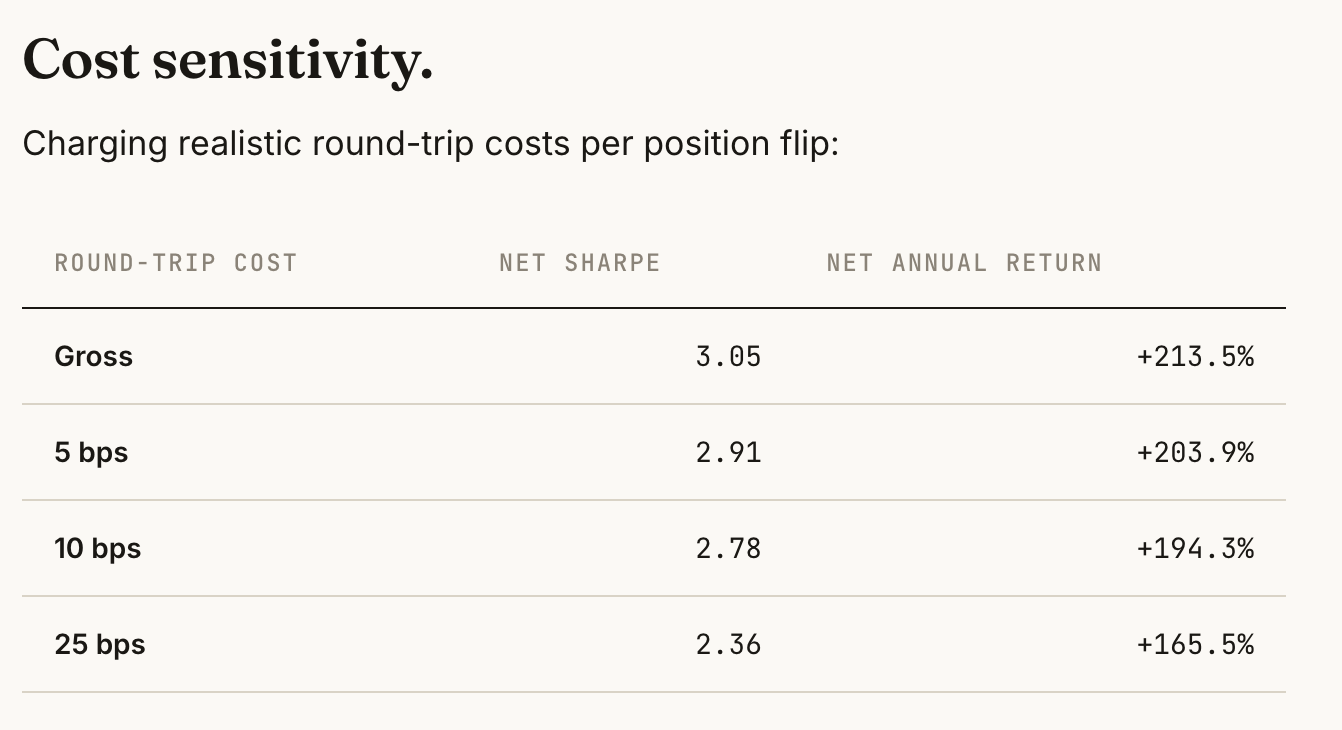
Cost sensitivity.
Charging realistic round-trip costs per position flip:
A WORD ON THE 213% HEADLINE RETURN
That number deserves three caveats. (1) Realized vol is also 70% — the Sharpe is the defensible figure. (2) Max drawdown is −40%, with a particularly ugly 2024 stretch. (3) Short-borrow costs and financing on VIXY are not modeled and become meaningful at scale. The realistic takeaway is Sharpe ≈ 2.4 after costs, max drawdown ≈ 40%, and a clean economic story.

Crypto signals roughly triple in high-volatility regimes
Split the sample at the 80th percentile of the VIX level (threshold: 24.11). In low-volatility regimes (n = 1,606 days), the crypto–VIX correlation is a modest −0.13 to −0.14. In high-volatility regimes (n = 403 days), it roughly triples to −0.36 and −0.33. SPX futures overnight stays glued to zero across both.

The interpretation is straightforward. In a quiet regime, the marginal U.S. desk opens, scans the overnight tape, and prices it efficiently. In a high-stress regime, the overnight tape is itself the information event — and crypto is the cleanest read of that tape because it’s the asset that actually traded.

The bottom line.
All four findings of Gu, Lin & Liu (2026) replicate cleanly on Yahoo Finance data:
Crypto overnight returns significantly predict next-session VIX changes (t ≈ −5).
Adding crypto triples OOS R²; the improvement is significant at p < 0.01.
A VIXY long/short strategy on the augmented forecast generates a Sharpe of 3.05 gross, 2.36 net of 25 bps.
The crypto signal strengthens in high-vol regimes, where SPX-based sentiment is noise.
Methodology footnote: Yahoo-only data & what changed
The original study uses 5-minute CoinDesk bars from 2018 to 2025. Yahoo’s intraday data is capped at ~730 days, so a true 5-minute history wasn’t retrievable. The replication uses a hybrid construction:
Hourly-precise window for 2024–2026, where Yahoo serves hourly bars. The 16:00 ET → 09:30 ET overnight return is computed from actual hourly prints.
Daily-proxy window for 2018–2024. Crypto’s UTC daily close sits roughly four hours after U.S. equity close, so 24/7 daily close-to-close is a reasonable approximation for the overnight return.
The signal is qualitatively unchanged by the granularity choice.
Other deviations
No Google Trends / on-chain attention proxies. Those weren’t accessible from Yahoo; the paper’s attention-decile analysis is omitted.
AR(1) rolling OOS forecast in place of the paper’s VAR(p). For a single-target ΔVIX problem, essentially equivalent.
Diebold-Mariano only, no Model Confidence Set. DM is sufficient for the pairwise baseline-vs-augmented comparison.
VIXY only. The paper uses both VXX and VIXY; VXX was delisted in January 2022.
FOMC dates are the 66 release-day dates from the Federal Reserve’s official 2018–2025 calendar, hardcoded.
Standard errors on all regressions are Newey-West HAC with 5 lags.
Tickers used: BTC-USD, ETH-USD,^VIX, ES=F, VIXY. All from Yahoo Finance via yfinance.
Remember: Alpha is never guaranteed. And the backtest is a liar until proven otherwise.
My math may have errors — please let me know if you find any.
The material presented in Math & Markets is for informational purposes only. It does not constitute investment or financial advice.
Interesting piece. I tried replicating the strategy and could only reproduce strong results when using same-day Yahoo daily BTC/ETH returns, which appears to introduce lookahead bias for a 9:30am VIXY trade, since the crypto daily bar is not complete until later in the day. When I shifted the Yahoo daily crypto returns so they were actually known before the U.S. open, the edge largely disappeared. I also tested clean 5-minute spot BTC/ETH data for the later period using both the true 16:00-09:30 overnight window and the 16:00-20:00 “Yahoo UTC close” proxy, and neither reproduced the reported performance. Curious how you handled the Yahoo daily bar timing in the 2018–2024 proxy period.