
Carry Trade: The Oldest Edge in Finance
Part 88 — FX carry, bond roll-down, the volatility risk premium, and why every asset class pays you to hold risk overnight

This is part 88 of my series — Building & Scaling Algorithmic Trading Strategies
This begins a 3-part series on carry. Part 1: what carry actually is. Part 2: when carry blows up. Part 3: building a multi-asset carry portfolio.
The Unifying Equation
Every asset you can hold generates two types of return: the carry you earn from simply holding the position, and the price change you get from the market moving. Most people focus on the price change. The professionals focus on the carry.
Total Return = Carry + Price ChangeThis equation is trivially simple but its implications are pretty crazy.
Carry is the return you’d earn if nothing changes — if rates stay the same, if exchange rates don’t move, if the yield curve maintains its shape. It’s the “income” component of return. Price change is everything else — the unpredictable part.
What makes carry powerful: it’s knowable in advance. You can calculate today exactly how much carry you’ll earn tomorrow. You can’t do that with price changes. This asymmetry — one component is predictable, the other isn’t — is the foundation of an entire class of strategies.
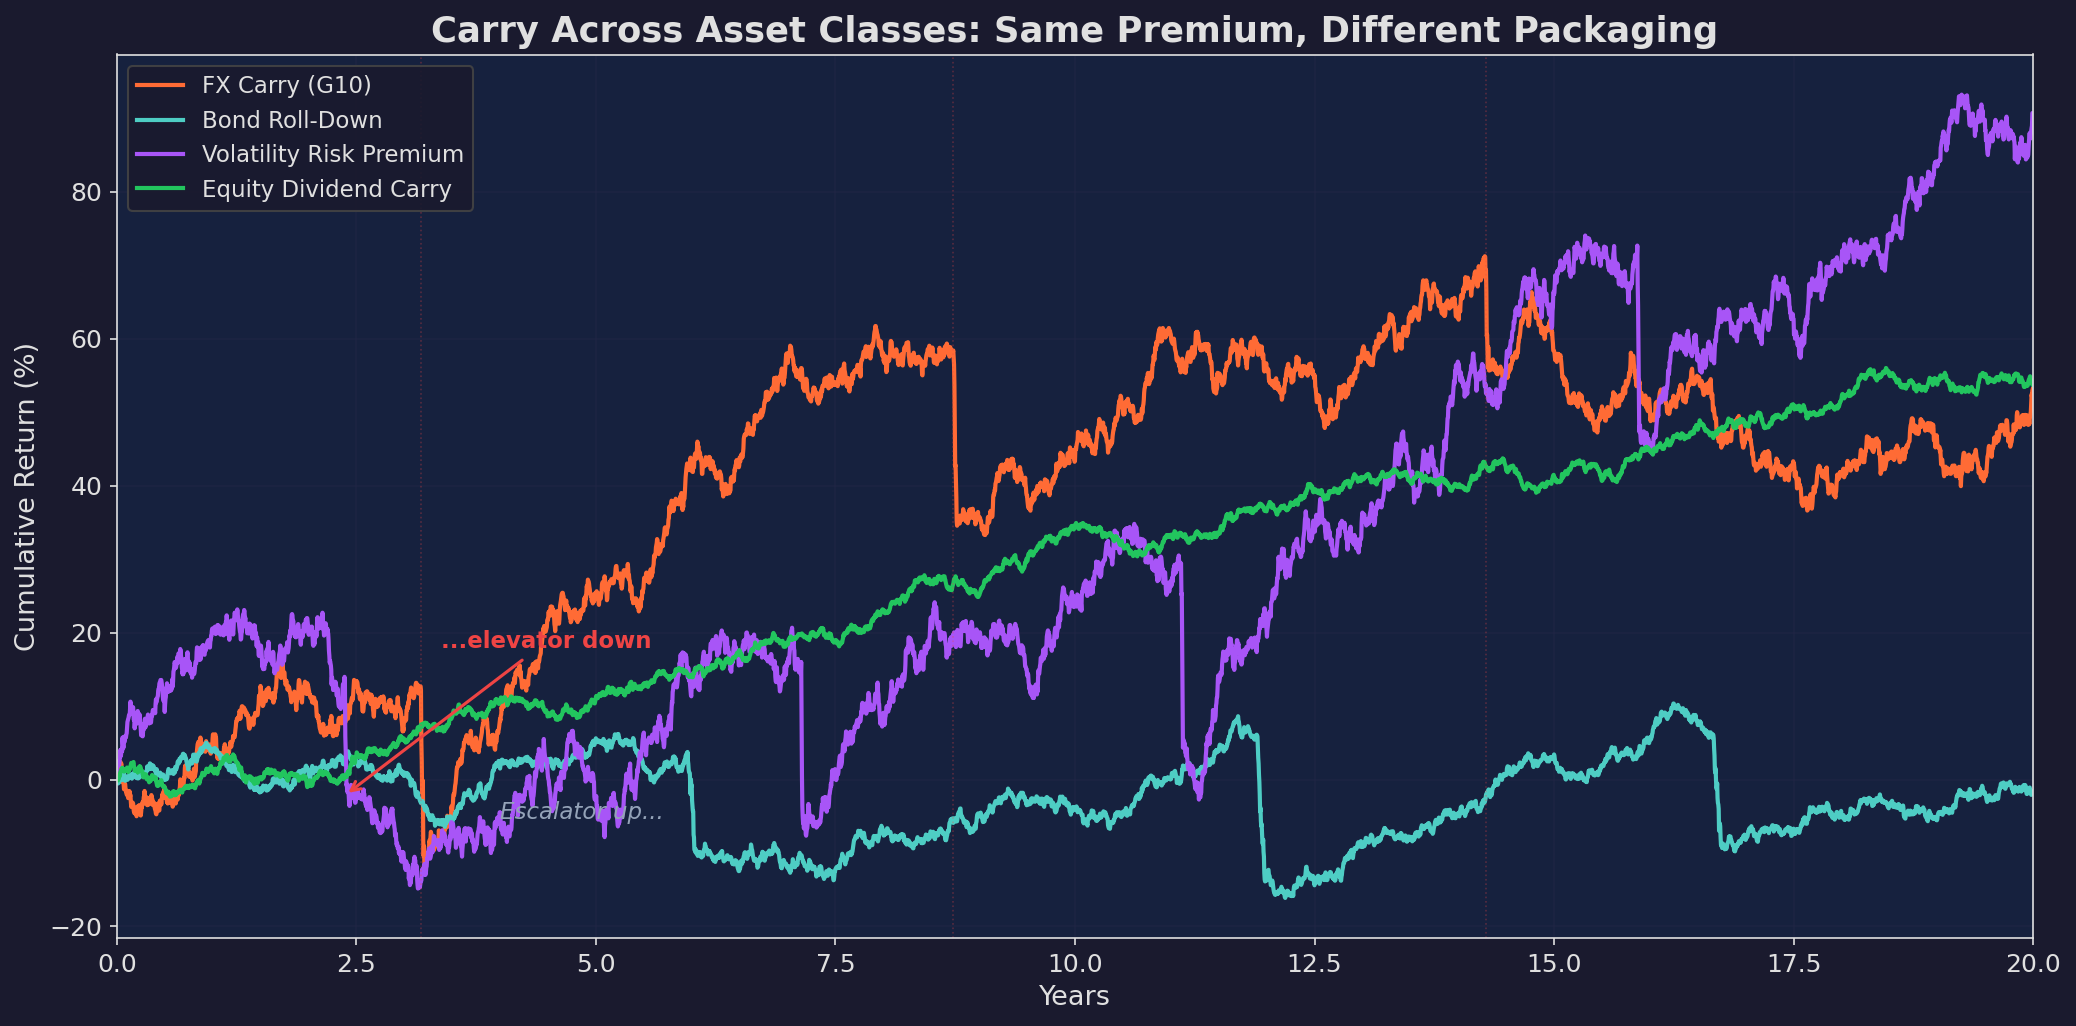
Four carry strategies over 20 simulated years. The volatility risk premium (purple) has the highest carry but the worst drawdowns. FX carry (orange) shows the classic “escalator up, elevator down” pattern. Bond roll-down (blue) is the steadiest. Equity dividend carry (green) has the lowest carry but the least drama.
The Five Faces of Carry
Carry shows up in every asset class. The name changes, the math is the same:
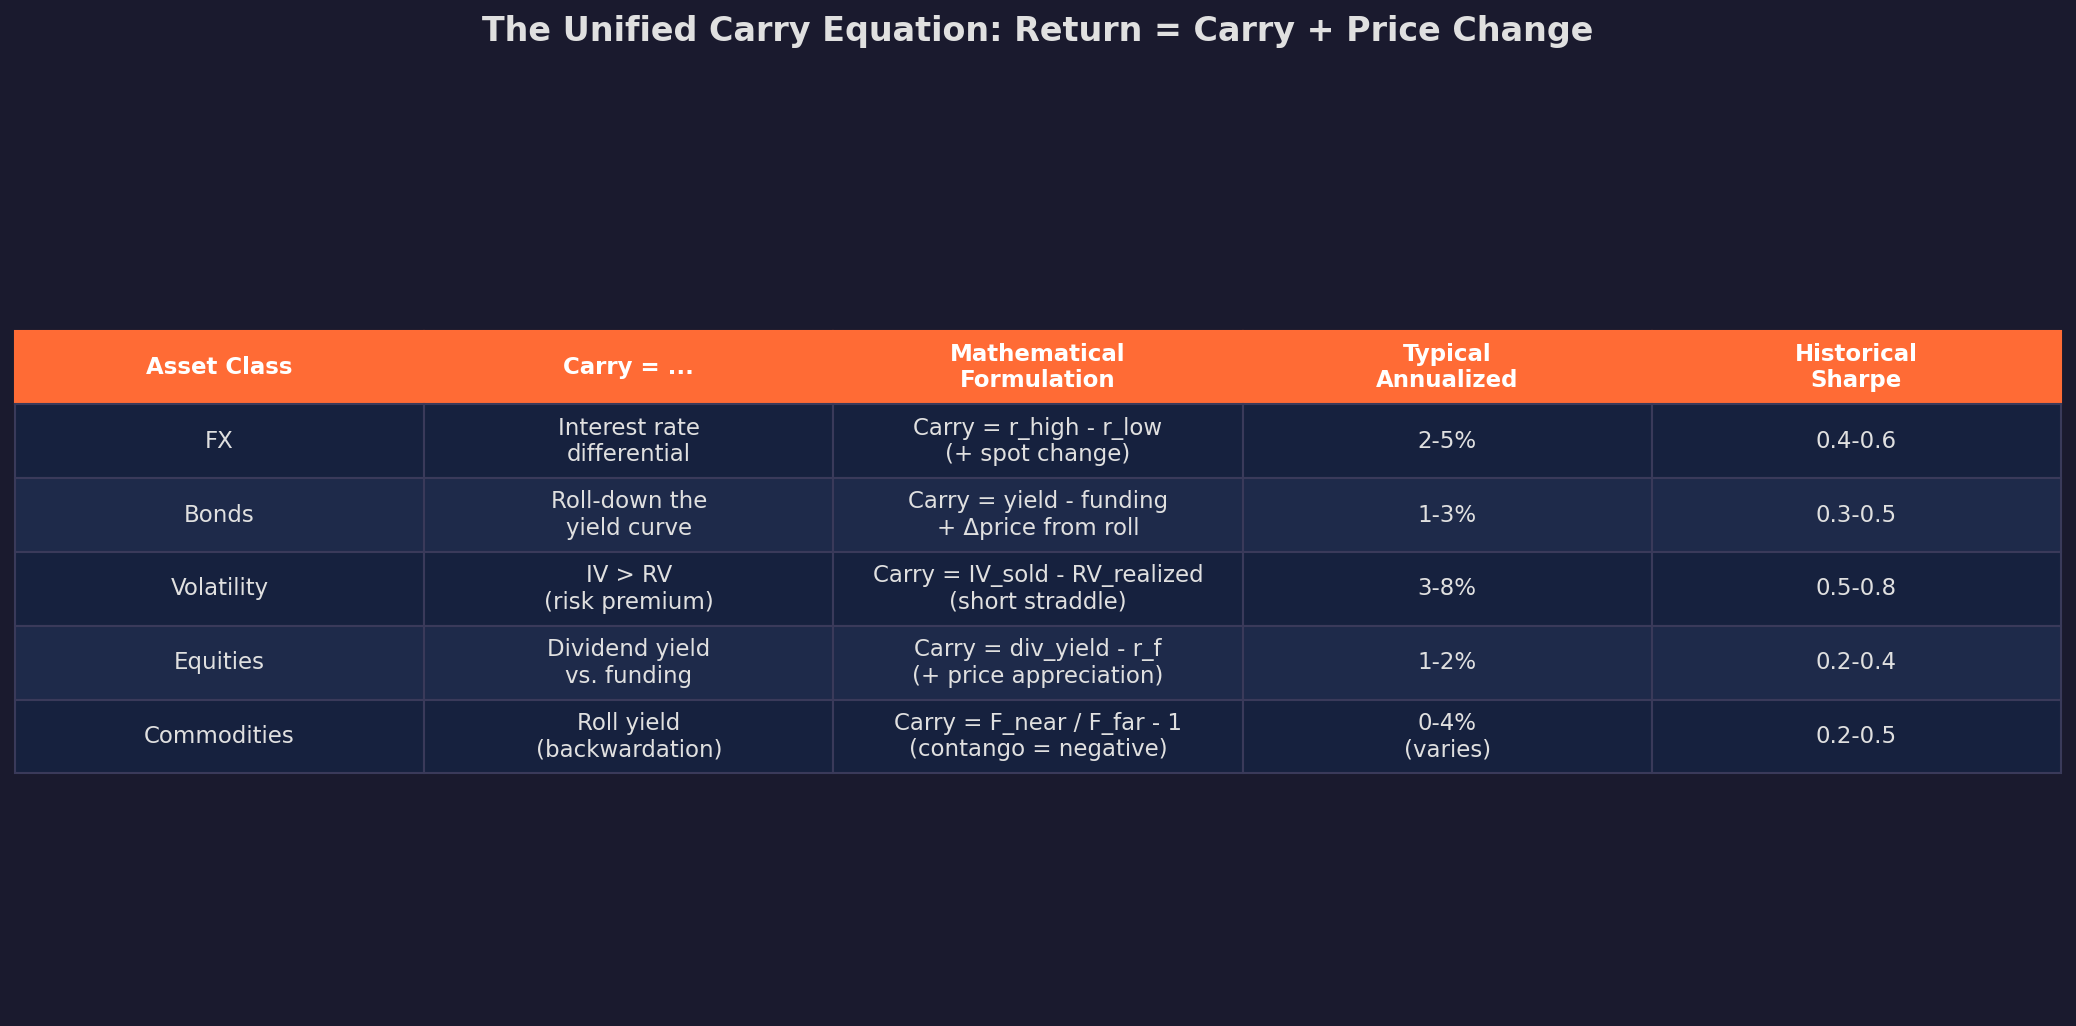
In every case, you earn a predictable income for holding a position. And in every case, price changes can overwhelm that income — sometimes catastrophically.
So let’s walk through each one…
FX Carry: The Fama Puzzle
FX carry is the most studied and the most intuitive. Borrow in a low-rate currency (JPY, CHF), invest in a high-rate currency (AUD, BRL, TRY). The interest rate differential is your carry.
Standard economics says this shouldn’t work. Uncovered Interest Parity (UIP) predicts that high-rate currencies should depreciate at exactly the rate of the interest differential, leaving carry traders with zero expected profit. A 10% rate in Turkey should be offset by a 10% depreciation of the lira.
The reality is different. Fama (1984) showed that high-rate currencies actually appreciate slightly on average, making the carry trade doubly profitable — you earn the rate differential AND a small FX gain. This anomaly, known as the “Fama puzzle” or the “forward premium puzzle,” has persisted for 40+ years across currencies and time periods.
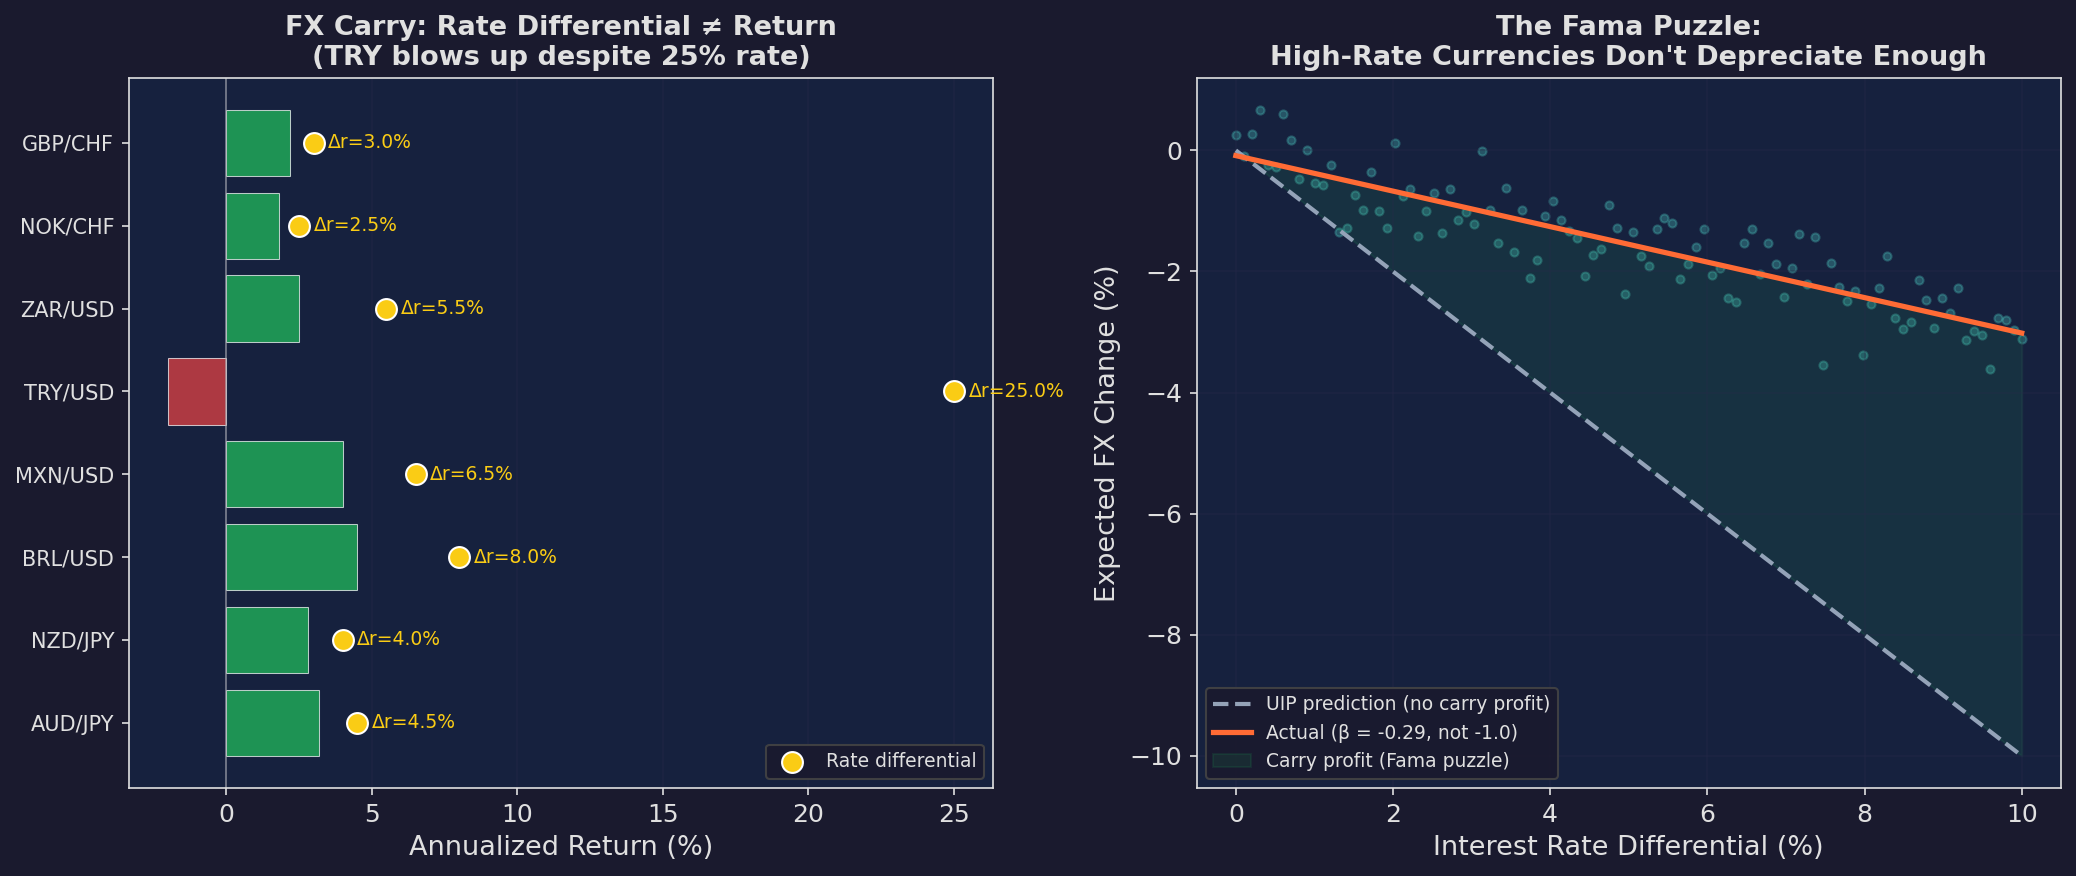
Left: FX carry returns by pair. Note TRY/USD: 25% rate differential but negative total return — the lira depreciation overwhelmed the carry. High carry ≠ guaranteed profit. Right: the Fama puzzle visualized. UIP predicts the gray line (high rates → proportional depreciation). Reality (orange line) has a slope of about -0.3, not -1.0. The gap between the lines is the carry profit.
Why Does This Persist?
Three theories, none fully satisfying:
Peso problem. Carry trades work most of the time but occasionally blow up catastrophically (peso devaluation, yen carry unwind, etc.). The average return compensates for crash risk that hasn’t been fully sampled.
Risk premium. Investors demand compensation for holding higher-risk currencies. Just as equities earn a premium over bonds, high-rate currencies earn a premium over low-rate currencies.
Slow-moving capital. Central bank interventions and institutional frictions prevent immediate arbitrage. By the time capital moves to exploit the anomaly, the opportunity has partially closed but never fully disappears.
For our purposes, the mechanism matters less than the empirical fact: carry has been a profitable strategy across currencies for decades, with a Sharpe of approximately 0.4-0.6 in G10 currencies — similar to equities but with very different risk characteristics.
Bond Roll-Down: Riding the Curve
Bond carry is subtler than FX carry. It has two components:
1. Coupon (yield) carry. You earn the bond’s yield minus your funding cost. A 10-year Treasury yielding 4.2% funded at a 4.5% repo rate gives you -0.3% of yield carry. Not great.
2. Roll-down carry. As a bond ages, it moves to a shorter maturity on the yield curve. If the curve is upward-sloping, shorter maturities have lower yields. Lower yields mean higher prices. You profit from this mechanical price appreciation.
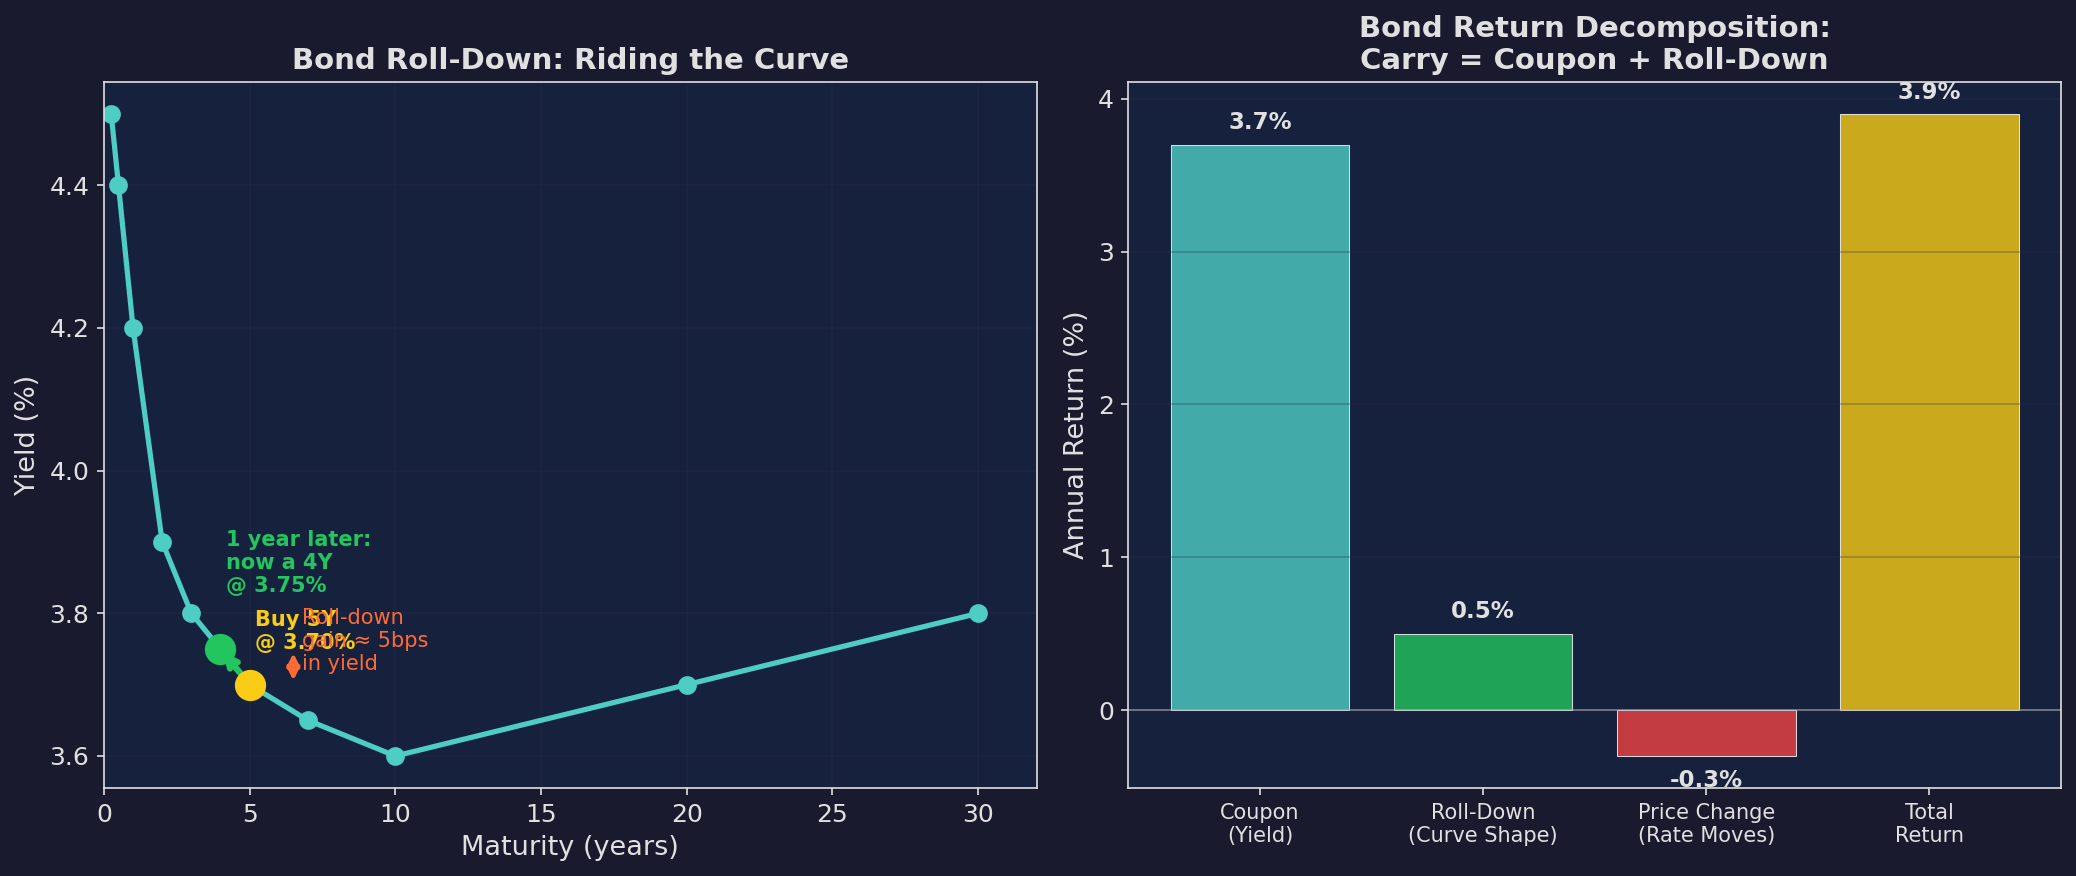
Left: the roll-down mechanism. Buy a 5-year bond at 3.70%. After one year, it’s a 4-year bond. If the yield curve hasn’t changed, a 4-year bond yields 3.75% — but you bought at 3.70%, so you’ve gained. The price appreciation from this yield decline is the roll-down carry. Right: decomposition of bond return. Coupon provides 3.7%, roll-down adds 0.5%, price change subtracts 0.3%, for a total of 3.9%.
Roll-down carry is positive whenever the yield curve is upward-sloping (normal) and negative when it’s inverted. Since the curve is normal roughly 80% of the time, bond carry is usually positive.
The Duration Bet
Bond carry is partly compensation for duration risk — the risk that rates rise and your bond loses value. A strategy that systematically harvests bond carry is implicitly betting that rates won’t rise faster than the carry compensates. When rates spike (2022), bond carry gets destroyed. When rates are stable or declining, it compounds steadily.
This is directly relevant to V6: TLT (the 20+ year Treasury ETF) earns carry from both coupon and roll-down. V6’s TLT allocation isn’t just a hedge — it’s a carry position.
The Volatility Risk Premium: Selling Insurance
The volatility risk premium (VRP) is the most lucrative and most dangerous carry trade.
The VRP exists because implied volatility (what options are priced at) systematically exceeds realized volatility (what actually happens). The gap — typically 3-5 percentage points of volatility — is the “insurance premium” that option buyers pay and option sellers collect.
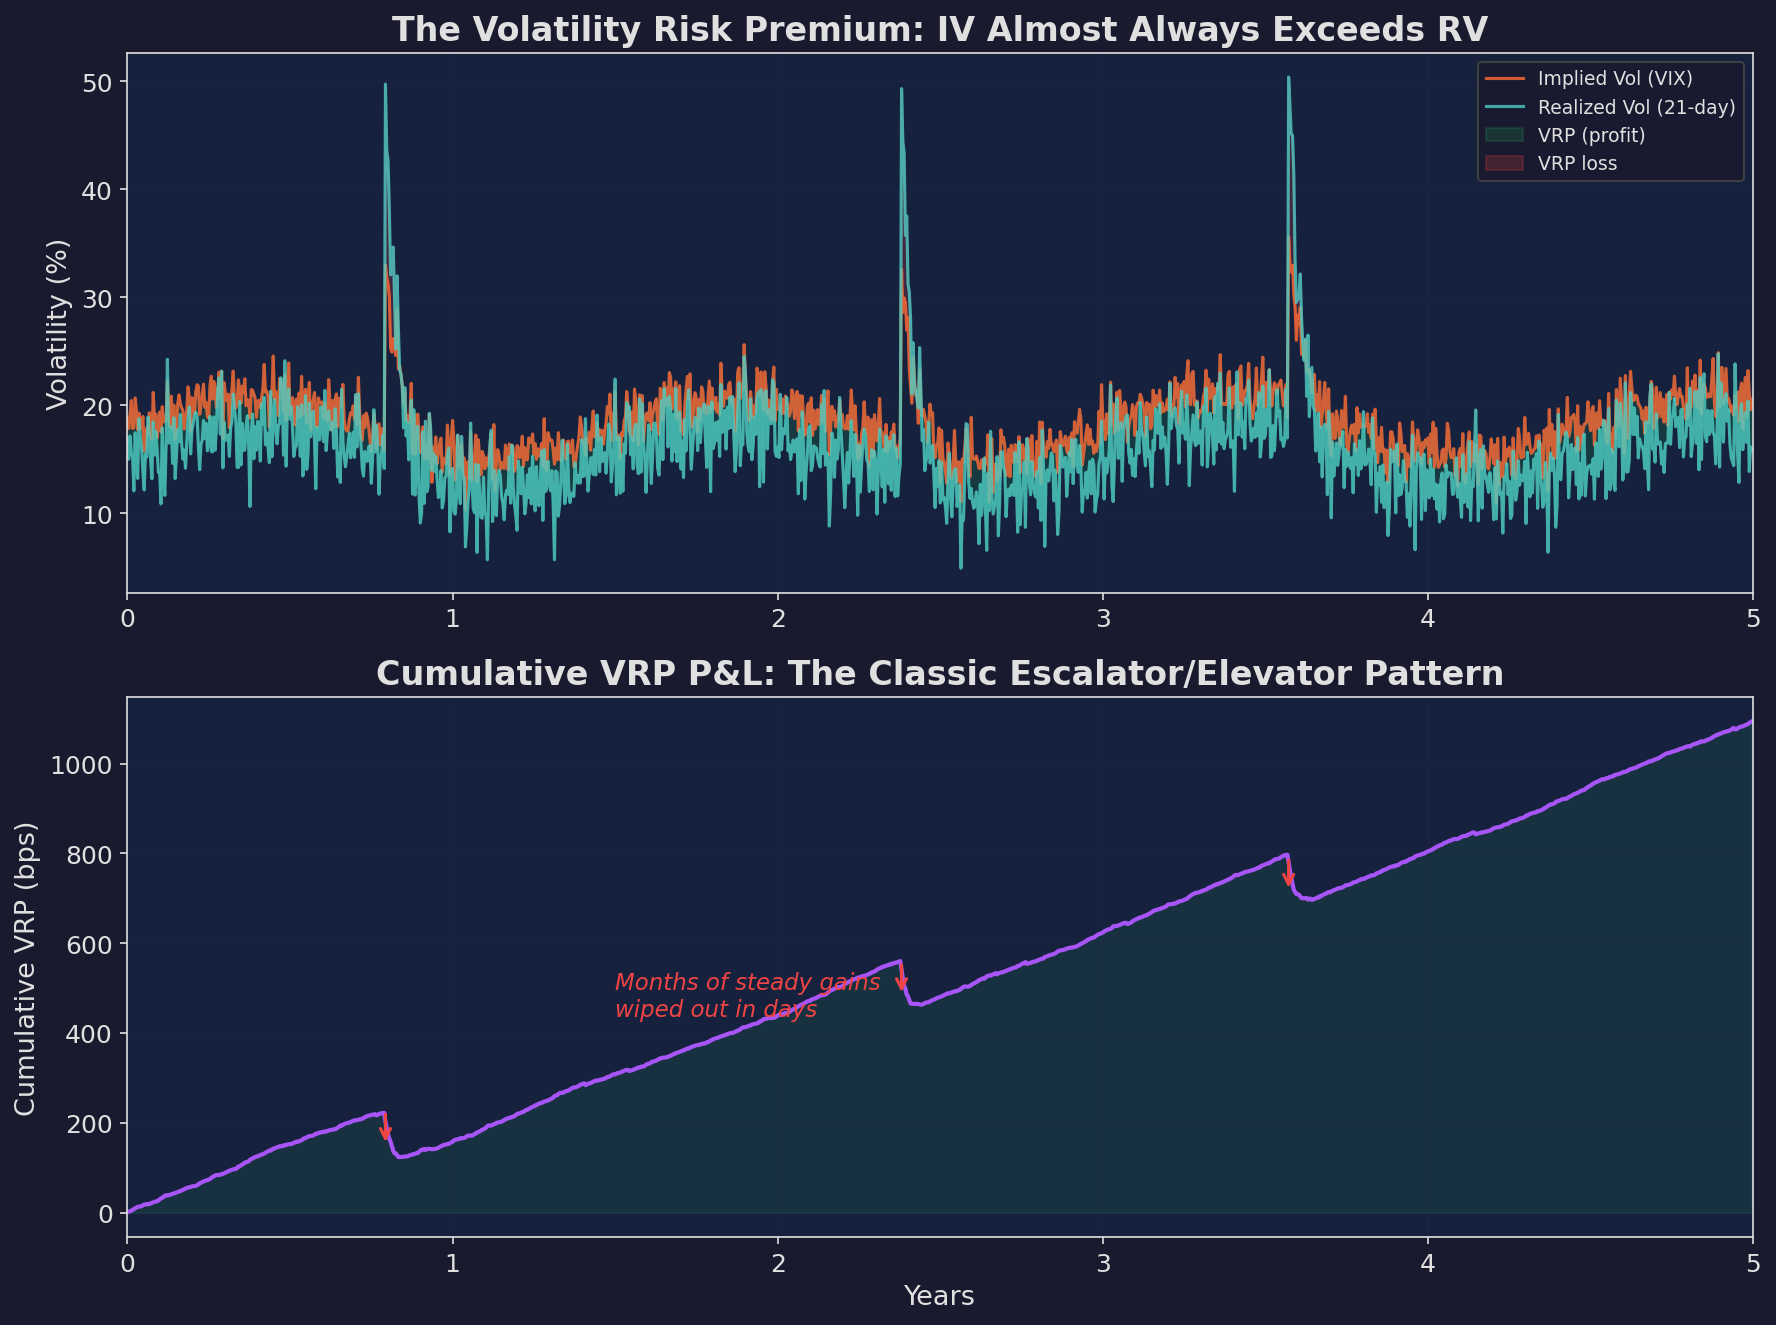
Top: implied vol (orange) vs. realized vol (blue). The green shading shows the VRP when it’s positive (profit for short vol). Red shading shows when realized exceeds implied (loss). Bottom: cumulative VRP P&L. Steady upward grind interrupted by sharp drawdowns — the quintessential carry profile.
Why VRP Exists
Unlike the Fama puzzle, the VRP has a clean economic explanation: risk aversion.
Option buyers are purchasing insurance against tail events. Insurance is always priced above its actuarial value — that’s how insurance companies make money. Similarly, options are priced above their expected payoff. The seller (the “insurance company”) collects this premium.
The VRP is robust because it’s structural, not informational. As long as investors are risk-averse — which is basically always — they’ll overpay for downside protection, and vol sellers will collect the premium.
V6 captures VRP implicitly through its VIX regime filter. When VIX is elevated (options are expensive), V6 shifts allocation — effectively acting as a partial buyer of the vol premium. When VIX is low, V6 is fully invested — effectively neutral on vol. Understanding this as a carry trade changes how you think about V6’s risk.
The Skewness Problem
Every carry trade shares a statistical fingerprint: positive mean, negative skew.
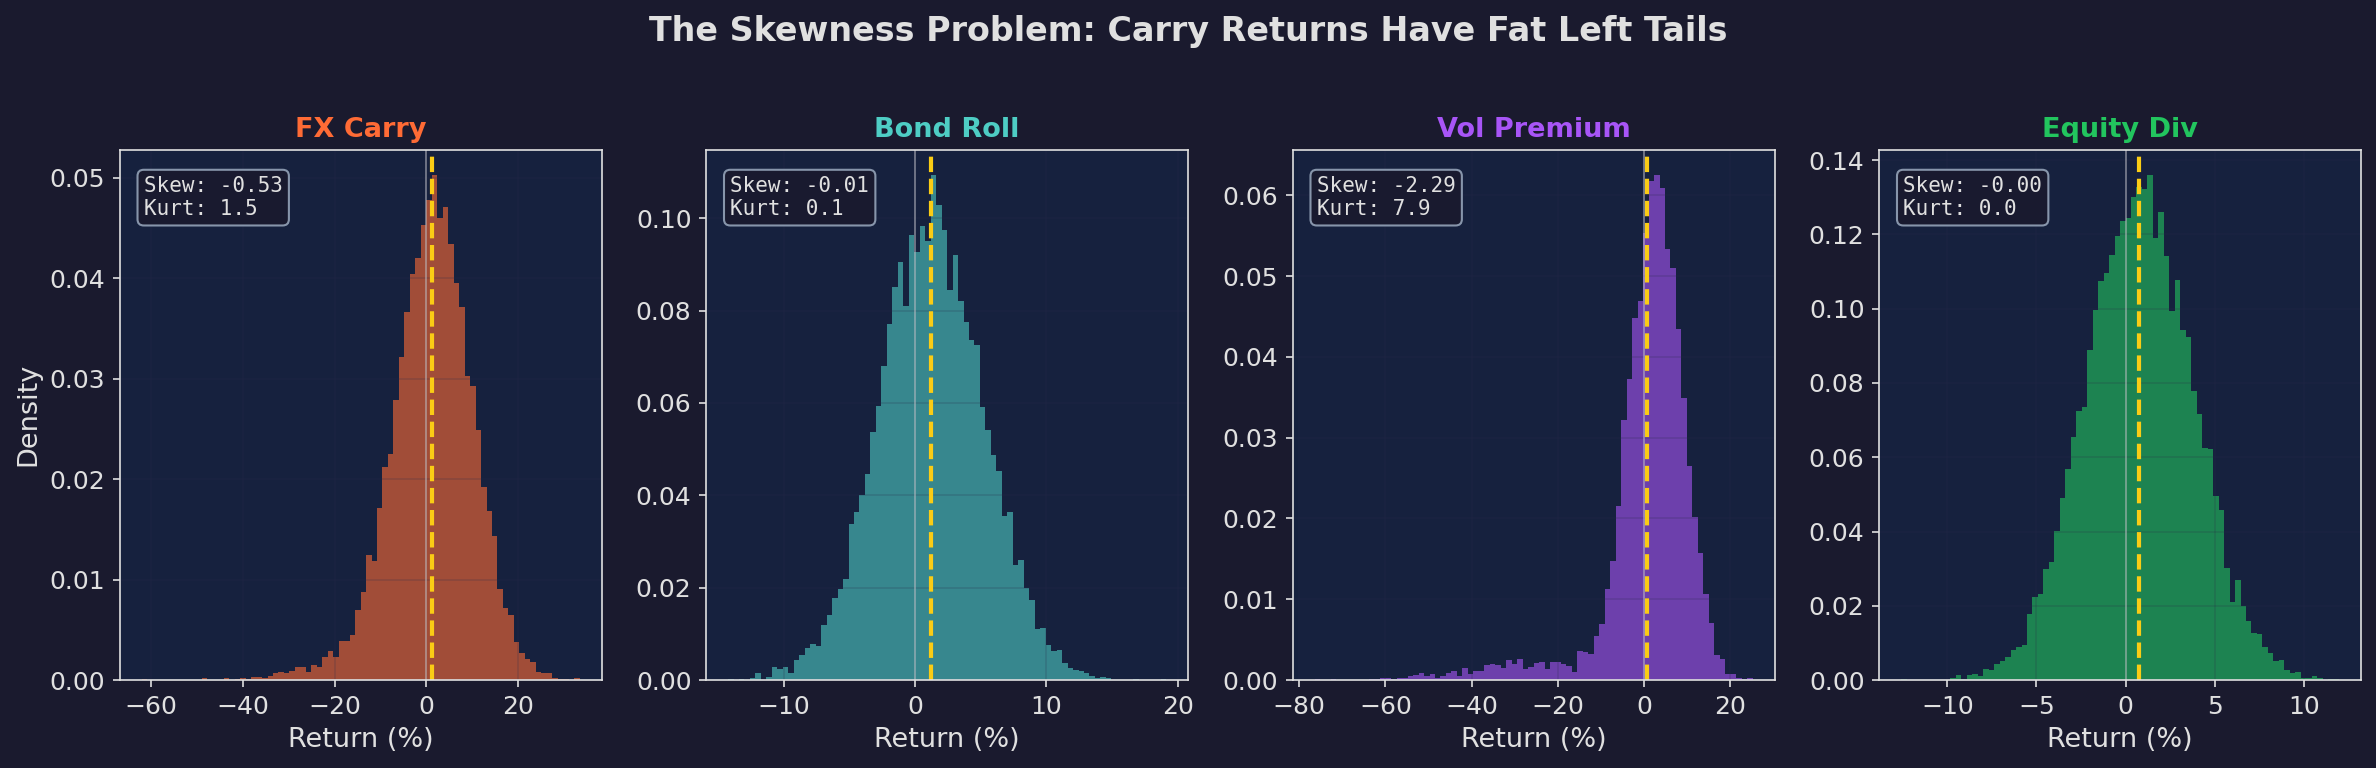
Return distributions for four carry strategies. FX carry and vol premium have extreme negative skew (-0.5 to -0.8) and excess kurtosis (3-8). Bond roll-down and equity dividends are more symmetric. The fat left tails are the “elevator down” — rare but devastating losses.
This is not a coincidence. Carry trades earn a premium precisely because they expose you to left-tail risk. The Sharpe ratio of a carry trade overstates its risk-adjusted return because the Sharpe assumes normal returns. With negative skew, you’re earning the average return most of the time but occasionally losing 5-10× the average in a single event.
The practical implication: never size a carry trade using the Sharpe ratio. Use a tail-risk-adjusted metric like the Sortino ratio, or simulate the worst-case drawdown and size to survive it.
V6’s Hidden Carry
Here’s the punchline of this post: V6 is already a carry trader, and understanding this changes how you analyze its returns.
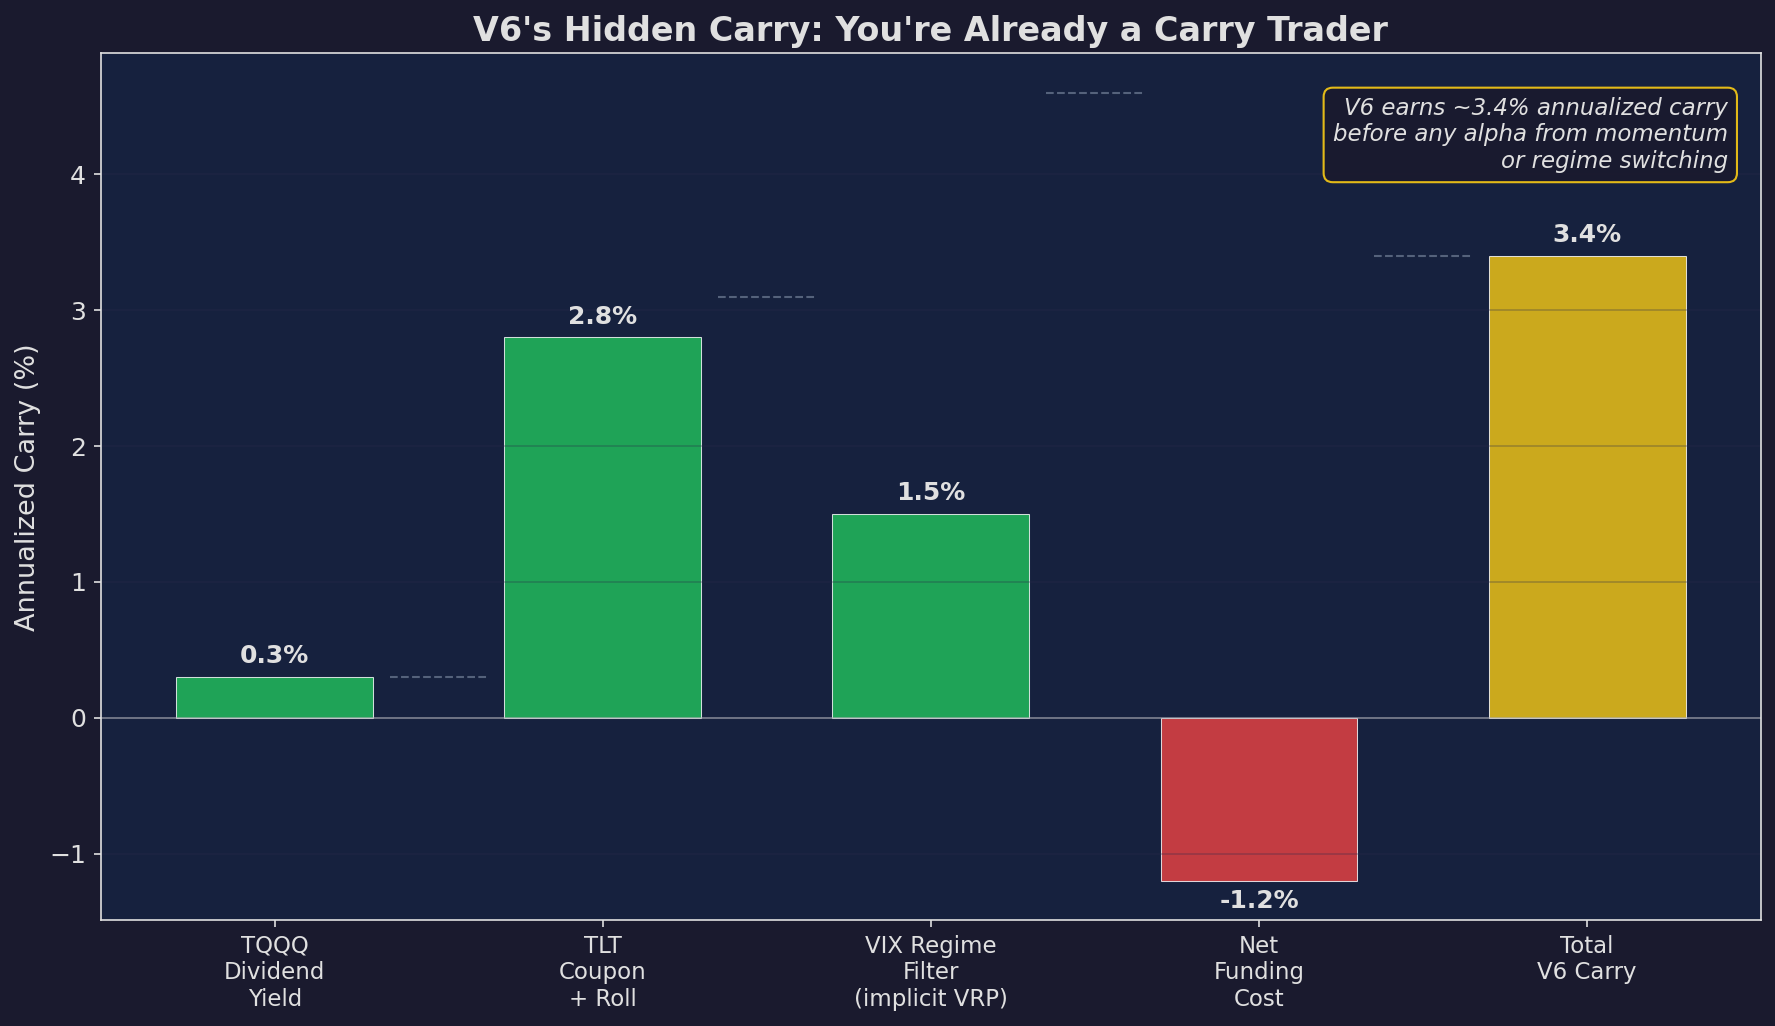
V6 earns approximately 3.4% annualized carry from four sources: TQQQ’s dividend yield (0.3%), TLT’s coupon and roll-down (2.8%), implicit VRP from the VIX regime filter (1.5%), minus funding cost (-1.2%). This carry accrues before any alpha from momentum signals or regime switching.
When V6 has a good year, how much is carry and how much is alpha? When V6 has a bad year, is the carry still working and the alpha failing, or has the carry trade itself reversed (as bond carry did in 2022)?
Decomposing returns into carry and alpha is essential for understanding whether V6 is working for the right reasons. If the carry component accounts for most of the return, V6 is primarily a carry trade with alpha on top. If the alpha dominates, V6 is primarily a directional strategy with carry as a bonus.
Based on the math above, V6’s ~24% CAGR decomposes roughly as:
Carry component:     ~3.4% (predictable, accrues daily)
Momentum alpha:      ~8-10% (from regime switching, variable)
Leveraged beta:      ~10-12% (from TQQQ's 3× equity exposure)
Interaction effects:  ~1-2% (timing of carry vs. alpha)
The carry is the floor. Even when the momentum signals are wrong, V6 earns ~3.4% from holding its positions. That’s not nothing — it’s the difference between a bad year being -5% versus -8%.
Up Next
Part 2: When Carry Blows Up — The “escalator up, elevator down” problem formalized. Can regime signals warn you before a carry crash? We’ll look at FX carry unwinds, Volmageddon, and the 2022 bond rout through the lens of carry timing.
Remember: Alpha is never guaranteed. And the backtest is a liar until proven otherwise.
These posts are about methodology, not recommendations. If you find errors in my math, let me know — I’ve built an entire series around discovering my own mistakes, so one more won’t hurt.
The material presented in Math & Markets is for informational purposes only. It does not constitute investment or financial advice.