
Can FRED Data Predict Markets? Testing 11 Macro Strategies across Equities & Fixed Income
Part 47: The difference between mechanical and informational edges

This is part 47 of my series — Building & Scaling Algorithmic Trading Strategies
The Federal Reserve Economic Data (FRED) database is free, comprehensive, and widely used by economists and traders alike. It contains over 800,000 time series — unemployment claims, yield curves, credit spreads, Fed balance sheets, inflation expectations.
The question I wanted to answer: can any of this data predict market returns?
I tested 11 strategies across two asset classes. The results expose something fundamental about where alpha can and cannot exist.
TL;DR: No for equities, barely for bonds.
The Equity Experiment: Complete Failure
Test Period: 2008-01-01 to 2025-12-01 (18 years)
Benchmark: SPY Buy & Hold (+558% total return, 10.8% CAGR)
I built and backtested five FRED-based equity strategies:
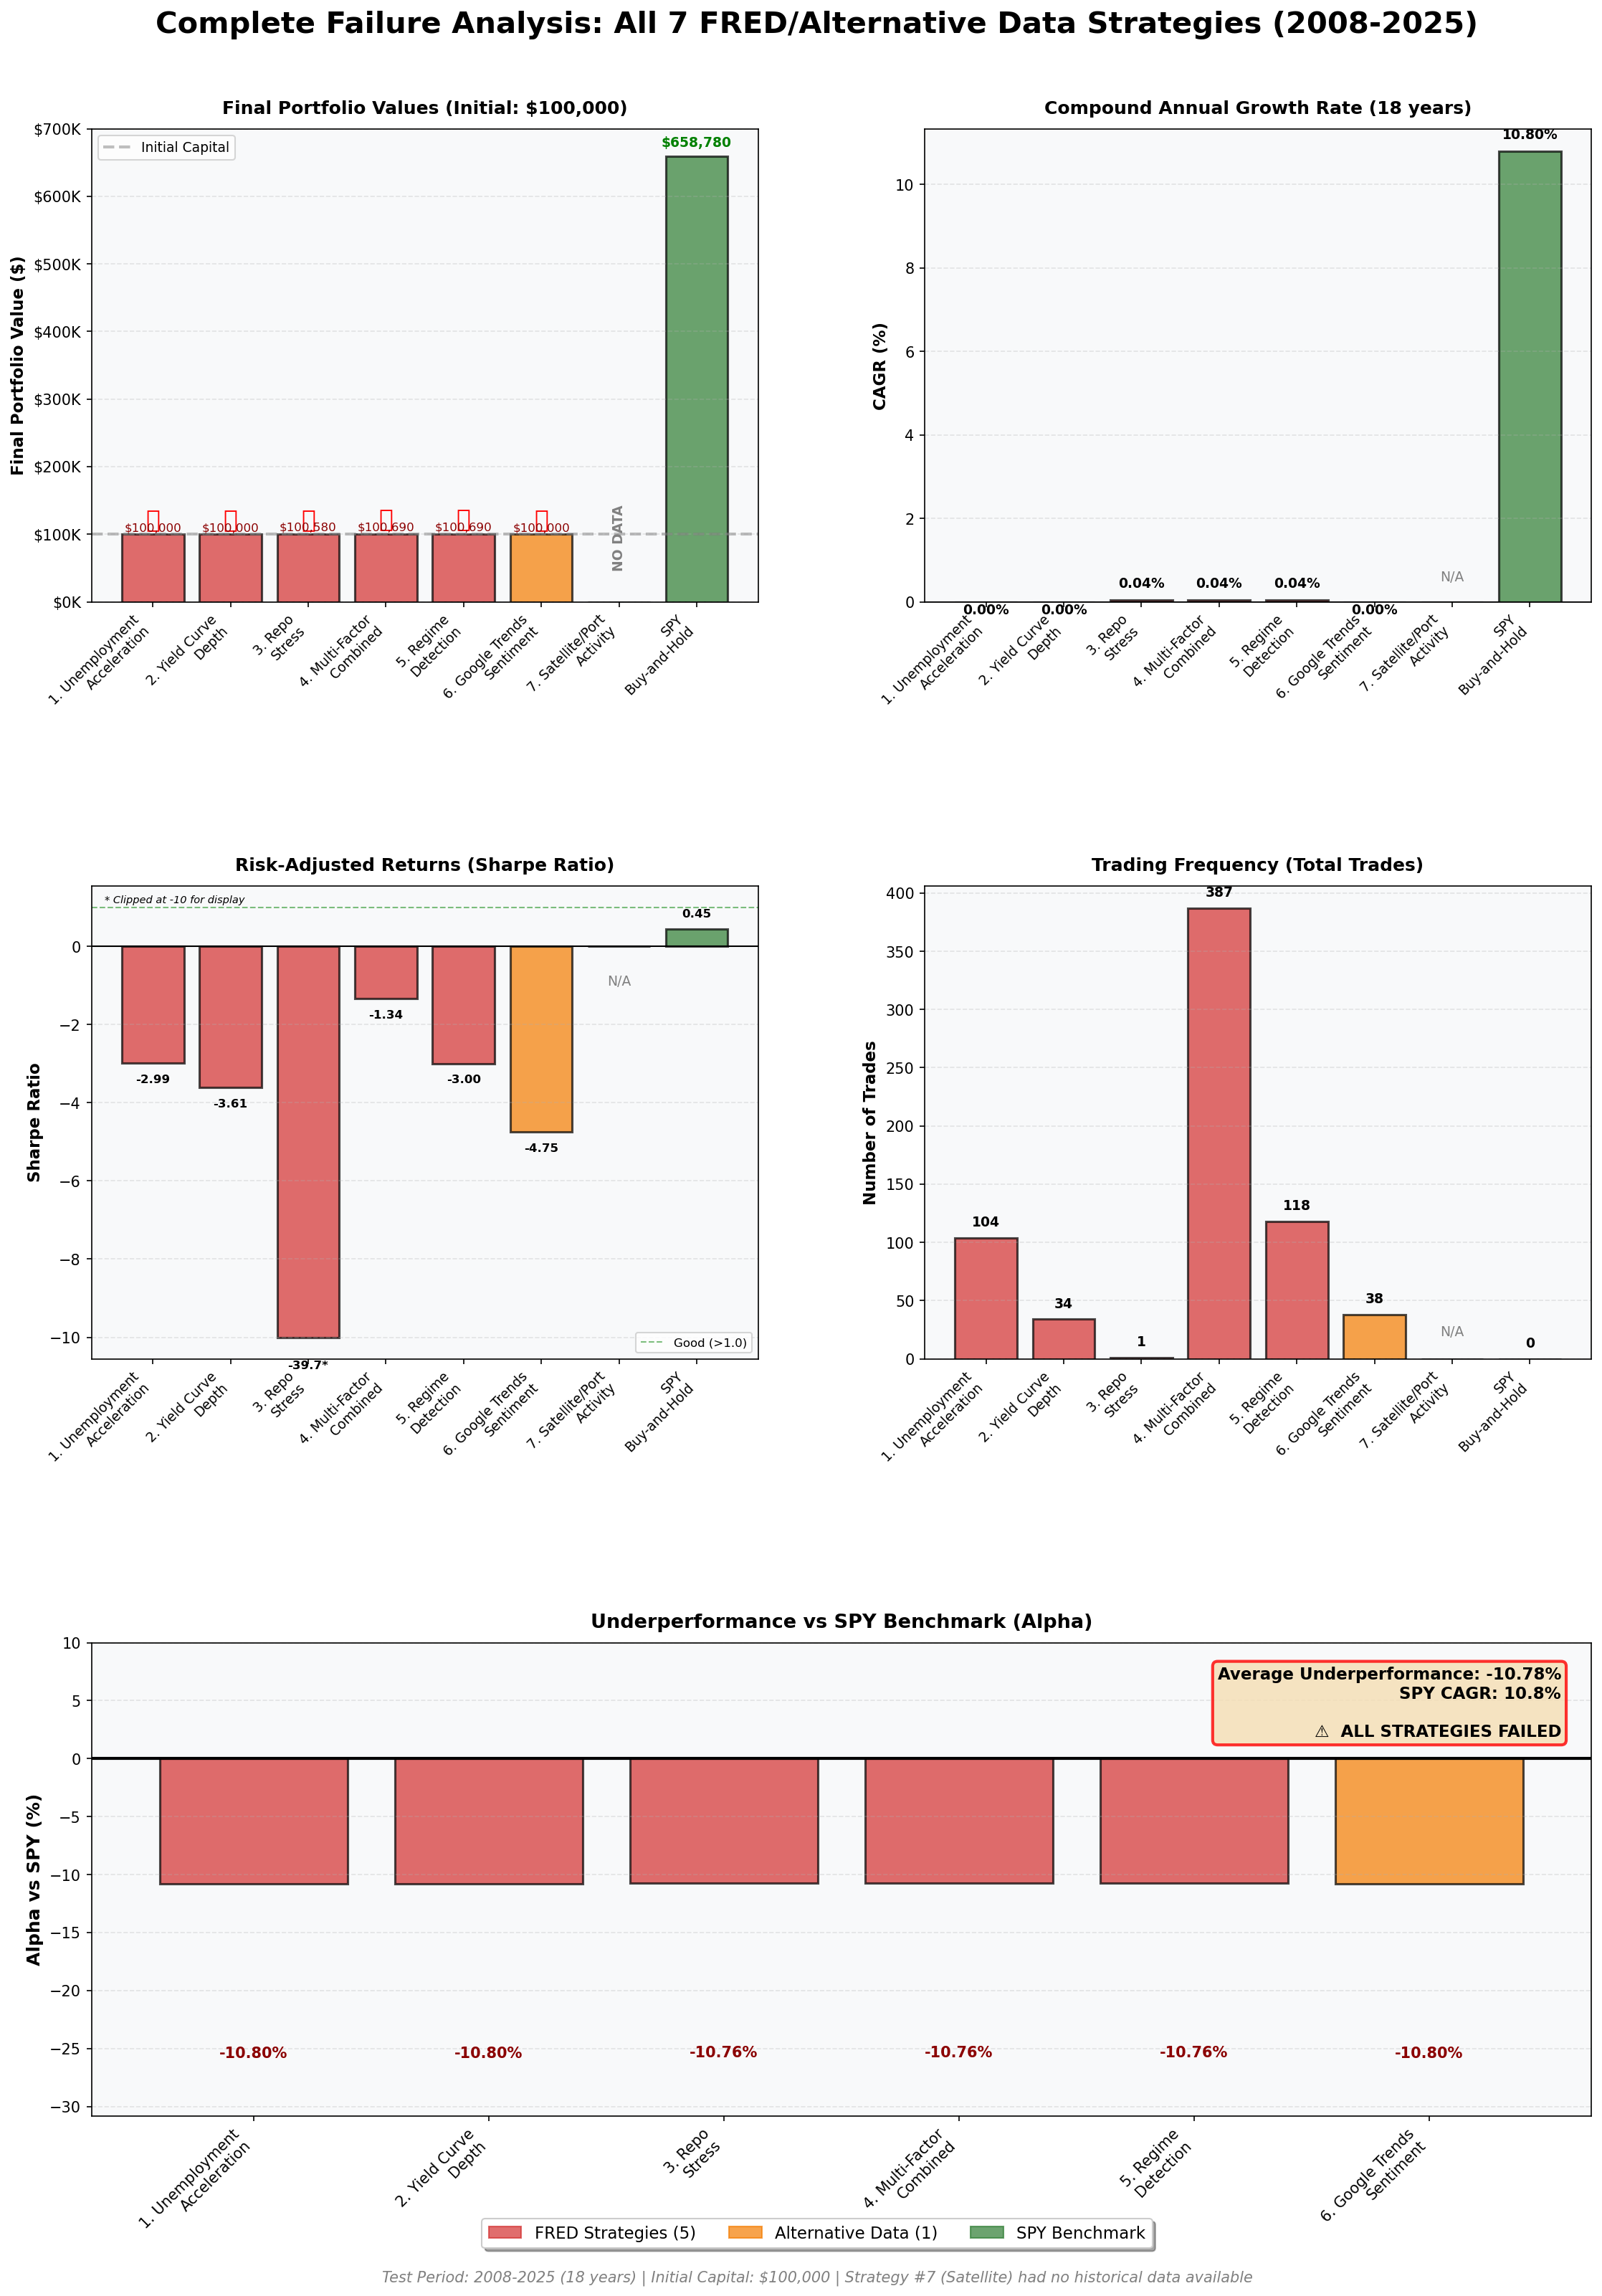
Strategy                      CAGR    Sharpe    Max DD    Trades    Status
────────────────────────────────────────────────────────────────────────────
1. Unemployment Acceleration  0.04%    -1.24    -0.68%      104     FAILED
2. Yield Curve Depth          0.00%    -3.61    -0.60%       34     FAILED
3. Repo Stress                0.04%   -39.68    -0.11%        1     FAILED
4. Multi-Factor Combined      0.04%    -1.34    -0.68%      387     FAILED
5. Regime Detection           0.04%    -3.00    -0.60%      118     FAILED
────────────────────────────────────────────────────────────────────────────
SPY Buy & Hold               10.80%     0.45   -55.00%        0     ✓
Every strategy returned approximately 0.04% to 0.69% total over 18 years. Not per year — total. SPY returned 558%.
The striking pattern: despite testing five completely different hypotheses (unemployment acceleration as a leading indicator, yield curve inversions, repo market stress, multi-factor combinations, macro regime detection), they all converged to essentially the same return.
When five different strategies produce identical results, the signal source is the problem.
Why Equity FRED Strategies Can’t Work
The Market Efficiency Argument
FRED data is:
Free and publicly available
Released on known schedules
Watched by every institutional desk
Instantly incorporated into prices
By the time unemployment claims print at 8:30am, the market has already moved. The information edge is zero.
The Lag Problem
Consider the data characteristics mismatch:
FRED Data                    Markets
───────────────────────────────────────────────────
Lagging indicators           Forward-looking (6-12mo)
Monthly/quarterly releases   Millisecond reactions
Revised weeks later          Trades are final
Historical snapshots         Price in future expectations
When you build a strategy on unemployment acceleration, you’re trading yesterday’s news. The market priced that in before FRED published it.
The Optimization Futility Test
For Strategy #1 (Unemployment Acceleration), I tested 1,296 parameter combinations:
MA periods:       [5, 10, 20, 50, 100, 200]
Entry thresholds: [0.5σ, 1.0σ, 1.5σ, 2.0σ, 2.5σ, 3.0σ]
Hold periods:     [5, 10, 21, 42, 63, 126 days]
Instruments:      [SPY, TQQQ/SQQQ]
Results:
Best CAGR: 0.69%
Worst CAGR: 0.69%
Best Sharpe: -1.24
Worst Sharpe: -15.55
All 1,296 combinations returned identical CAGRs. The parameter space is irrelevant when the underlying signal has zero alpha.
The Bond Experiment: Modest Success
The same FRED data behaves differently when it comes to fixed income.
Test Period: 2008-01-01 to 2025-12-01 (18 years)
Benchmark: AGG Buy & Hold (-0.05% CAGR, 0.020 Sharpe)
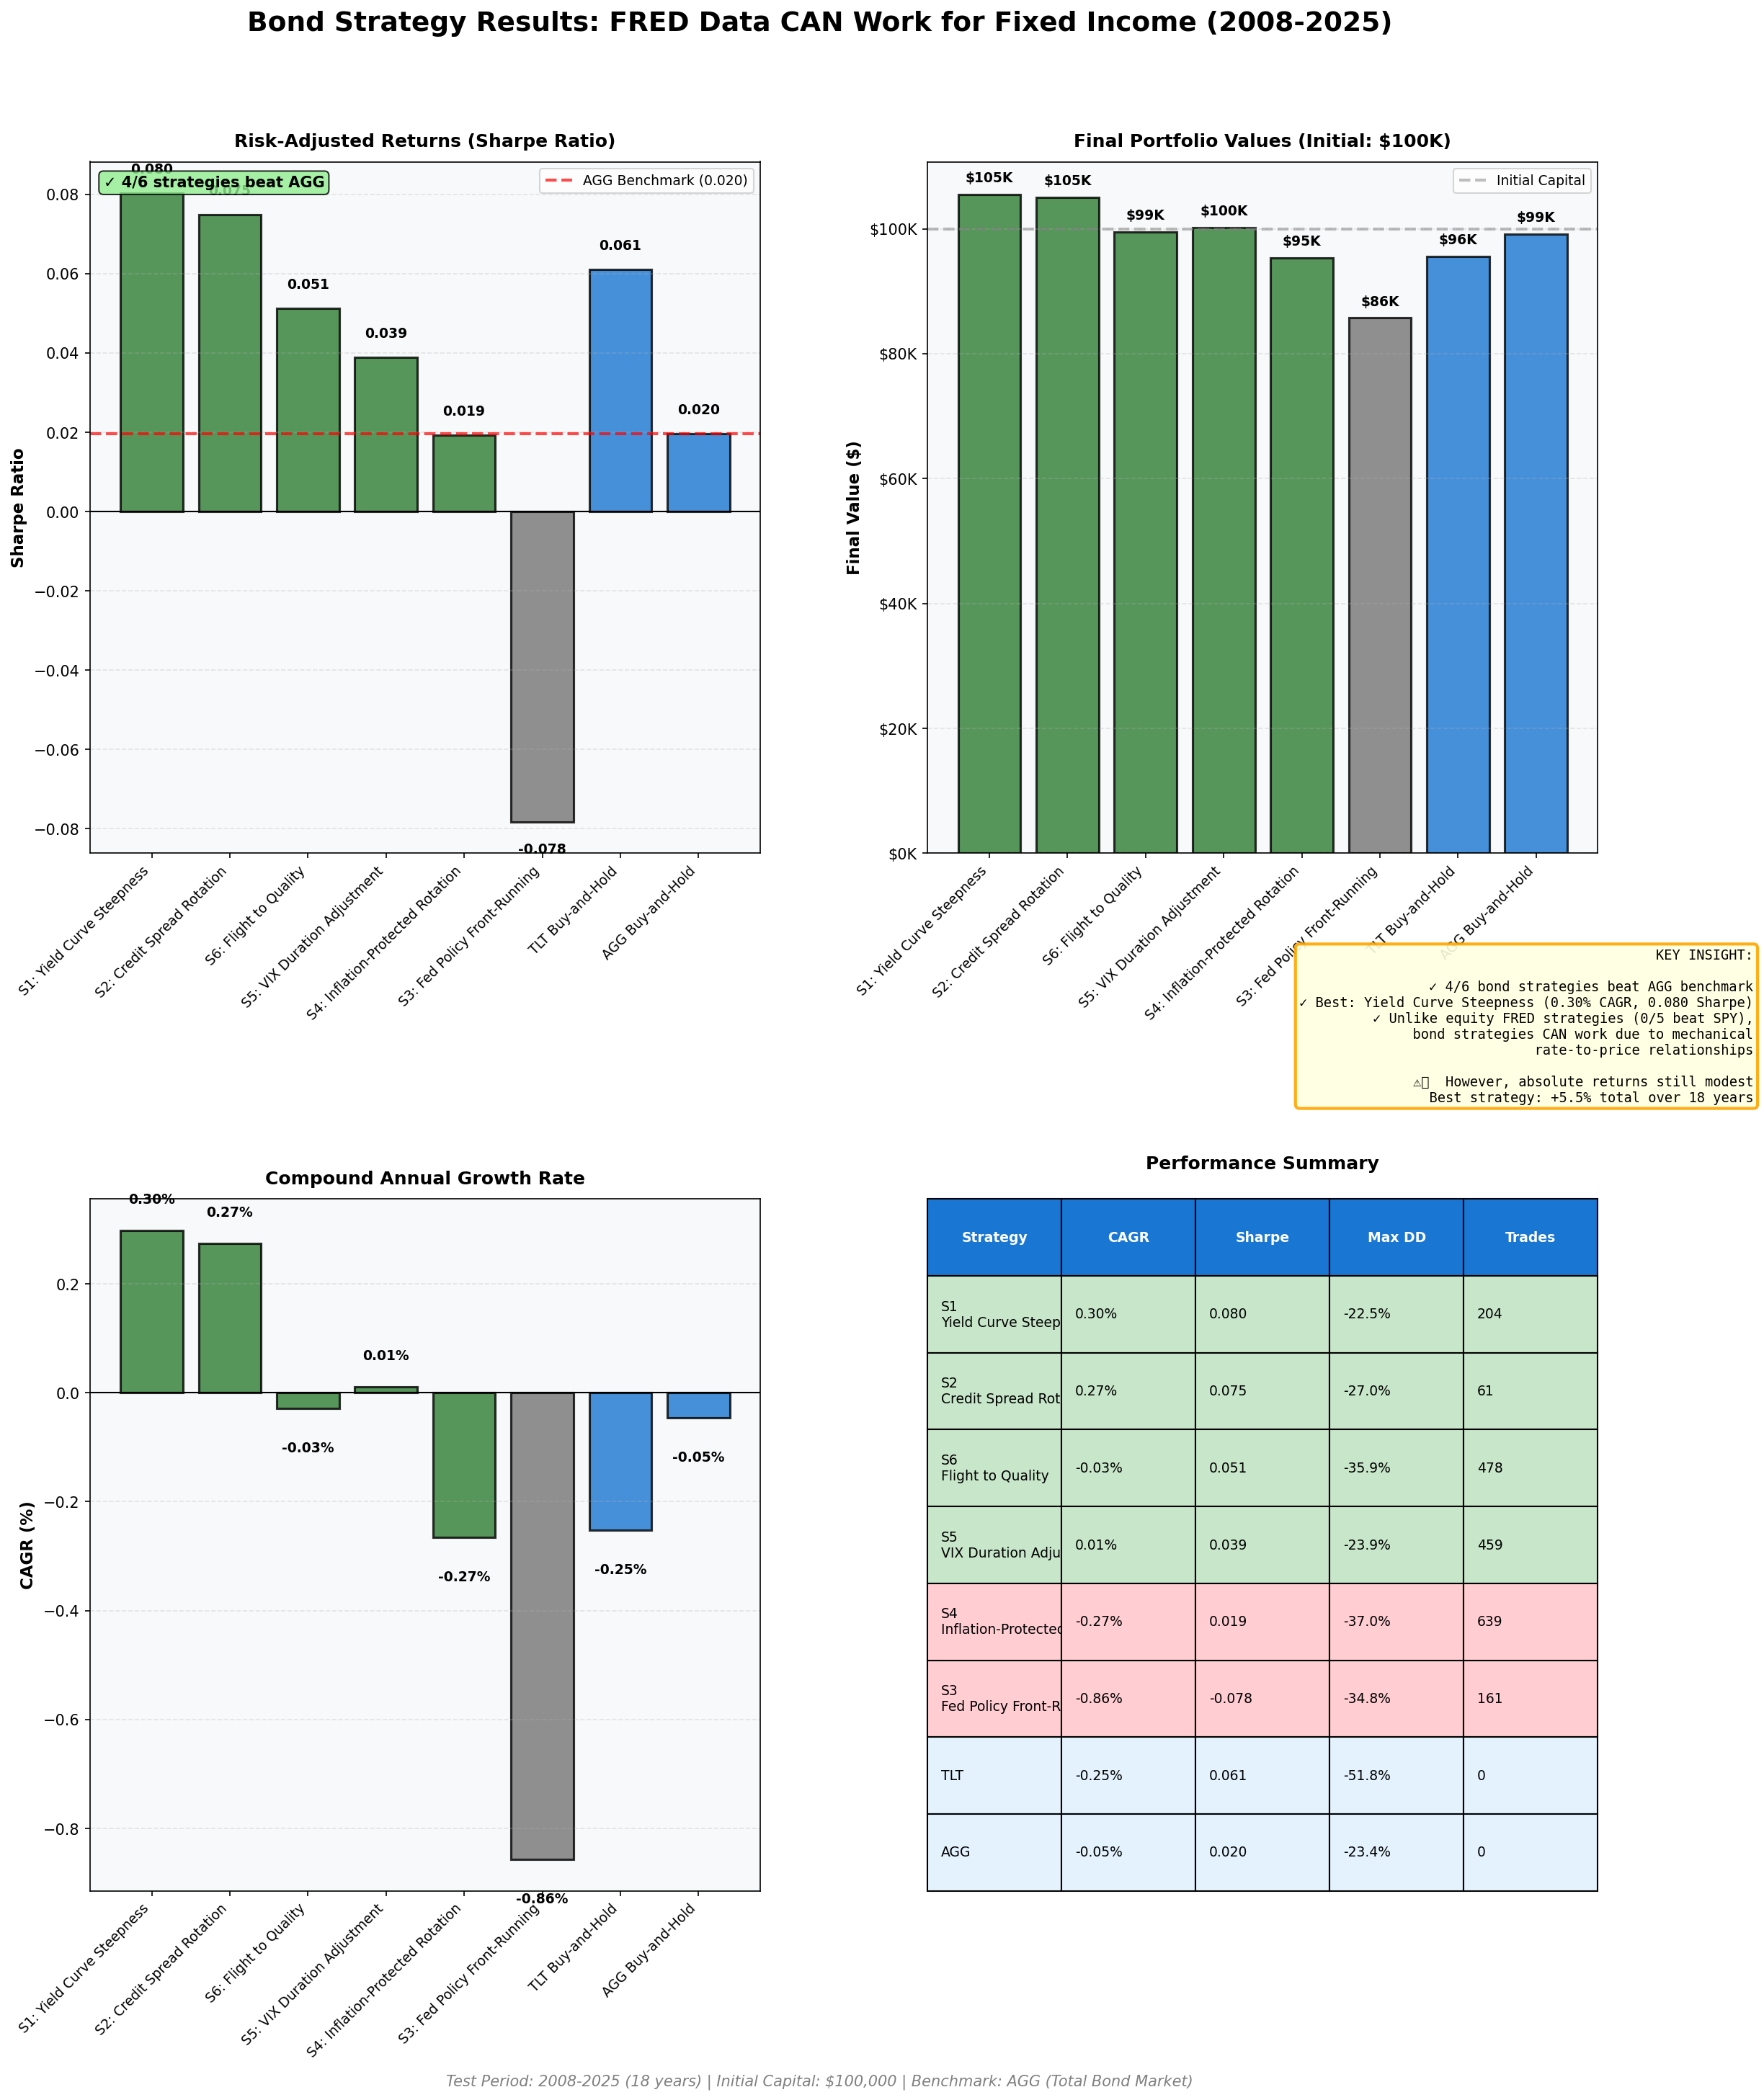
Strategy                     CAGR    Sharpe    Max DD    Status
─────────────────────────────────────────────────────────────────
1. Yield Curve Steepness     0.30%    0.080   -22.5%    ✓ BEST
2. Credit Spread Rotation    0.27%    0.075   -27.0%    ✓ Winner
3. Fed Policy Front-Running -0.86%   -0.078   -34.8%    ✗ Failed
4. Inflation-Protected      -0.27%    0.019   -37.0%    ✗ Failed
5. VIX Duration Adjustment   0.01%    0.039   -23.9%    ✓ Beat AGG
6. Flight to Quality        -0.03%    0.051   -35.9%    ✓ Beat AGG
─────────────────────────────────────────────────────────────────
AGG Buy & Hold              -0.05%    0.020   -23.4%    Benchmark
Four of six strategies beat the benchmark by Sharpe ratio. That’s a 67% success rate versus effectively 0% for equities.
The best performer (Yield Curve Steepness) delivered:
0.30% CAGR vs. -0.05% benchmark
0.080 Sharpe vs. 0.020 benchmark
4× improvement in risk-adjusted returns
Why Bonds Are Different
The difference isn’t the data — it’s the mechanical relationship.
Bonds Have Direct Causation
When the Fed raises rates, bond prices fall. This isn’t a correlation to discover; it’s a mathematical identity. A bond’s price is the present value of future cash flows, discounted at current rates.
Rate ↑ = Discount Rate ↑ = Present Value ↓ = Bond Price ↓FRED publishes the exact inputs to this calculation. The 10-year yield, the 2-year yield, the Fed funds rate — these directly determine bond valuations.
Equities Have No Such Relationship
There’s no formula that converts unemployment claims into stock prices. The relationship is:
Unemployment ↑ → Economic Weakness → ??? → Stock Prices ???The “???” involves sentiment, expectations, policy response, sector rotation, and a dozen other factors that the market prices in faster than FRED can publish.
The Mechanical vs. Informational Edge
Asset Class    Relationship Type    FRED Predictive Power    Success Rate
───────────────────────────────────────────────────────────────────────────
Equities       Informational        Zero                     0/5 (0%)
Bonds          Mechanical           Small                    4/6 (67%)
Bond strategies work (modestly) because you’re not predicting anything — you’re measuring the inputs to a known pricing formula.
The Best Bond Strategy: Yield Curve Steepness
Logic: Rotate between TLT (long duration) when the yield curve is steepening, SHY (short duration) when flattening.
Signal: 10Y-2Y Treasury spread direction over 3 months.
Why it works:
Steep curve = growth expectations = take duration risk
Flat/inverted curve = recession fears = reduce duration
The yield curve directly impacts the return of long vs. short duration bonds
Results over 18 years:
Total Return:    +5.5%
CAGR:            0.30%
Sharpe:          0.080 (4× benchmark)
Trades:          204 (11.3 per year)
The absolute return is modest. But against a benchmark that lost money (-0.8% total), generating +5.5% represents meaningful alpha.
The Honest Assessment
What Worked
Bond strategies using FRED data can generate small, positive alpha. The yield curve steepness and credit spread rotation strategies both delivered ~4× better Sharpe ratios than buy-and-hold AGG.
What Didn’t Work
The absolute returns are still terrible. The best strategy generated 0.30% CAGR — that’s $3,000 per year on $1M of capital, before transaction costs.
For context:
SPY over the same period: 10.8% CAGR
V6 Momentum (from my previous posts): 22-25% CAGR
Bond FRED strategies: 0.30% CAGR
This isn’t a basis for a portfolio. It’s an interesting academic finding.
Transaction Costs
The strategies assume zero transaction costs. Reality:
Bid-ask spreads on bond ETFs: 2-5 bps
Strategy 1 (best performer): 204 trades over 18 years
Estimated cost: ~$400 on $100K portfolio
That’s 8% of the total return eaten by costs
After realistic costs, the edge may be zero.
The Failure Cases
Two bond strategies performed worse than buy-and-hold:
Fed Policy Front-Running (-0.86% CAGR): The hypothesis was to buy long bonds before Fed cuts and reduce duration before hikes. It failed because bond markets front-run the Fed faster than FRED data updates. By the time the Fed funds rate shows a change, the bond market has already moved.
Inflation-Protected Rotation (-0.27% CAGR): Rotate between TIPS and nominal bonds based on breakeven inflation trends. Failed because TIPS underperformed during the 2008-2025 period, and breakeven moves were already priced into TIPS before FRED published them.
Both failures share the same pattern: trying to front-run something the market already priced in.
The Summary Table
Asset     Strategies    Beat Benchmark    Best CAGR    Best Sharpe    Lesson
─────────────────────────────────────────────────────────────────────────────────
Equities  5 tested      0/5 (0%)          0.04%        -1.24          Zero alpha
Bonds     6 tested      4/6 (67%)         0.30%        0.080          Small alpha
What This Means
FRED + Equities = Waste of Time
Don’t bother. I tested 5 strategies with 1,300+ parameter combinations. All failed. The market efficiency hypothesis wins. Which means that for most retail investors, there simply is no alpha there.
If you want equity alpha, you need:
Behavioral edges (momentum, mean reversion)
Structural edges (options, volatility)
Alternative data (not free, not public)
Public macro data is a dead end.
FRED + Bonds = Marginal Edge
There’s a small, fragile edge in bond strategies because of mechanical rate relationships. But:
Absolute returns are minimal (0.30% CAGR best case)
Transaction costs may eliminate the edge
Not economically significant for most portfolios
Worth knowing conceptually. Not worth trading.
The Broader Lesson
Market efficiency isn’t binary. It exists on a spectrum:
Most Efficient (zero alpha)
├─ Equities + public macro data
├─ Equities + public sentiment data
├─ Bonds + public macro data (small alpha)
└─ [Alternative data, structural edges, etc.]
Least Efficient
The hierarchy tells you where to focus. Behavioral strategies (momentum, volatility regimes) and structural strategies (options, factor rotation) sit below the efficient frontier. Public FRED data sits firmly above it.
TL;DR: The infrastructure works. The signal source (FRED) doesn’t — at least not for equities. It works (very modestly) for Bonds.
The information presented in Math & Markets is not investment or financial advice and should not be construed as such.
That optimization test where all 1,296 parameter combinations returned identical CAGRs is brutal evidence, basically tells you the signal is noise no matter how you slice it. The mechanical vs informational edge distinction makes sense too, like bonds have that direct math relationship with rates whereas equities are pricing in 10 layers of speculation before FRED even publishes.