
Building a Smarter Hedge: Why Delta Alone Isn’t Enough
Part 50 is about building tools, not just strategies

This is part 50 of my series — Building & Scaling Algorithmic Trading Strategies
This is a follow-up to my previous post on delta, fat tails, and the volatility smirk.
This post aims to answer one question: if the relationship between delta and expected value is this complicated, how do you actually use this information to trade better?
For most traders, they do it manually and inconsistently. Check the VIX, glance at skew, and make a gut call about whether to buy protection. That’s not systematic or analytical.
So this post is about building a tool to fix that.
The Problem With Simple Delta-Based Hedging
Most retail traders approach hedging like this:
Calculate portfolio delta
Decide how much to hedge (50%? 75%?)
Buy puts at some arbitrary delta (0.30? 0.20?)
Hope it works
This ignores everything we discussed in the last post. You’re not asking:
Is the skew steep or flat right now? Am I buying expensive or cheap protection?
What’s the VRP at this strike? Am I overpaying relative to realized vol?
Would a spread be better given current skew?
Is there a ratio structure that gives me crash convexity at lower cost?
The goal is to build a screener that asks these questions automatically and recommends hedges that are attractively priced given current market conditions.
What the Screener Should Do
Input: Your portfolio (stocks and/or options positions)
Analysis:
Calculate aggregate delta exposure
Convert to SPY-equivalent units (beta-weighted)
Pull the current volatility surface for relevant underlyings
Compare current skew and VRP to historical ranges
Output: Ranked hedge recommendations with rationale
The key insight is that not all hedges are equal. A 0.20 delta put might be overpriced when skew is in the 90th percentile, but attractively priced when skew is in the 20th percentile. The screener should know the difference.
The Math Behind Hedge Scoring
Here’s the scoring framework I’m planning to implement.
Cost Efficiency
The simplest metric: how much protection am I getting per dollar spent?
cost_efficiency = protection_level / premium_cost

where:
  protection_level = strike / spot_price (e.g., 0.95 = 5% OTM)
  premium_cost     = option price as % of notional
This alone isn’t enough, because a cheap option might be cheap for a reason.
Skew Attractiveness
Current skew relative to its historical range tells you whether downside protection is expensive or cheap.
skew_slope = (IV_10Δput - IV_ATM) / IV_ATM

skew_percentile = percentile_rank(current_skew, last_252_days)
If skew is in the 90th percentile, puts are expensive. If it’s in the 10th percentile, they’re cheap. The screener should prefer buying protection when skew is low and avoid it (or use spreads) when skew is high.
Volatility Risk Premium
VRP measures whether options are expensive relative to realized volatility:
VRP = IV_30day - realized_vol_30dayHistorically, VRP averages around 3-4% for SPY. When VRP is elevated (say, 6%+), you’re paying a lot for protection. When it’s compressed or negative, options are relatively cheap.
Combined Score
The final score weights these components:
score = w₁ × cost_efficiency + w₂ × (1 - skew_pctl) + w₃ × (1 - vrp_normalized)

where:
  w₁ = 0.30 (cost weight)
  w₂ = 0.35 (skew weight)
  w₃ = 0.35 (vrp weight)
Higher score = more attractive hedge. The weights are tunable—if you care more about cost, increase w₁.
Hedge Types to Evaluate
The screener should consider multiple structures, not just simple puts.
Simple Put
Buy a put at target delta. Straightforward, liquid, but can be expensive when skew is steep.
Use when: skew percentile < 50%, need simple execution
Avoid when: skew percentile > 75%
Put Spread
Buy higher strike put, sell lower strike put. The short leg captures some of the skew premium.
Use when: skew percentile > 50%, willing to cap protection
Avoid when: need unlimited downside protection
When skew is steep, the lower strike put you’re selling is relatively more expensive, which reduces your net cost significantly.
Ratio Spread (Crash Convexity)
Sell 1× near-OTM put, buy N× far-OTM puts. The idea is that in a crash, the far-OTM puts explode in value due to gamma acceleration and IV expansion.
Example: Sell 1× 0.10Δ put, buy 5× 0.02Δ puts

Use when: want asymmetric crash protection, skew is moderate
Avoid when: skew is already very steep (long puts are expensive)
This structure can be net credit or small debit in normal markets, with massive payoff in tail scenarios.
Collar
Buy put, sell call. Uses call premium to finance the put.
Use when: IV rank is high (calls are expensive), willing to cap upside
Avoid when: expecting significant upside
Architecture
Here’s how the pieces fit together:
Portfolio Input (JSON/CSV)
         │
         ▼
┌─────────────────────┐
│  Delta Calculator   │ ──▶ Net delta, SPY-equivalent delta
└─────────────────────┘
         │
         ▼
┌─────────────────────┐
│  Vol Surface        │ ──▶ Skew, term structure, IV rank
│  Analyzer           │
└─────────────────────┘
         │
         ▼
┌─────────────────────┐
│  Historical         │ ──▶ Skew percentile, VRP estimate
│  Percentiles        │
└─────────────────────┘
         │
         ▼
┌─────────────────────┐
│  Hedge Recommender  │ ──▶ Scored recommendations
└─────────────────────┘
         │
         ▼
    CLI (Terminal) Output
Data flows from your portfolio through several analysis layers, each adding context. The recommender uses all this information to score candidate hedges.
What the Output Looks Like
PORTFOLIO SUMMARY
─────────────────────────────────────────────────
Net Delta:                   +847 shares
SPY-Equivalent Delta:        +623 ($369,000 exposure)
Largest Exposures:           NVDA (37%), AAPL (28%), MSFT (18%)

MARKET CONDITIONS
─────────────────────────────────────────────────
SPY Spot:                    $593.42
SPY 30-Day IV:               14.2%
SPY Realized Vol (30d):      11.8%
VRP Estimate:                +2.4%
Skew Percentile:             67th (moderately steep)
IV Rank:                     23rd (low vol environment)

HEDGE RECOMMENDATIONS
─────────────────────────────────────────────────

#1 [SCORE: 82] SPY 575/555 Put Spread, Jan 17 (35 DTE)
   ├─ Buy 5× SPY 575P @ $4.20
   ├─ Sell 5× SPY 555P @ $1.85
   ├─ Net Cost: $1,175 (0.32% of exposure)
   ├─ Delta Reduction: -185 (30%)
   ├─ Max Protection: $10,000 (if SPY < $555)
   └─ Rationale: Steep skew makes short leg attractive.
      Spread captures 58% of put protection at 44% of the cost.

#2 [SCORE: 74] SPY Ratio Spread, Feb 21 (70 DTE)
   ├─ Sell 1× SPY 570P @ $5.80
   ├─ Buy 5× SPY 530P @ $1.25
   ├─ Net Cost: $45 (0.01% of exposure)
   ├─ Delta Reduction: -50 (8%) in normal markets
   ├─ Crash Payoff (SPY -20%): +$14,200
   └─ Rationale: Near-zero cost for significant crash protection.
      Long puts gain 12x if SPY drops to $475.

#3 [SCORE: 68] SPY 580 Put, Jan 17 (35 DTE)
   ├─ Buy 5× SPY 580P @ $5.40
   ├─ Cost: $2,700 (0.73% of exposure)
   ├─ Delta Reduction: -210 (34%)
   └─ Rationale: Simple execution, liquid strikes.
      Higher cost due to steep skew at this strike.
The recommendations include:
Specific strikes and quantities
Cost as percentage of exposure (so you can assess drag)
Delta reduction (how much hedge do you get)
Scenario payoffs (what happens in a crash)
Rationale (why this hedge, why now)
The MVP is focused on SPY hedging only — calculating portfolio beta-weighted delta and recommending SPY puts/spreads. Single-stock hedging adds complexity (liquidity varies, skew behavior differs) that I’ll tackle in v2.
Data Challenges
The hard part isn’t the math to be honest, it’s the data.
Options chains: Yahoo Finance provides IV but not reliable greeks. I’ll calculate delta from IV using Black-Scholes, which is good enough for this purpose. But I’ll also get the Greeks from Tasty Trade to test.
Historical IV: Need to store daily snapshots to calculate percentiles. This means running a daily job to capture skew, ATM IV, etc. Without history, the percentile calculations are meaningless.
Realized volatility: Easy to calculate from price history, but need to match the same lookback window as implied vol (30 days).
For the MVP, I’m using free data (Yahoo Finance) and some Tasty. If it works, I’ll consider paid sources (ORATS, IVolatility) for better reliability.
What I’m Not Building (Yet)
Some things that would be nice but are out of scope for v1:
Greeks aggregation: Gamma, vega, theta exposure across the portfolio
Correlation-adjusted hedging: Accounting for correlations between positions
Backtesting: How would these hedges have performed historically?
Execution integration: Actually placing the trades through a broker API
Real-time alerts: “Skew just hit 90th percentile, consider adding protection”
These are all valuable, but the MVP needs to work first.
The Bigger Picture
This screener is really about one thing: turning qualitative intuition into quantitative signals.
“Skew feels steep” becomes “skew is in the 78th percentile.”
“Options seem expensive” becomes “VRP is 4.2%, above the 65th percentile.”
“Maybe I should hedge” becomes “your portfolio has $400K of unhedged SPY-equivalent delta, and protection is currently cheap.”
The goal isn’t to automate decision-making—it’s to make sure I’m asking the right questions before making decisions. Delta alone isn’t enough. The full picture includes skew, VRP, term structure, and how all of these compare to historical norms.
Case Study: Applying This to an Actual Portfolio
Let’s see how this framework applies to real positions. Here’s a sample portfolio, inspired by parts of my play port:
Stock Positions
600 SPY @ $681.76 = $409,056
200 BRK-B @ $499.52 = $99,904
Total stocks: $508,960
Options Positions
Short puts (sold for premium):
2× SPY $600 (Jan 2026)
1× SPY $500 (Jun 2027)
1× BRK-B $485 (Jan 2026)
Long puts (tail protection):
2× SPY $500 (Jan 2027)
Current Delta Profile
Net Delta: +836
SPY-Equivalent Delta: +723
Dollar Exposure: ~$493,000
What the Vol Surface Analysis Shows
I pulled the current volatility metrics for SPY:
Skew Slope (10Δ vs ATM): 60.9%
- 10Δ Put IV: 19%
- ATM IV: 12%
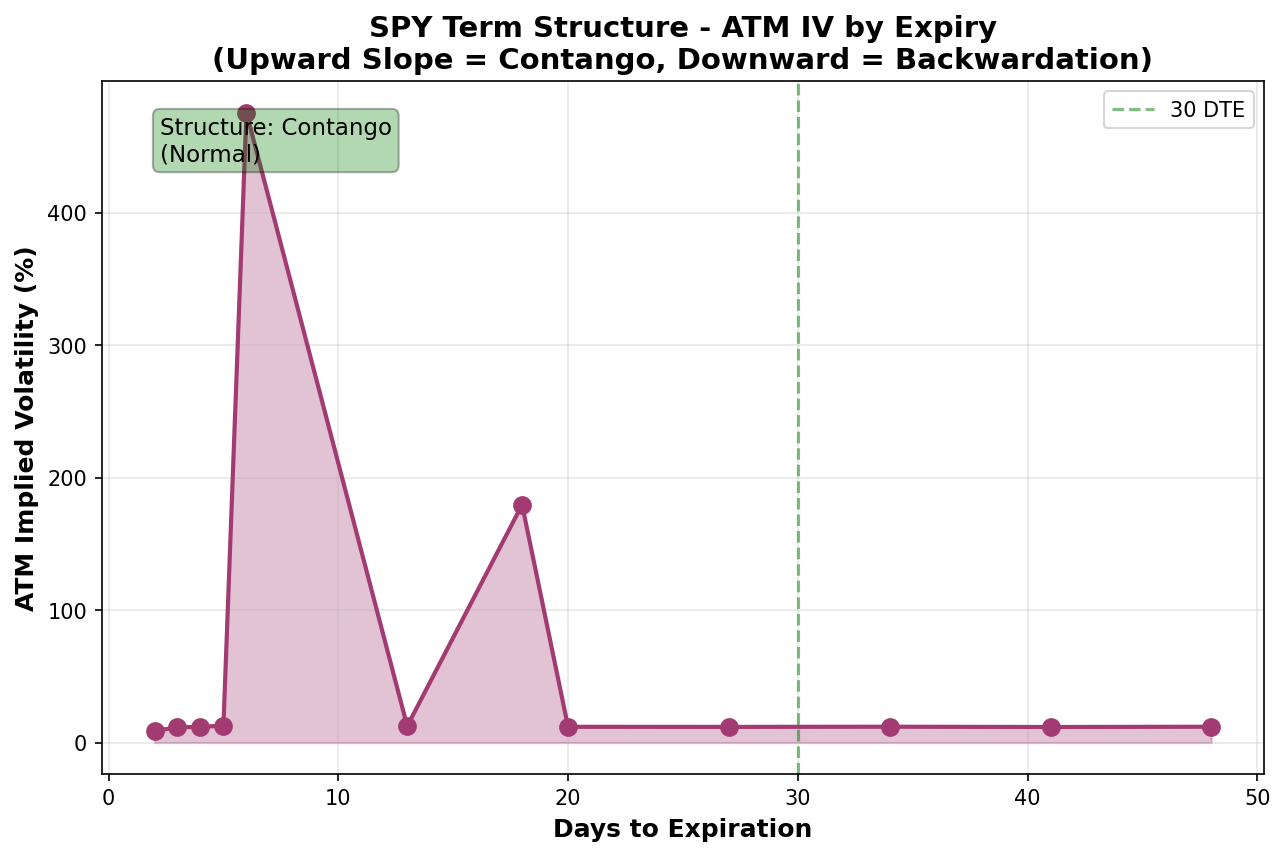
Term Structure: Contango (normal)
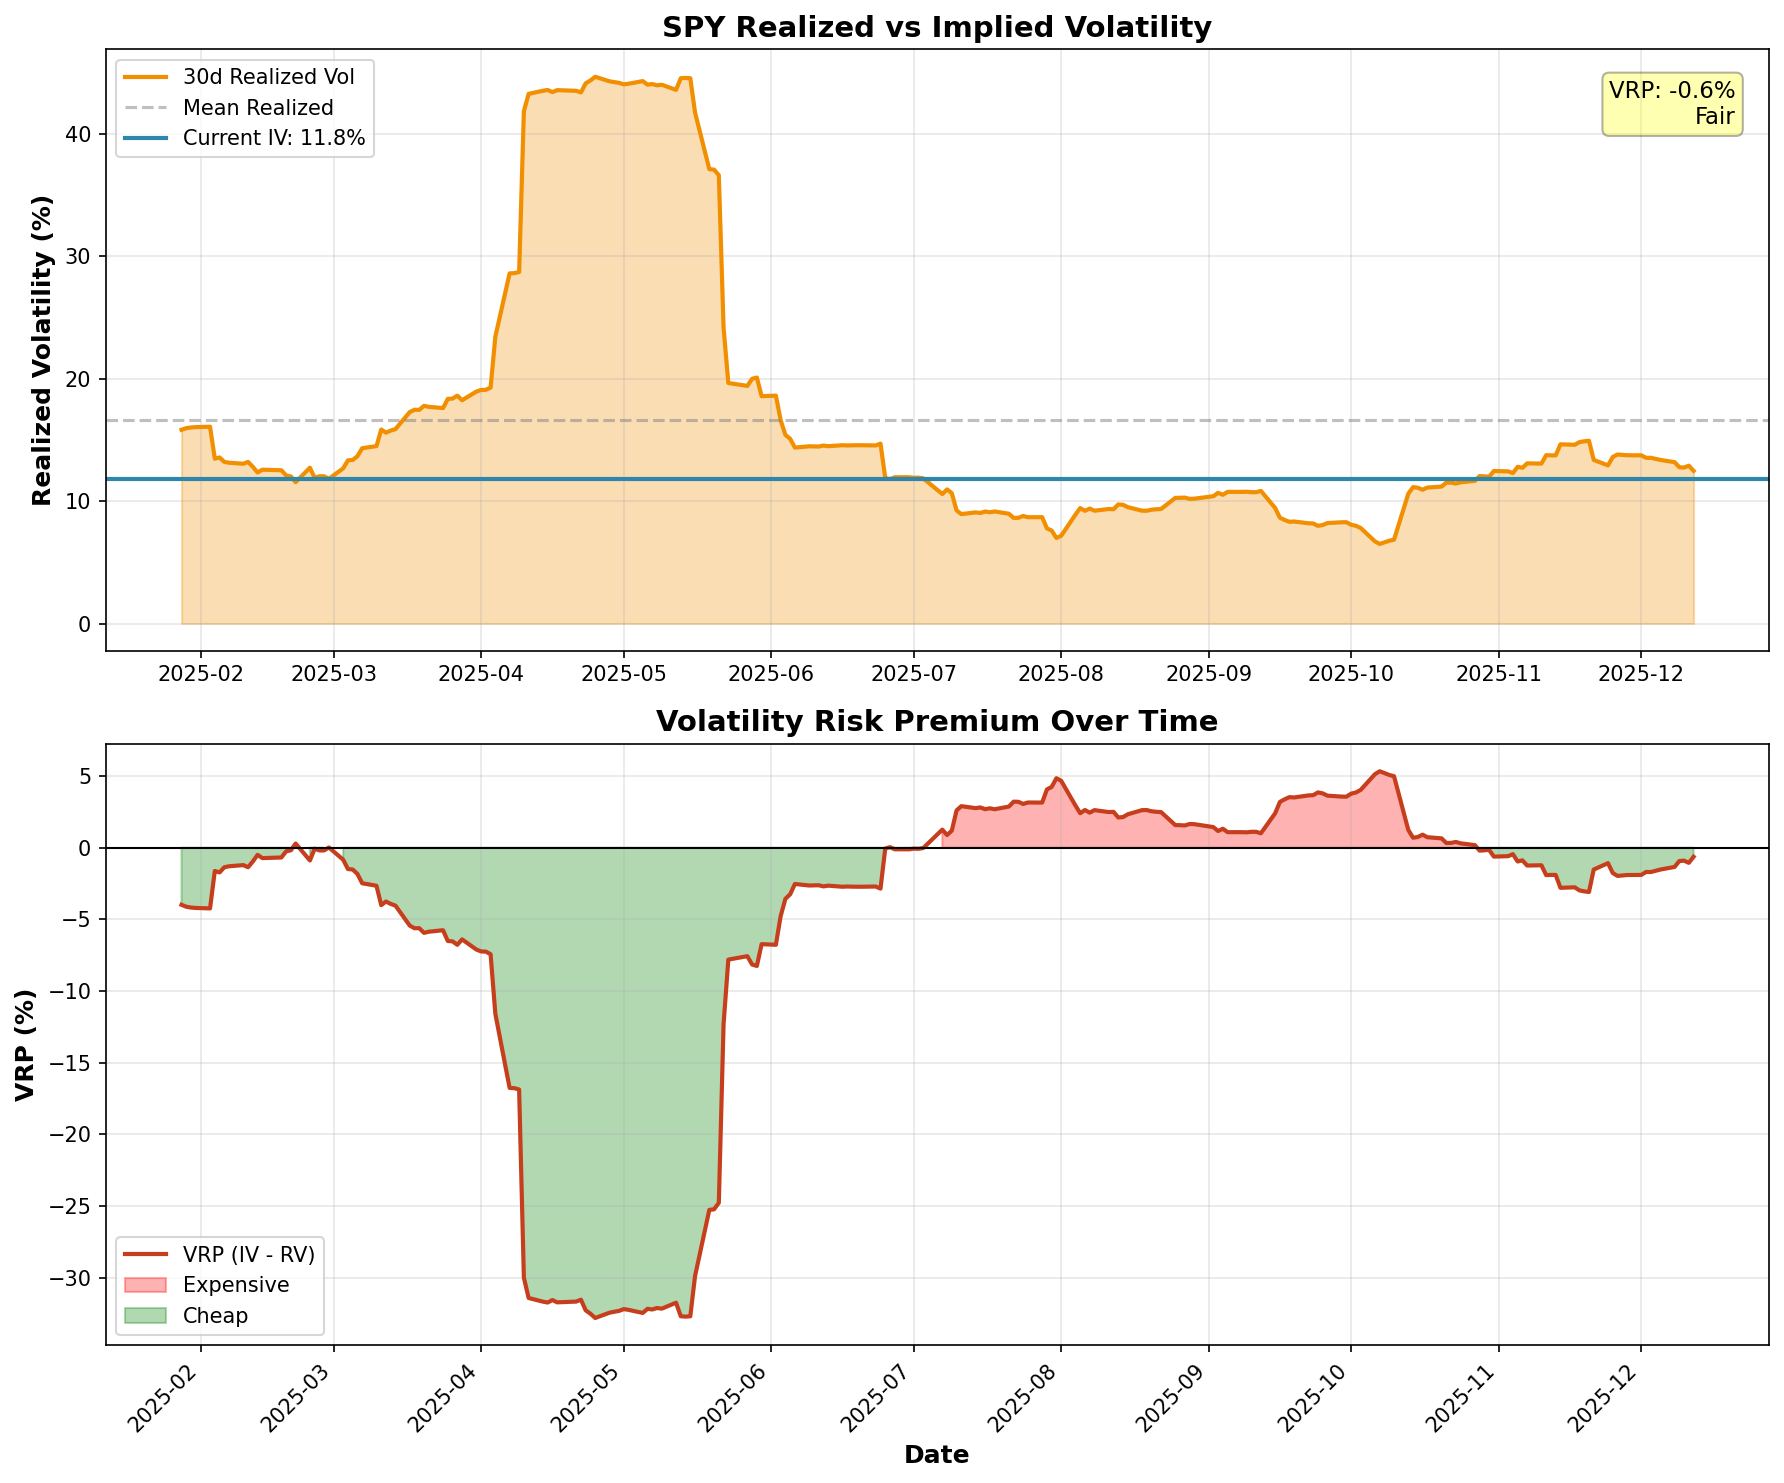
VRP Estimate: -0.6% (neutral)Let’s break down what this actually means.
The Positive
The 60.9% skew slope is steep. This benefits the short puts because you are collecting elevated premium — the market is paying up for downside protection, and you’re the one selling it. The $600 strike short puts are benefiting from this skew premium.
Term structure in contango confirms we’re in a normal market regime. No stress signals. This is the environment where premium selling strategies tend to work.
The Honest Assessment
Here’s where I need to be objective about my own positions:
The short $600 puts are closer to the money than they feel. With SPY at $682, these are only 12% OTM. A 15% drawdown puts you at assignment. This isn’t catastrophic — I mean I’d be okay owning more SPY at $600 — but one ought to be clear-eyed that this is a “buy the dip with leverage” position, not a “safe premium collection” position.
The long $500 puts are deep OTM tail protection. SPY needs to drop 27% before these have intrinsic value. That’s 2008/2020 territory. They’ll lose value in any normal drawdown. The $15k cost (roughly) is insurance against catastrophe, not protection against garden-variety corrections.
VRP at -0.6% is neutral. You are not getting a great deal on protection, but you are not overpaying either. The skew is where the action is, not the overall level of IV.
High correlation between positions. SPY and BRK-B are going to move together in any broad market selloff. This isn’t really a diversified portfolio from a crash-protection standpoint—it’s concentrated US large cap.
How the Screener Evaluates This
PORTFOLIO SUMMARY
─────────────────────────────────────────────────
Net Delta:                   +836
SPY-Equivalent Delta:        +723 ($493,000 exposure)
Existing Hedges:             2× SPY $500P (Jan 2027)
Current Protection Level:    Kicks in at -27% (catastrophic only)

MARKET CONDITIONS
─────────────────────────────────────────────────
SPY 30-Day IV:               12%
SPY 10Δ Put IV:              19%
Skew Slope:                  60.9% (73rd percentile - elevated)
VRP Estimate:                -0.6% (neutral)
Term Structure:              Contango (normal regime)

ASSESSMENT
─────────────────────────────────────────────────
⚠️  Gap in protection: No hedge between current price and -27%
⚠️  Short $600 puts add risk in 10-20% drawdown zone
✓  Tail protection in place for >25% crashes
✓  Collecting elevated premium from steep skew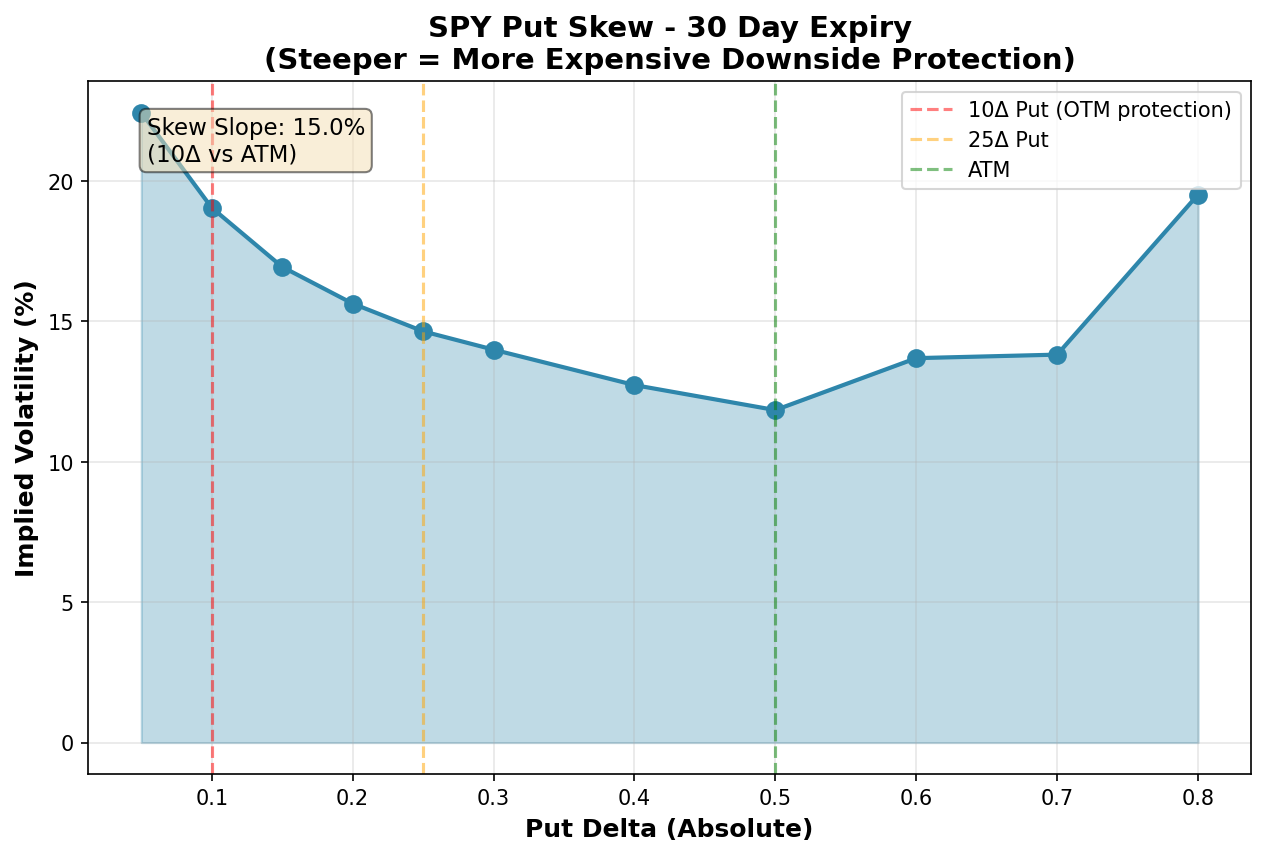
Screener Recommendations
Given the steep skew (73rd percentile), the screener flagged that simple put purchases are expensive right now. Instead, it suggested structures that exploit the skew:
Recommendation #1: Put Spread to Fill the Gap
Buy 2× SPY $650P (Mar 2025)
Sell 2× SPY $620P (Mar 2025)

Rationale: Fills the protection gap between -5% and -12%
           Steep skew makes the short $620 leg attractive
           Net cost reduced by ~40% vs naked $650 puts
This addresses the main vulnerability: you have tail protection (the $500 puts) and collecting premium, but a 15% correction would hurt and you’d be forced to buy more SPY via put assignment right as the market is falling.
Recommendation #2: Collar on BRK-B
Buy 1× BRK-B $475P (Jan 2026)
Sell 1× BRK-B $540C (Jan 2026)

Rationale: BRK-B has no hedge currently
           Call premium finances put (near zero cost)
           Caps upside at ~8% but adds downside protection
BRK-B is 20% of the stock exposure with zero dedicated protection. A collar makes sense if you don’t have strong conviction on BRK-B outperformance.
Recommendation #3: Roll Short Puts Higher (If Skew Compresses)
IF skew_percentile drops below 40%:
   Roll 2× SPY $600P → 2× SPY $640P

Rationale: Lower skew = less premium for OTM puts
           Move strikes up to maintain premium level
           Accept higher assignment risk for better yield
This is a conditional recommendation. Right now skew is elevated, so the $600 puts are collecting good premium. If skew compresses, we’d want to adjust.
What You Might Actually Do
So this is where subjectivity comes in. For instance, if it were up to me, I wouldn’t really add the put spread right now.
The 60.9% skew means you’d be buying expensive protection (even with the spread)
The short $600 puts are a form of “hedge” — if assigned, you are buying SPY at a 12% discount to current prices
The tail protection ($500 puts) covers the catastrophic scenario you’re most worried about
VRP is neutral, so there’s no urgency to act
What you can do instead:
Monitor skew. If it drops below 40% (25th percentile), you can add the put spread while protection is cheap.
Monitor VRP. If it goes negative beyond -3%, that’s a signal to add protection.
Monitor term structure. If it inverts to backwardation, that’s a stress signal and I’ll reduce short put exposure.
I’m not looking to the screener to tell me what to trade right now; but rather to tell me what conditions would make certain trades attractive.
TL;DR / BLUF / Meta etc.
Building this analysis manually took me about an hour. The screener should do it in seconds and track the metrics daily.
So based on the portfolio above, the screener qualifies the following trade-offs:
Collecting premium in a steep-skew environment
Protected against catastrophic tail risk
Vulnerable to 10-20% corrections ⚠️
Concentrated in correlated US large cap ⚠️
Remember: Alpha is never guaranteed. And the backtest is a liar until proven otherwise.
Options and derivatives are complex instruments and not suitable for all investors. This analysis probably contains errors — if you find them, let me know.
The material presented in Math & Markets is for informational purposes only. It does not constitute investment or financial advice.