
Building a Put Credit Spread Scanner
Part 38 is about building a Put Credit Scanner to automate the filtering and hedging process

This is part 38 of my series — Building & Scaling Algorithmic Trading Strategies
So I spent most of Thanksgiving in a food coma, but whatever free time I had, I spent it trying to build a systematic options scanner.
It checks nine filters, pulls live Greeks from Tastytrade’s API, and tracks positions in a CSV file.
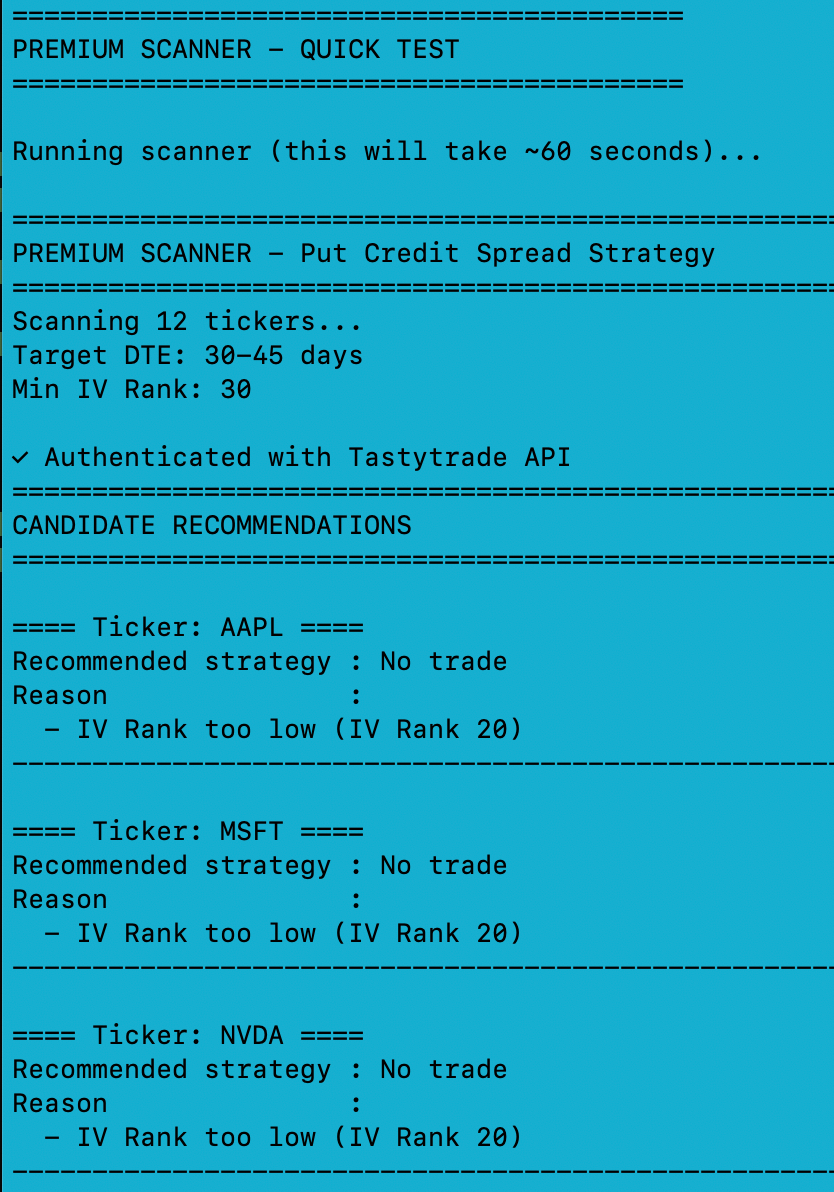
My goal was simple: I’d ask the script for candidate recommendations and it would filter through my list and criteria and give me an answer.
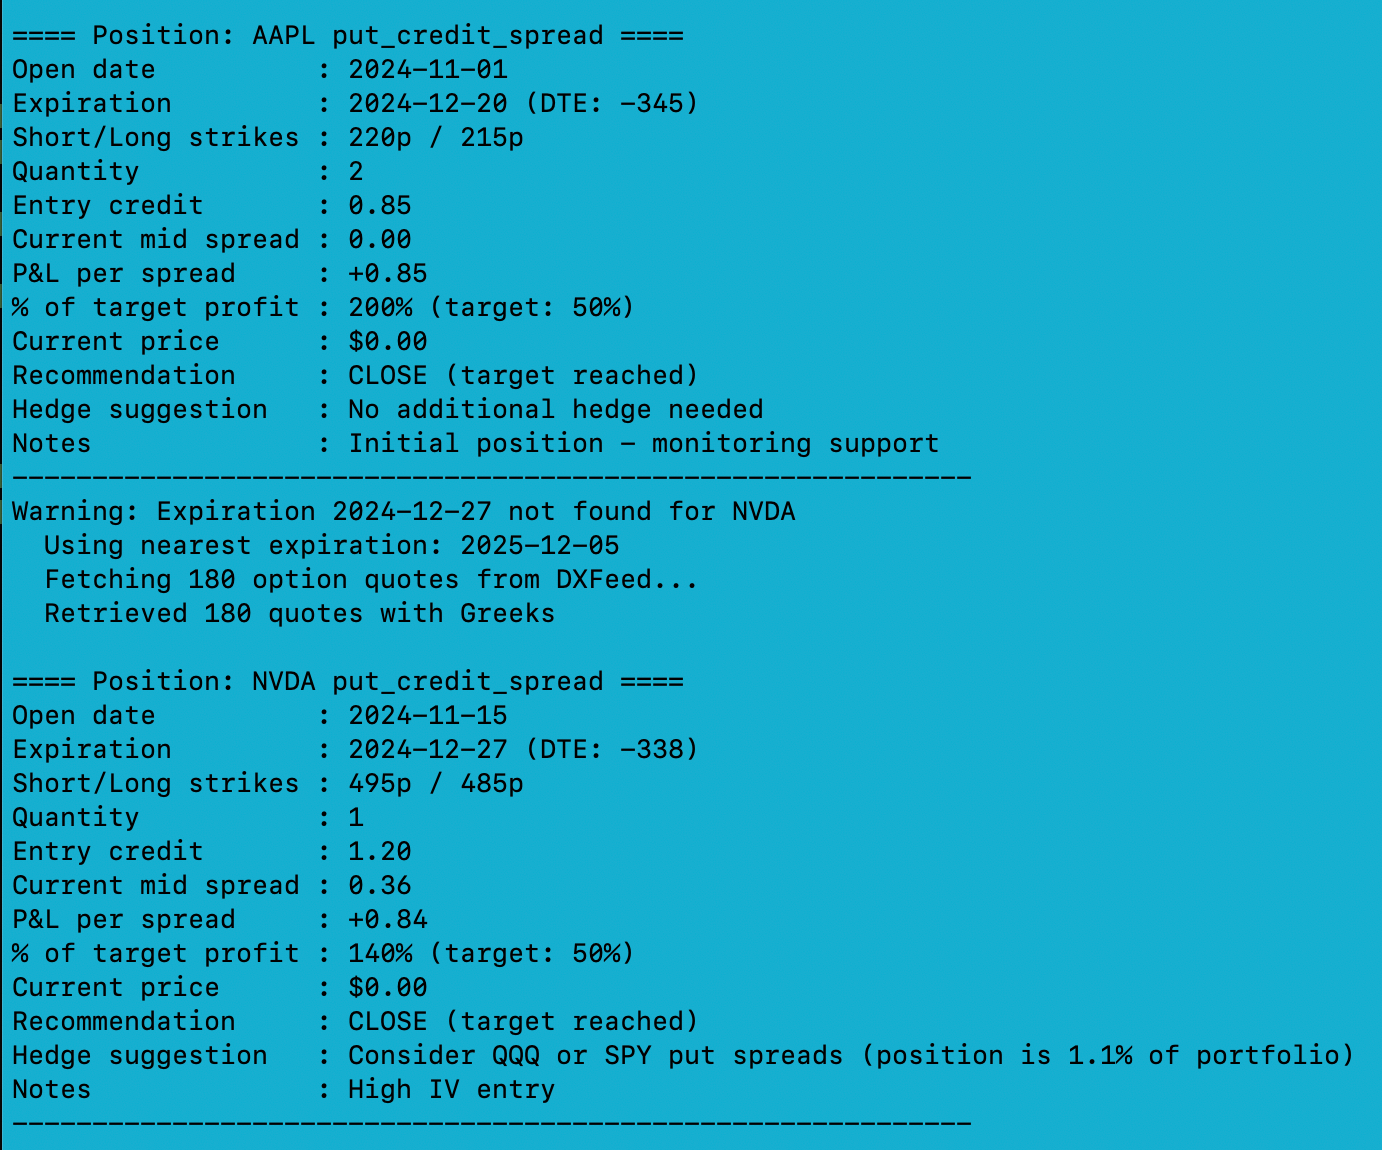
It would also look at my positions and tell me if I should hedge or take additional actions (dummy data below):
Starting With Equity Backtests
I wanted to validate the framework before touching options, so I ran some basic equity strategies first.
Overnight vs. Intraday Returns (SPY, 2015-2024)
The idea was to decompose SPY returns into overnight gaps and intraday moves. Maybe there’s something exploitable in the overnight session.
Strategy              No Costs    With 0.1% Round-Trip
────────────────────────────────────────────────────────
Overnight Returns     +135%       +10%
Intraday Returns      -35%        -160%
Buy-and-Hold SPY      +200%       +200%
So, transaction costs. At 0.1% per round-trip, trading daily costs you about 25% a year in friction alone. The overnight edge existed — it just couldn’t survive the toll.
Pairs Trading
I tested four ETF pairs for cointegration:
XLF / KRE (financials)
XLE / XOP (energy)
GLD / GDX (gold)
SPY / RSP (cap-weighted vs. equal-weight)
None of them passed the Engle-Granger test at 5% significance. They were correlated, sure, but the spreads wandered apart over ten years. Cointegration is rarer than the textbooks suggest.
Single-Factor Strategies
VIX Regime Filter
Simple enough: buy SPY when VIX crosses above 30, sell when it drops below 20.
VIX Strategy:      +180%
Buy-and-Hold:      +200%
The theory is sound — high VIX does predict higher forward returns. But the timing was off. Late entries, early exits, too many whipsaws. VIX alone wasn’t enough.
Sector Momentum
Rank the 11 sector ETFs by trailing 3-month returns. Go long the top 3, rebalance monthly.
Sector Momentum:   +195%  (Sharpe: 0.85)
Buy-and-Hold:      +200%  (Sharpe: 0.88)
This one basically matched SPY with less trading. Not exciting on its own, but it proved that ranking systems work. You can apply the same idea to option strikes — rank by delta, IV, distance from support, whatever.
The Scanner
With the education out of the way, I moved on to the actual goal: a put credit spread scanner.
Put credit spreads are straightforward. You sell a put, buy a lower strike put for protection, and collect the difference. You win if the stock stays above your short strike.
The naive version is just selling puts on anything with high IV. The less naive version stacks filters until you’re only looking at setups that pass every check.
Entry Criteria (all nine must pass):
IV Rank > 30
Price within 3% of support (20/50/100 SMA or swing low)
Uptrend confirmed (price > 50 SMA)
DTE between 30-45 days
Short put delta between 0.15 and 0.25
Open interest > 500
Volume > 100
No earnings within 7 days
No FOMC or CPI in the next week
Position Sizing:
Spread width: 5-10 points
Target credit: 20-30% of width
Max risk: 2% of account per trade
Exits:
Take profit at 50% of max gain
Stop out at 100% loss (2× the credit received)
Close or roll at 21 DTE if still open
Connecting to Live Data
Getting Tastytrade’s API to return what I needed took some trial and error.
Endpoint                              Result
──────────────────────────────────────────────────────
/option-chains/{symbol}               Incomplete data
/option-chains/{symbol}/nested        Chain structure ✓
/market-data?symbols={symbols}        Quotes + Greeks ✓
The /market-data endpoint turned out to be the one. It returns DXFeed data — delta, gamma, theta, vega — alongside the quotes. Greeks come back as 0.0 when markets are closed, which is expected.
How It Fits Together
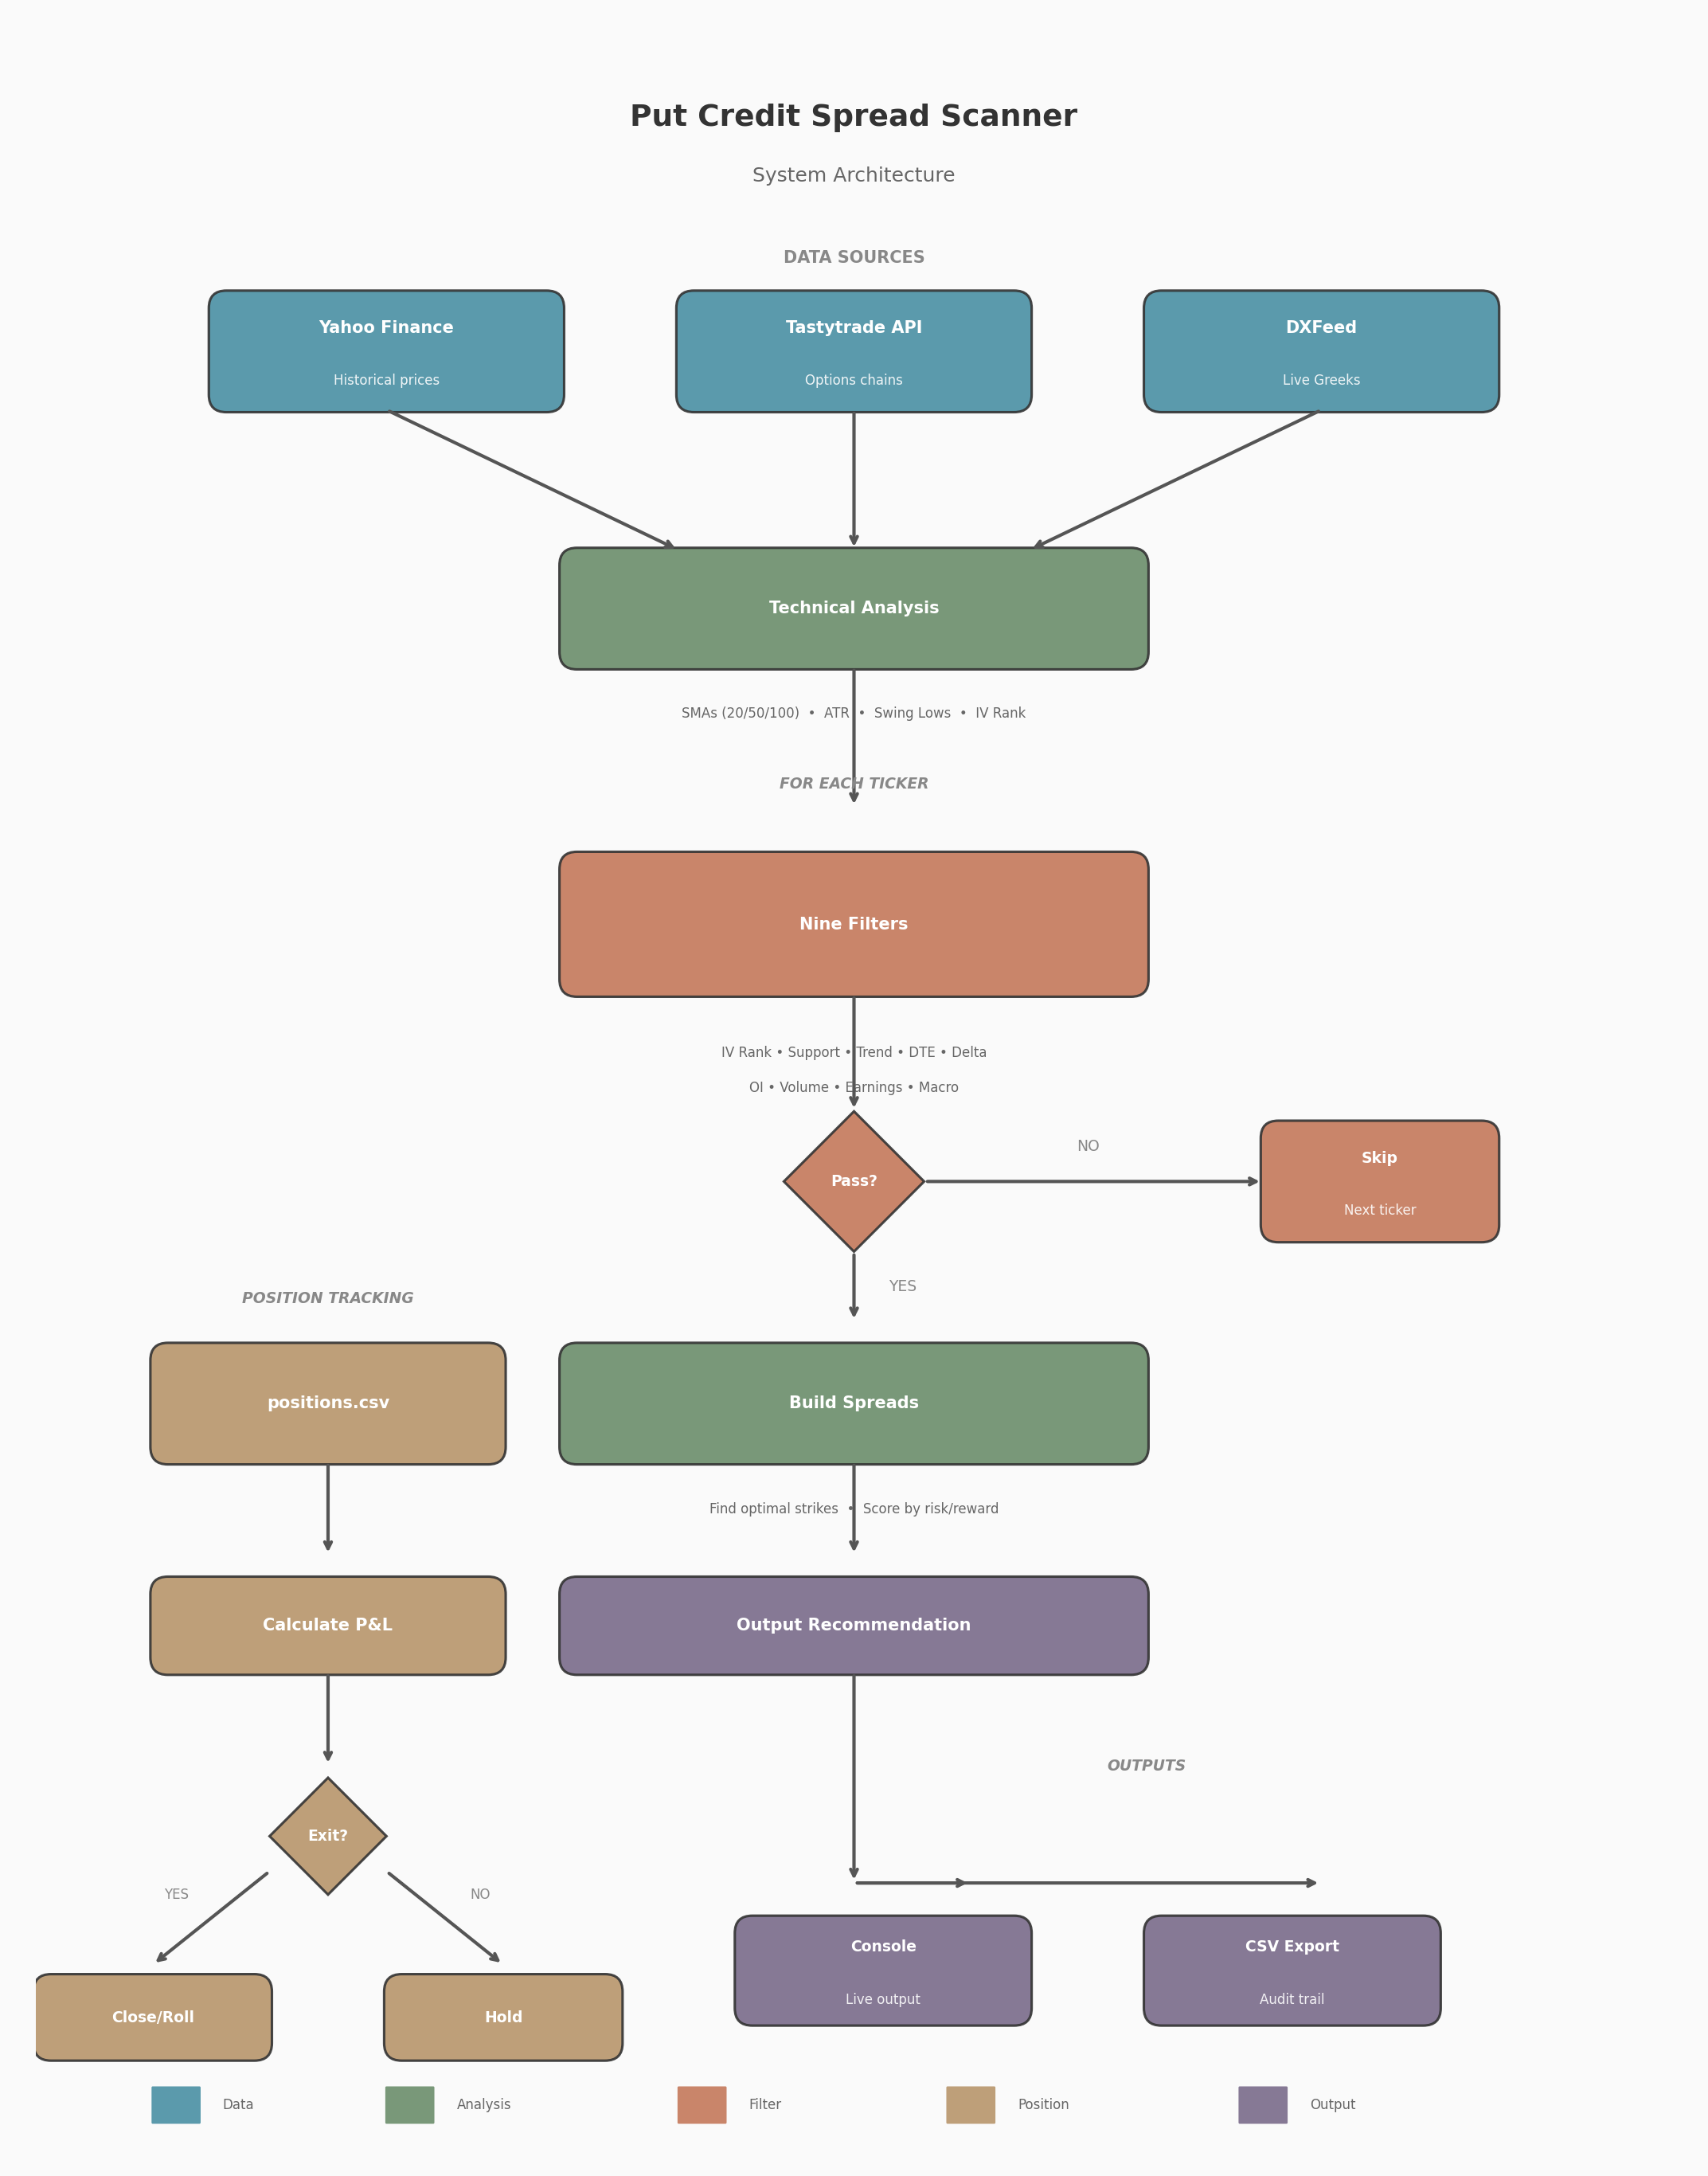
The scanner has six pieces:
Data Layer — Authenticates with Tastytrade, fetches quotes and option chains. Batches requests at 50 symbols per call to stay under rate limits.
Technical Analysis — Computes moving averages (20/50/100), ATR, swing lows, IV rank. Standard stuff.
Filtering — Runs the nine checks. All must pass or the ticker gets skipped.
Spread Construction — Given the delta and credit targets, finds the best available spread and scores it.
Position Management — Loads positions.csv, calculates current P&L, checks if any exits are triggered, suggests what to do next.
Output — Prints to console, exports to CSV.
The whole thing runs in about 60-90 seconds for 12 tickers.
What I Took Away
Transaction costs are brutal. I knew this abstractly, but seeing a 135% return collapse to 10% after costs made it concrete. Daily strategies have to clear a 25% annual hurdle before they even start making money.
One filter isn’t enough. VIX alone underperformed. Support alone would too. IV alone definitely would. Stacking multiple filters is what gets you to cleaner setups.
Build with fake data first. I wrote the whole scanner using mock data before connecting to the real API. Found several bugs that way. When I finally plugged in live data, the transition was smooth.
Delta is the risk dial. The 0.15-0.25 range gives you roughly 75-85% probability of profit. Go further out-of-the-money and the credits get too small. Go closer to at-the-money and you’re taking on more risk than the premium justifies.
Portfolio Greeks add up fast. One position with -0.20 delta is nothing. Twenty of them is -400 delta, which means you’re quite long the market. You need limits.
What’s Next
The scanner works. Now it needs to prove itself. Paper trading first, then small live positions if the signals hold up.
Tickers: AAPL, MSFT, NVDA, META, GOOGL, AMZN, TSLA, AMD, AVGO, NFLX, CRM, ADBE. Data sources: Tastytrade API (DXFeed for Greeks), Yahoo Finance (historical prices).
This post is about methodology, not recommendations. Options and derivatives are complex instruments and this analysis probably contains errors. If you find them, let me know.
The information presented in Math & Markets is not investment or financial advice and should not be construed as such.