
Building a Market Regime Analyzer
Part 54 — A dispatch layer for coordinating trading scanners

This is part 54 of my series — Building & Scaling Algorithmic Trading Strategies
Over the Christmas break, I got tired of running put credit spread scanners that returned zero results, so I built a tool to tell me which scanners to run in the first place.
The problem was obvious in hindsight: I had built a collection of options trading tools— put write scanners, premium screeners, hedge screeners, seven different asymmetric strategy playbooks — but no systematic way to decide which ones actually made sense for the current market environment. I’d fire up the put credit spread scanner, wait for it to churn through hundreds of tickers, and get back nothing because IV rank was sitting at 26%. That’s wasted time I could have spent on strategies that actually work in low-IV environments.
So I built a situational analysis framework that evaluates market conditions first and tells me exactly which strategies to deploy.
This is separate and independent of my dual allocator work — mostly because I like to keep strategies separate and evaluate long-term potentials of each of my strategies independently.
The Core Idea
The framework pulls five key metrics every week:
VIX level and regime — Is volatility low, normal, elevated, or crisis-level?
Market trend — Bull, bear, sideways, or choppy?
IV rank — Is premium rich enough to sell?
Market correlation — Are stocks moving together or dispersing?
RSI momentum — Overbought, oversold, or neutral?
Each metric maps to specific strategy recommendations. High correlation plus upcoming earnings season? Dispersion trade. Low VIX with choppy price action? Butterflies. IV rank above 40%? Now you can run the put write scanner.
The logic isn’t complicated — it’s just rule-based matching between market conditions and strategy requirements. But having it automated and systematic means I stop wasting time on strategies that won’t work in the current regime.
What It Actually Produces
Running the analyzer generates three outputs:
1. Console summary — Quick 15-second read showing the current regime and top strategies:
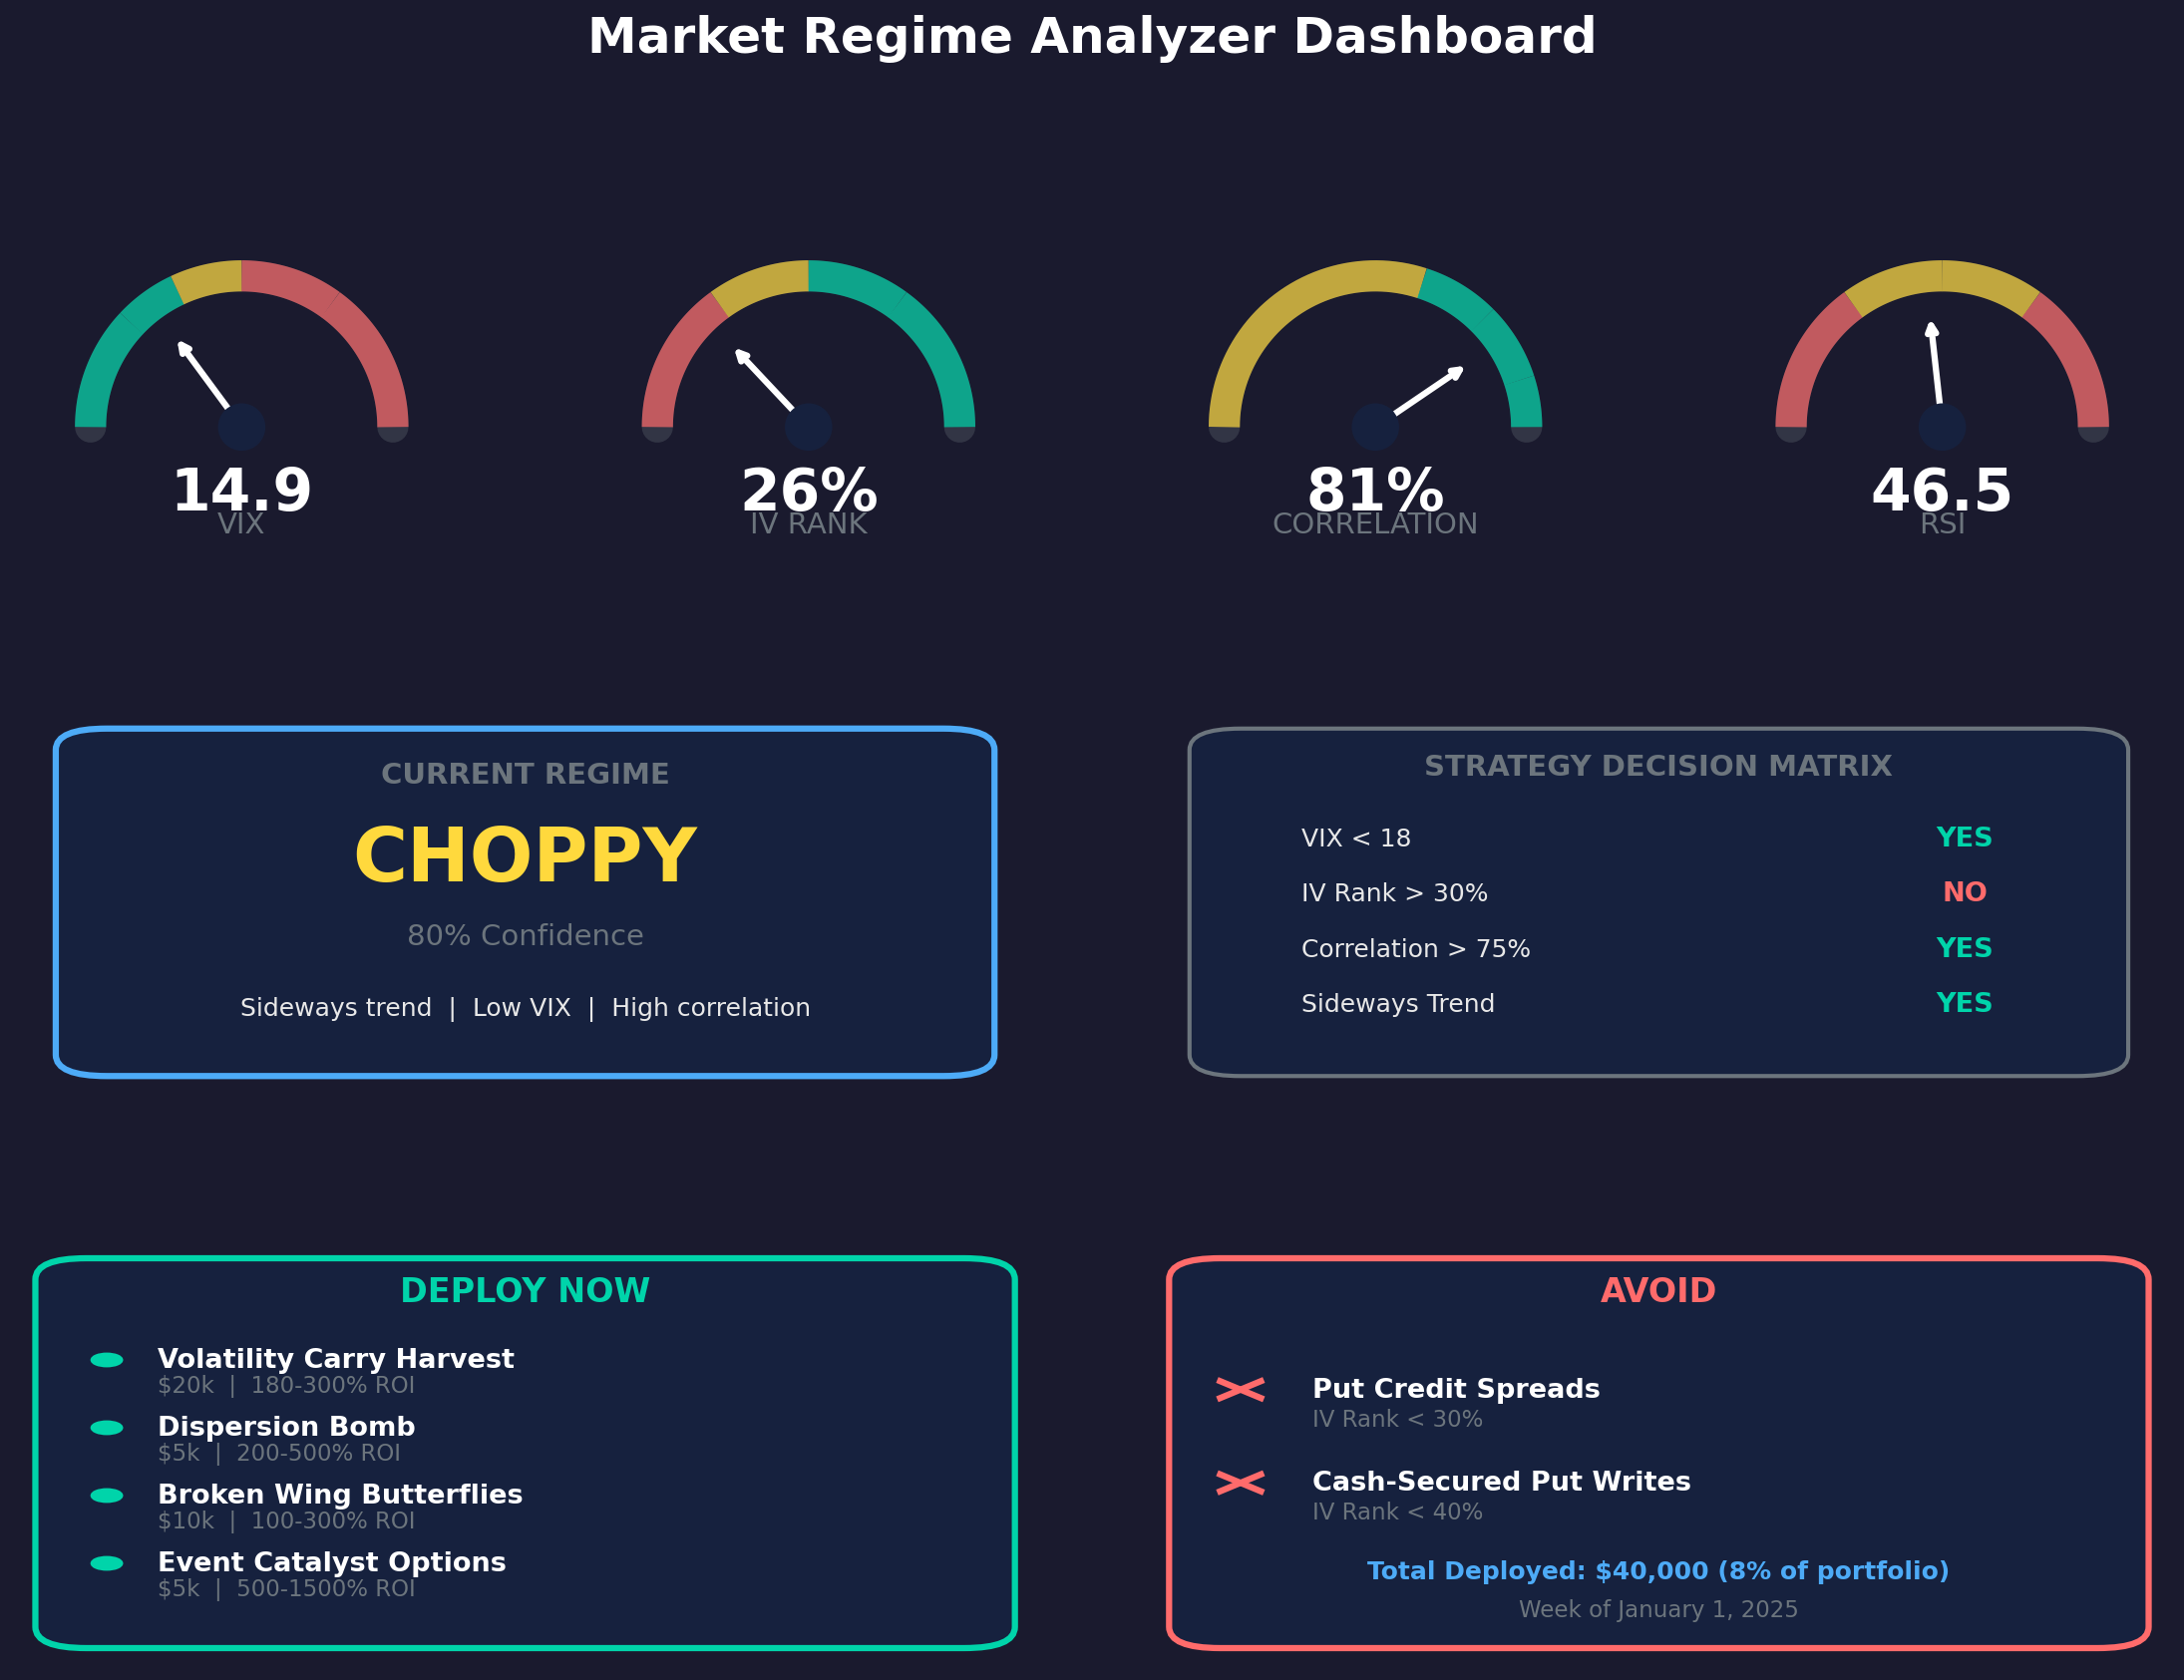
📊 MARKET SUMMARY

Regime: CHOPPY (80% confidence)
VIX: 14.9 (LOW)
Trend: SIDEWAYS (+0.8%)
IV Rank: 26%
Correlation: 81%

🎯 TOP STRATEGIES THIS WEEK:
  1. Volatility Carry Harvest
  2. Dispersion Bomb
  3. Broken Wing Butterfly Army
  4. Multi-Catalyst Event Options

🔴 AVOID:
  - Put Credit Spreads
  - Cash-Secured Put Writes
2. Detailed markdown report — A full weekly action plan with specific trade setups, capital allocation, and a Monday-Friday checklist. This becomes my operating document for the week.
3. CSV history log — Every week’s conditions get appended to a tracking file so I can spot regime changes over time and see what worked in similar conditions.
First Real Results
I ran the analyzer on December 23rd and again on December 31st. Both weeks showed the same regime: CHOPPY with 80% confidence.
The key readings:
Metric          Dec 23      Dec 31      Interpretation
─────────────────────────────────────────────────────────────────
VIX             13.8        14.9        LOW — sell volatility environment
IV Rank         33%         26%         VERY LOW — premium selling dead
Correlation     81%         81%         VERY HIGH — dispersion setup
Trend           +2.0%       +0.8%       SIDEWAYS — no directional edge
RSI             56.5        46.5        NEUTRAL — momentum unclear
The IV rank dropping from 33% to 26% is the critical signal. At 33%, put credit spreads were marginal (threshold is 30%). At 26%, they’re completely off the table. The analyzer correctly flagged this both weeks and steered me toward strategies that don’t depend on rich premium.
The Strategy Decision Matrix
Here’s the simplified logic the analyzer uses:
Market Condition          Deploy                          Avoid
──────────────────────────────────────────────────────────────────────────
VIX < 18                  Vol Carry, Butterflies          Gamma Scalping
VIX > 25                  Long Vol, Event Catalyst        Vol Carry
IV Rank > 40%             Put Spreads, Put Writes         Dispersion
IV Rank < 30%             Butterflies, Vol Carry          Premium Selling
Correlation > 75%         Dispersion Bomb                 —
Correlation < 60%         Directional plays               Dispersion
Choppy / Sideways         Butterflies, Event Catalyst     Trend Following
Strong Trend              Earnings Sniper                 Butterflies
For the current market (VIX 14.9, IV Rank 26%, Correlation 81%, Sideways trend), the matrix produces four high-priority strategies:
1. Volatility Carry Harvest — With VIX at 14.9, selling VXX calls and buying longer-dated SPY puts for protection generates steady carry income. The low VIX means you’re harvesting the volatility risk premium without paying much for crash insurance.
2. Dispersion Bomb — Correlation at 81% is extremely high, meaning stocks are moving in lockstep. This typically breaks down during earnings season when company-specific results diverge from the index. The trade is short index volatility, long single-stock volatility (AAPL, NVDA, MSFT, TSLA), betting that correlation drops.
3. Broken Wing Butterflies — Low IV plus choppy sideways action is ideal for butterflies. You’re not paying much for the options, and the lack of trend means prices are more likely to stay in your profit zone. Deploy 10-15 of these across SPY, QQQ, and the mega-caps.
4. Event Catalyst Options — FDA approval dates, M&A deal closings, and patent rulings are binary events uncorrelated with market regime. These work in any environment because the catalyst is company-specific, not macro-driven.
And the explicit avoid list: put credit spreads and cash-secured put writes. IV rank at 26% means you’re not getting paid enough premium to justify the risk. The scanner would return zero opportunities anyway—but now I don’t waste time running it.
The Weekly Workflow
Every Monday morning, I run the analyzer and get a fresh report. The workflow looks like:
Monday (15 min): Run the script, read the report, identify which 3-4 strategies to deploy that week.
Monday-Thursday: Follow the daily action plan in the report. Each day has specific tasks—open the vol carry position Monday, research FDA events Tuesday, deploy butterflies Wednesday, set up dispersion Thursday.
Friday: Review positions, set alerts, prep for next week.
Total time commitment is around 8 hours per week when actively deploying, with say $40k allocated across four strategies (8% of a $500k portfolio). The expected return profile based on the strategy mix is 40-80% on deployed capital over 45 days, which translates to 3-6% total portfolio return.
Tracking Trends Over Time
The CSV logging is where this becomes more valuable over time. After 12 weeks, I’ll have enough history to answer questions like:
When was IV rank last above 40%? (Time to run premium scanners)
What strategies worked best in similar VIX/correlation regimes?
How often does high correlation actually break down during earnings?
Are there seasonal patterns in regime changes?
The analysis is straightforward once you have the data:
import pandas as pd
df = pd.read_csv('market_history.csv')

# Find weeks similar to current conditions
similar = df[(df['vix'].between(13, 16)) & (df['correlation'] > 0.75)]
print(f"Similar conditions: {len(similar)} weeks")
print(f"Top strategies: {similar['top_strategy_1'].value_counts()}")
Right now I only have two weeks of data, but the structure is in place to make this useful as history accumulates.
What This Week Looks Like
For the week of January 1st, the analyzer recommends deploying $40,000 across four strategies:
Strategy                   Capital    Expected ROI    Time/Week
──────────────────────────────────────────────────────────────────
Volatility Carry Harvest   $20k       180-300%        2h
Dispersion Bomb            $5k        200-500%        1h
Broken Wing Butterflies    $10k       100-300%        1h
Event Catalyst Options     $5k        500-1500%       4h
The expected ROI ranges look aggressive, but they’re annualized and assume the trades work. The more realistic framing is base case +70% on the $40k deployed over 45 days, which is +$28k or +5.6% portfolio return. Conservative case is +40% (+$16k), best case if dispersion and events hit is +112% (+$45k).
The key insight is that IV rank at 26% means premium selling is dead right now. The system prevented me from wasting time on strategies that won’t work and pointed me toward the four that actually have edge in the current environment.
Integration with Other Tools
The situational analyzer now sits at the top of my trading toolkit hierarchy:
Tool                          When to Use                    How Analyzer Helps
──────────────────────────────────────────────────────────────────────────────────────
Put Write Scanner             IV rank > 40%                  Says "AVOID" when < 40%
Put Credit Spread Scanner     IV rank > 30%                  Says "AVOID" when < 30%
Asymmetric Strategy Guides    Always available               Prioritizes which to read
Hedge Screener                VIX spiking                    Recommends when needed
Everything gets coordinated by market regime instead of running tools at random. The analyzer is the dispatch layer that routes my attention to wherever there’s actual opportunity.
The Code
The core script is pretty simple at ~600 lines of Python pulling data from Yahoo Finance, calculating the metrics, applying the decision rules, and generating the reports. Nothing fancy — just yfinance and Tasty for market data, pandas for calculations, and string formatting for the markdown output.
The regime classification uses simple thresholds:
VIX regimes: < 12 (very low), 12-18 (low), 18-25 (normal), 25-35 (elevated), > 35 (crisis)
IV rank: < 30% (low), 30-50% (normal), > 50% (high)
Correlation: < 60% (low), 60-75% (normal), > 75% (high)
Trend: based on distance from 50-day SMA and directional momentum
The strategy recommendations are rule-based matches against these regimes. No machine learning, no optimization — just codified trading knowledge about what works when.
What’s Next
I’ll run this every Monday and track how the recommendations perform against actual results. After a few months, I should have enough data to either validate the decision rules or identify where they need adjustment.
The bigger question is whether this kind of regime-based strategy selection actually improves returns compared to just running all the scanners all the time. My hypothesis is yes — both because it saves time and because it prevents me from forcing trades in unfavorable conditions. But that’s an empirical question I’ll need a few quarters of data to answer.
For now, the immediate value is clear: I know exactly what to do this week instead of guessing.
Remember: Alpha is never guaranteed. And the backtest is a liar until proven otherwise.
Options and derivatives are complex instruments and not suitable for all investors. This analysis probably contains errors — if you find them, let me know.
The material presented in Math & Markets is for informational purposes only. It does not constitute investment or financial advice.
Hello K. Iyer, I just started following you and I'm still catching up on reading your posts. Are you sharing your code for all your strategies and frameworks, or just the ideas in the post?
Neat idea. Curious how this plays out