
Building a Carry Portfolio That Survives: Diversification, Momentum Hedging, and the V6 Carry Upgrade
Part 90 — Multi-asset carry, the diversification illusion, the carry-momentum hedge, and what V6 should actually implement

This is part 90 of my series — Building & Scaling Algorithmic Trading Strategies
Final part of the Carry Trade series. Part 1: What carry is. Part 2: When carry blows up.
The Diversification Illusion
The institutional pitch for multi-asset carry is elegant: combine carry streams from FX, bonds, vol, equities, and commodities. Since each has different risk drivers, the portfolio should be well-diversified, smoothing out drawdowns.
In normal markets, this works. But in crises — like right now! — it doesn’t.
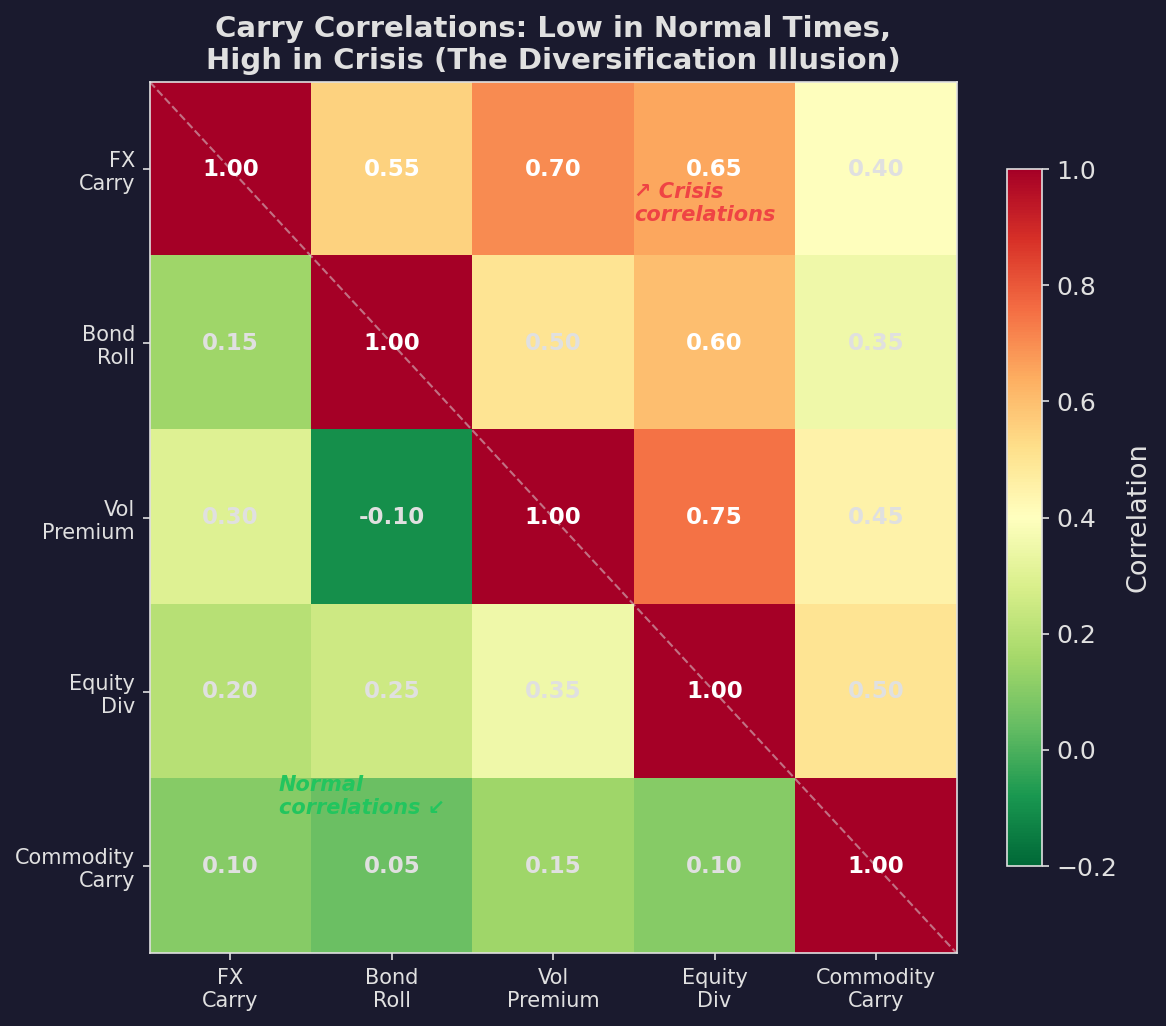
Lower triangle: normal-period correlations across carry strategies. They’re low (0.05-0.35) — genuine diversification. Upper triangle: crisis-period correlations. They spike to 0.40-0.75 — the diversification vanishes precisely when you need it most.
This is Longin and Solnik’s (2001) “correlation breakdown” problem applied to carry. During the 2008 GFC, every carry trade blew up simultaneously: FX carry (yen unwind), credit carry (spread explosion), vol carry (VIX spike), commodity carry (oil collapse). The supposedly diversified multi-asset carry portfolio lost 25-40% in three months.
Why? Because all carry trades share the same underlying risk factor: liquidity preference. When investors flee to cash, every asset that was paying you to hold risk reprices at once. The individual carry streams have different betas to this common factor in normal times but converge to beta ≈ 1 in stress.
Multi-Asset Carry: Better Than Single-Asset, Worse Than You’d Hope
Despite the correlation breakdown, multi-asset carry still beats concentrated carry:
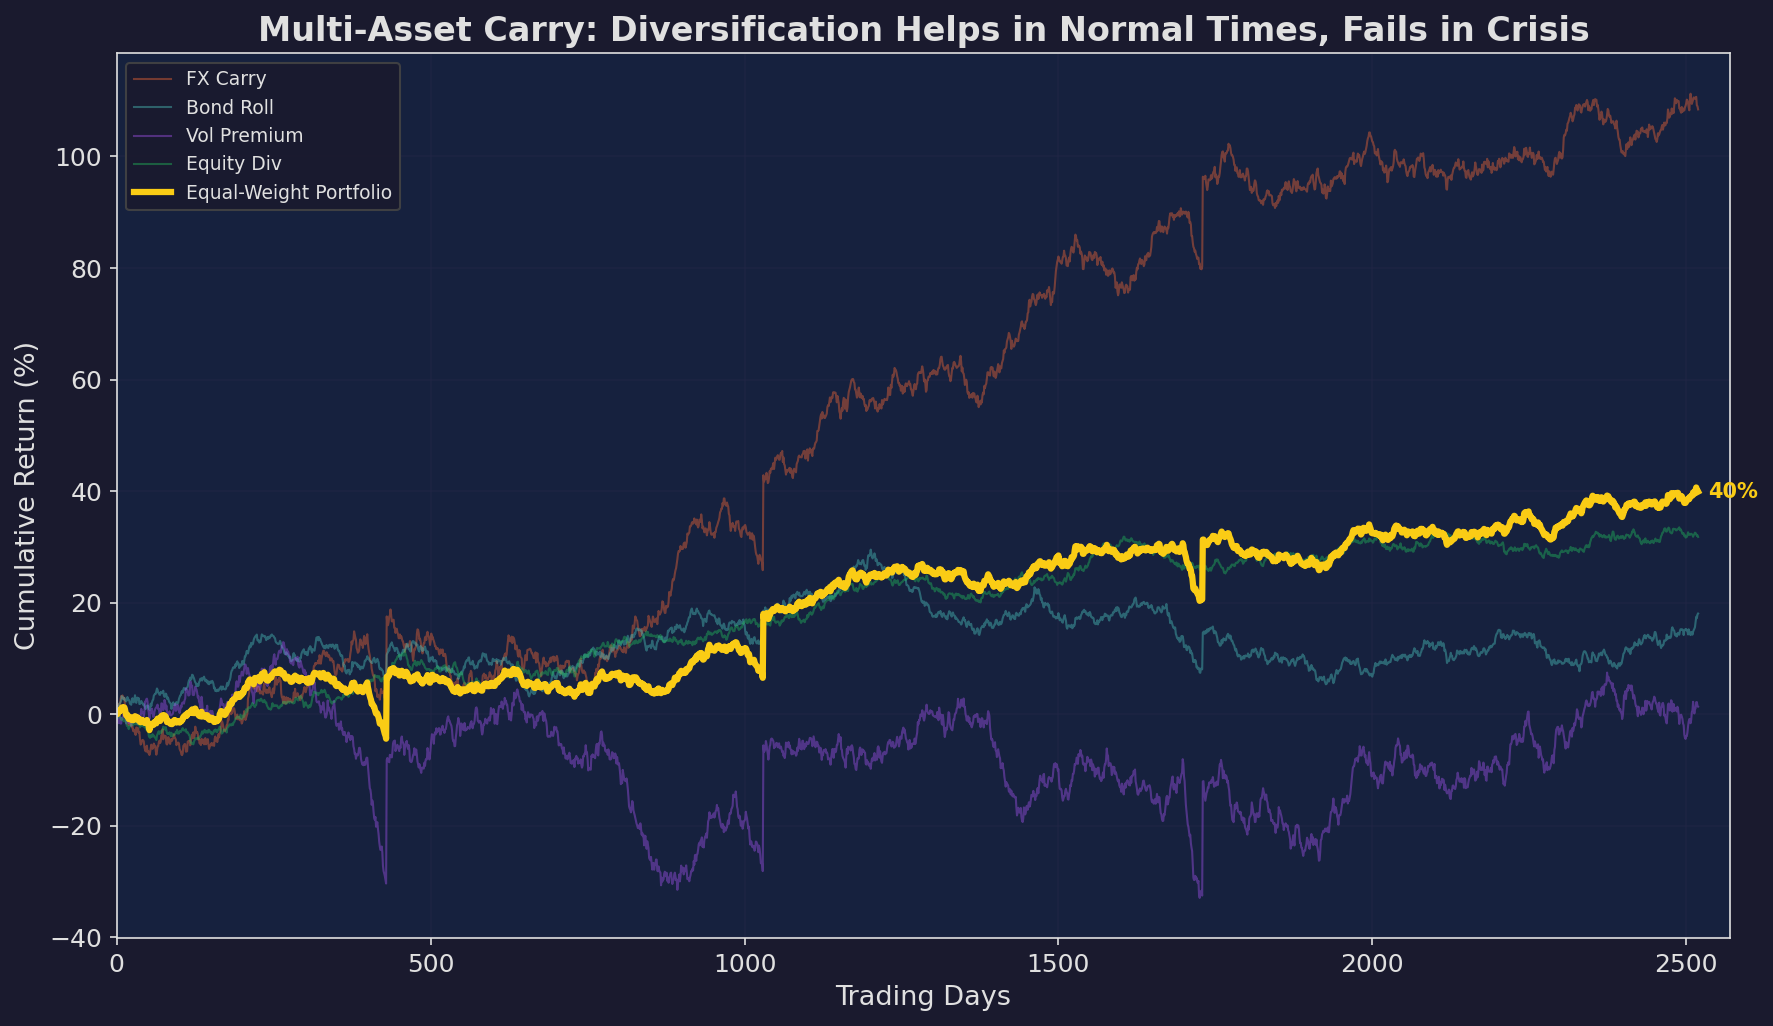
Individual carry streams (thin lines) and the equal-weight portfolio (yellow). The portfolio smooths out idiosyncratic volatility in normal periods, but all streams crash together during stress events. Still, the portfolio never falls as far as the worst individual stream — FX carry or vol premium would have much worse standalone drawdowns.
The math works out to roughly a 30-40% drawdown reduction from diversification — meaningful but not transformative. You’re turning a -40% max drawdown into a -25% max drawdown. Better, but not the -10% you’d get from genuinely uncorrelated assets.
The Carry-Momentum Hedge
Here’s the most important insight in this series: carry and momentum are natural hedging partners.
Carry earns money when nothing changes (steady collection of premium). Momentum earns money when things change (riding trends). Carry crashes happen when regimes shift violently — which is exactly when momentum signals fire and momentum strategies profit.
Asness, Moskowitz, and Pedersen (2013) documented this formally: carry and momentum have near-zero correlation in normal times and negative correlation during crises. When carry crashes, momentum profits from the same trend that’s destroying the carry trade.
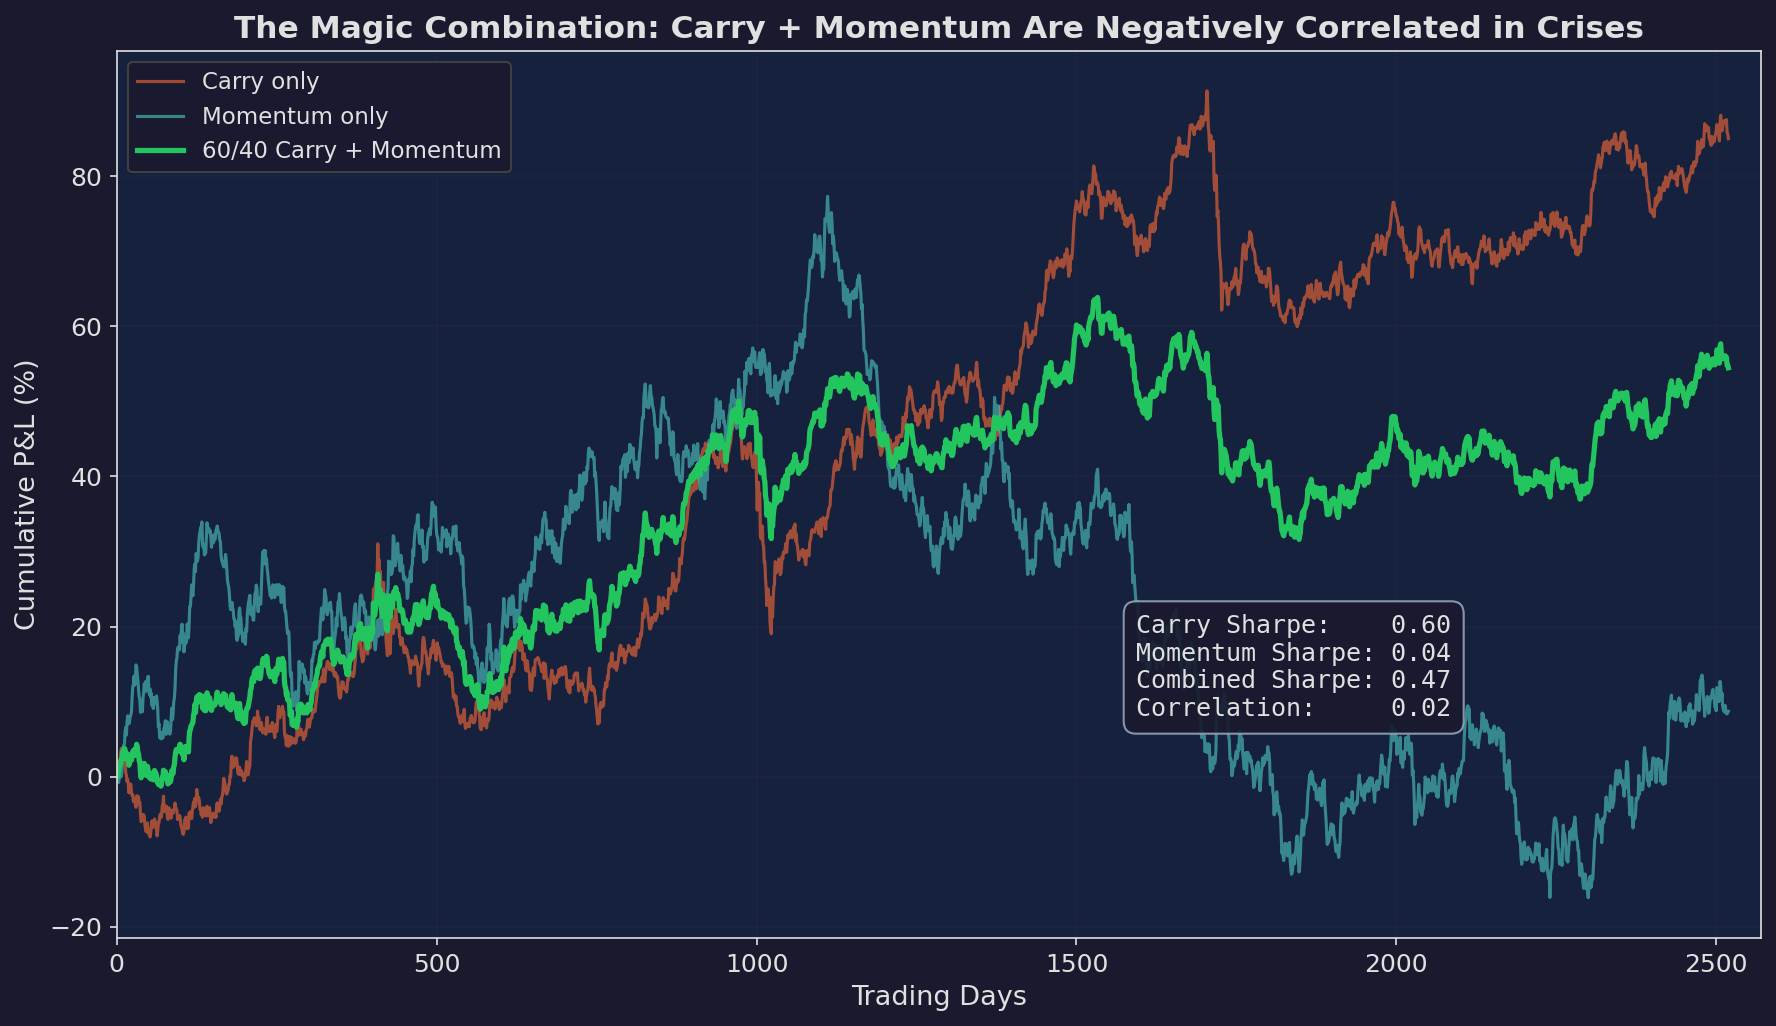
Orange: carry-only strategy. Blue: momentum-only strategy. Green: 60/40 blend. The correlation between carry and momentum returns is approximately zero. More importantly, during the crash periods, momentum tends to offset carry losses — the combined strategy has smaller drawdowns than either standalone.
This is V6’s secret weapon, whether or not it was designed this way. V6’s momentum signals (the 0.1% threshold, the regime switching) provide exactly the crisis-period hedge that a carry position needs. When the market regime shifts and carry starts bleeding, the momentum signal says “get out” — and the exit itself generates momentum profit.
Normal market:
  V6 carry:     accruing daily (+)
  V6 momentum:  mostly flat, small contributions
  Combined:     steady accumulation

Crisis:
  V6 carry:     losing money as spreads widen (-)
  V6 momentum:  fires regime switch signal (+)
  Combined:     momentum offsets carry loss, net damage limited
This carry-momentum interaction explains why V6 has performed better than a naive leveraged equity strategy. It’s not just the momentum alpha — it’s the momentum’s role as a carry crash hedge.
What V6 Should Actually Implement
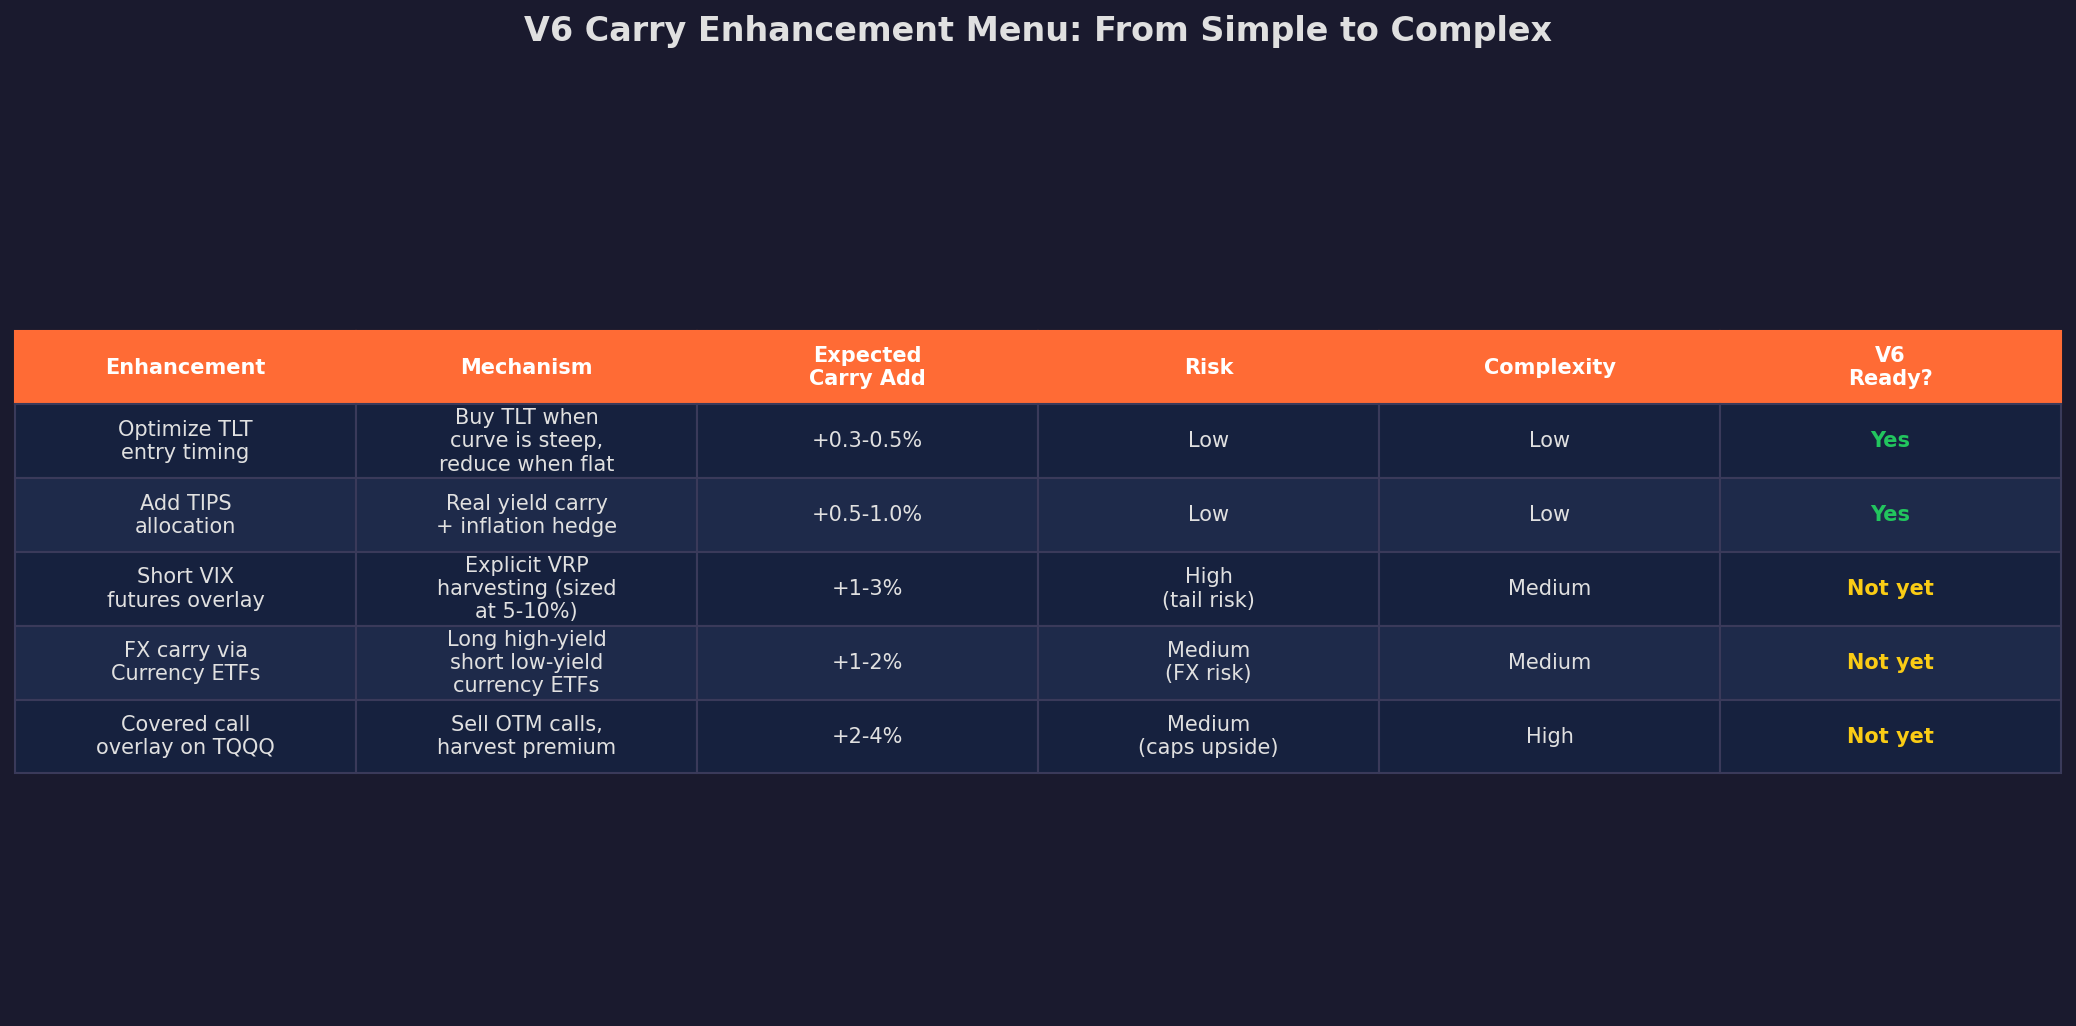
So if we are concrete about what carry enhancements that are worth pursuing:
Tier 1: Implement Now (Low Complexity, Low Risk)
Optimize TLT entry timing. When the yield curve is steep (10Y - 2Y > 100bps), TLT carry is elevated. Weight toward TLT more aggressively in these periods. When the curve is flat or inverted, the roll-down carry is zero or negative — reduce TLT and hold more cash. This requires only FRED yield curve data (free) and a simple conditional rule.
Expected improvement: 30-50 bps annualized.
Consider TIPS allocation. TIPS (Treasury Inflation-Protected Securities) offer real yield carry plus an inflation hedge. When real yields are positive (as they have been since 2022), TIPS carry is attractive. This adds a genuinely different carry stream — real rates rather than nominal rates — with low correlation to TLT.
Expected improvement: 50-100 bps annualized with better inflation hedging.
Tier 2: Evaluate Next Quarter (Medium Complexity)
Explicit VRP harvesting. V6 currently captures VRP implicitly through the VIX regime filter. An explicit overlay — selling 30-delta puts on SPX, sized at 5% of portfolio — would formalize the VRP harvest. But this requires options-level execution, margin management, and the tail risk discussed in Part 2.
Not ready for V6 today. Would require a separate paper-trading phase of at least 6 months.
Tier 3: Research Only (High Complexity)
FX carry via currency ETFs and covered call overlays are theoretically appealing but add significant complexity. FX carry requires managing currency risk exposure that V6 currently avoids entirely. Covered calls cap the upside on TQQQ — problematic for a strategy designed to capture leveraged equity returns.
These belong in a different strategy, not bolted onto V6.
The Complete Carry Decomposition for V6
Bringing together all three posts in this series, here’s V6’s full carry picture:
Carry Source          Current    After Tier 1   Mechanism
──────────────────────────────────────────────────────────
TQQQ dividend         0.3%       0.3%          Equity carry
TLT coupon + roll     2.8%       3.1%          Bond carry (optimized)
TIPS real yield        —         0.8%          Real rate carry (new)
VRP (implicit)        1.5%       1.5%          Vol risk premium
Funding cost         -1.2%      -1.4%          Borrowing cost
──────────────────────────────────────────────────────────
Total carry           3.4%       4.3%          +0.9% improvement
An additional 90 bps of carry accruing daily, before any changes to the momentum signals or microstructure layer. Across a 10-year horizon at compound rates, 90 bps per year compounds to roughly 9% more total return — not nothing.
The Series Summary: Three Truths About Carry
1. You’re already a carry trader. Every buy-and-hold investor earns carry (dividends, coupons). V6 earns ~3.4% annualized from carry before any alpha. Understanding this decomposition changes how you diagnose performance.
2. Carry timing is more important than carry level. A 5% carry that you hold through a -40% crash costs you 35%. A 3% carry that you scale down before the crash nets you 3%. The regime framework from Part 2 captures this — and V6’s existing VIX filter already does it.
3. Carry and momentum are complements, not substitutes. The carry-momentum interaction is V6’s structural edge. Carry provides the floor. Momentum provides crash protection. Together, they compound better than either alone.
This concludes the Carry Trade series (Parts 87-89) and the second major content arc after Microstructure Edge. Across these 10 posts (Parts 80-89), I’ve covered strategy decay, detection and adaptation, order flow and market microstructure, dealer gamma exposure, and carry across asset classes — all connected back to V6’s architecture.
Next up: the Synthetic Replication series (4 parts) on building anything from options.
Remember: Alpha is never guaranteed. And the backtest is a liar until proven otherwise.
These posts are about methodology, not recommendations. If you find errors in my math, let me know — I’ve built an entire series around discovering my own mistakes, so one more won’t hurt.
The material presented in Math & Markets is for informational purposes only. It does not constitute investment or financial advice.