
Building a Systematic Long/Short Strategy
Part 1 of my personal log where I test and scale algorithmic trading strategies

This is part 1 of my series — Building & Scaling Algorithmic Trading Strategies
The Goal
One weekend, I decided to build a trading bot. The goal was simple — build a straightforward leveraged long/short strategy focused on one index.
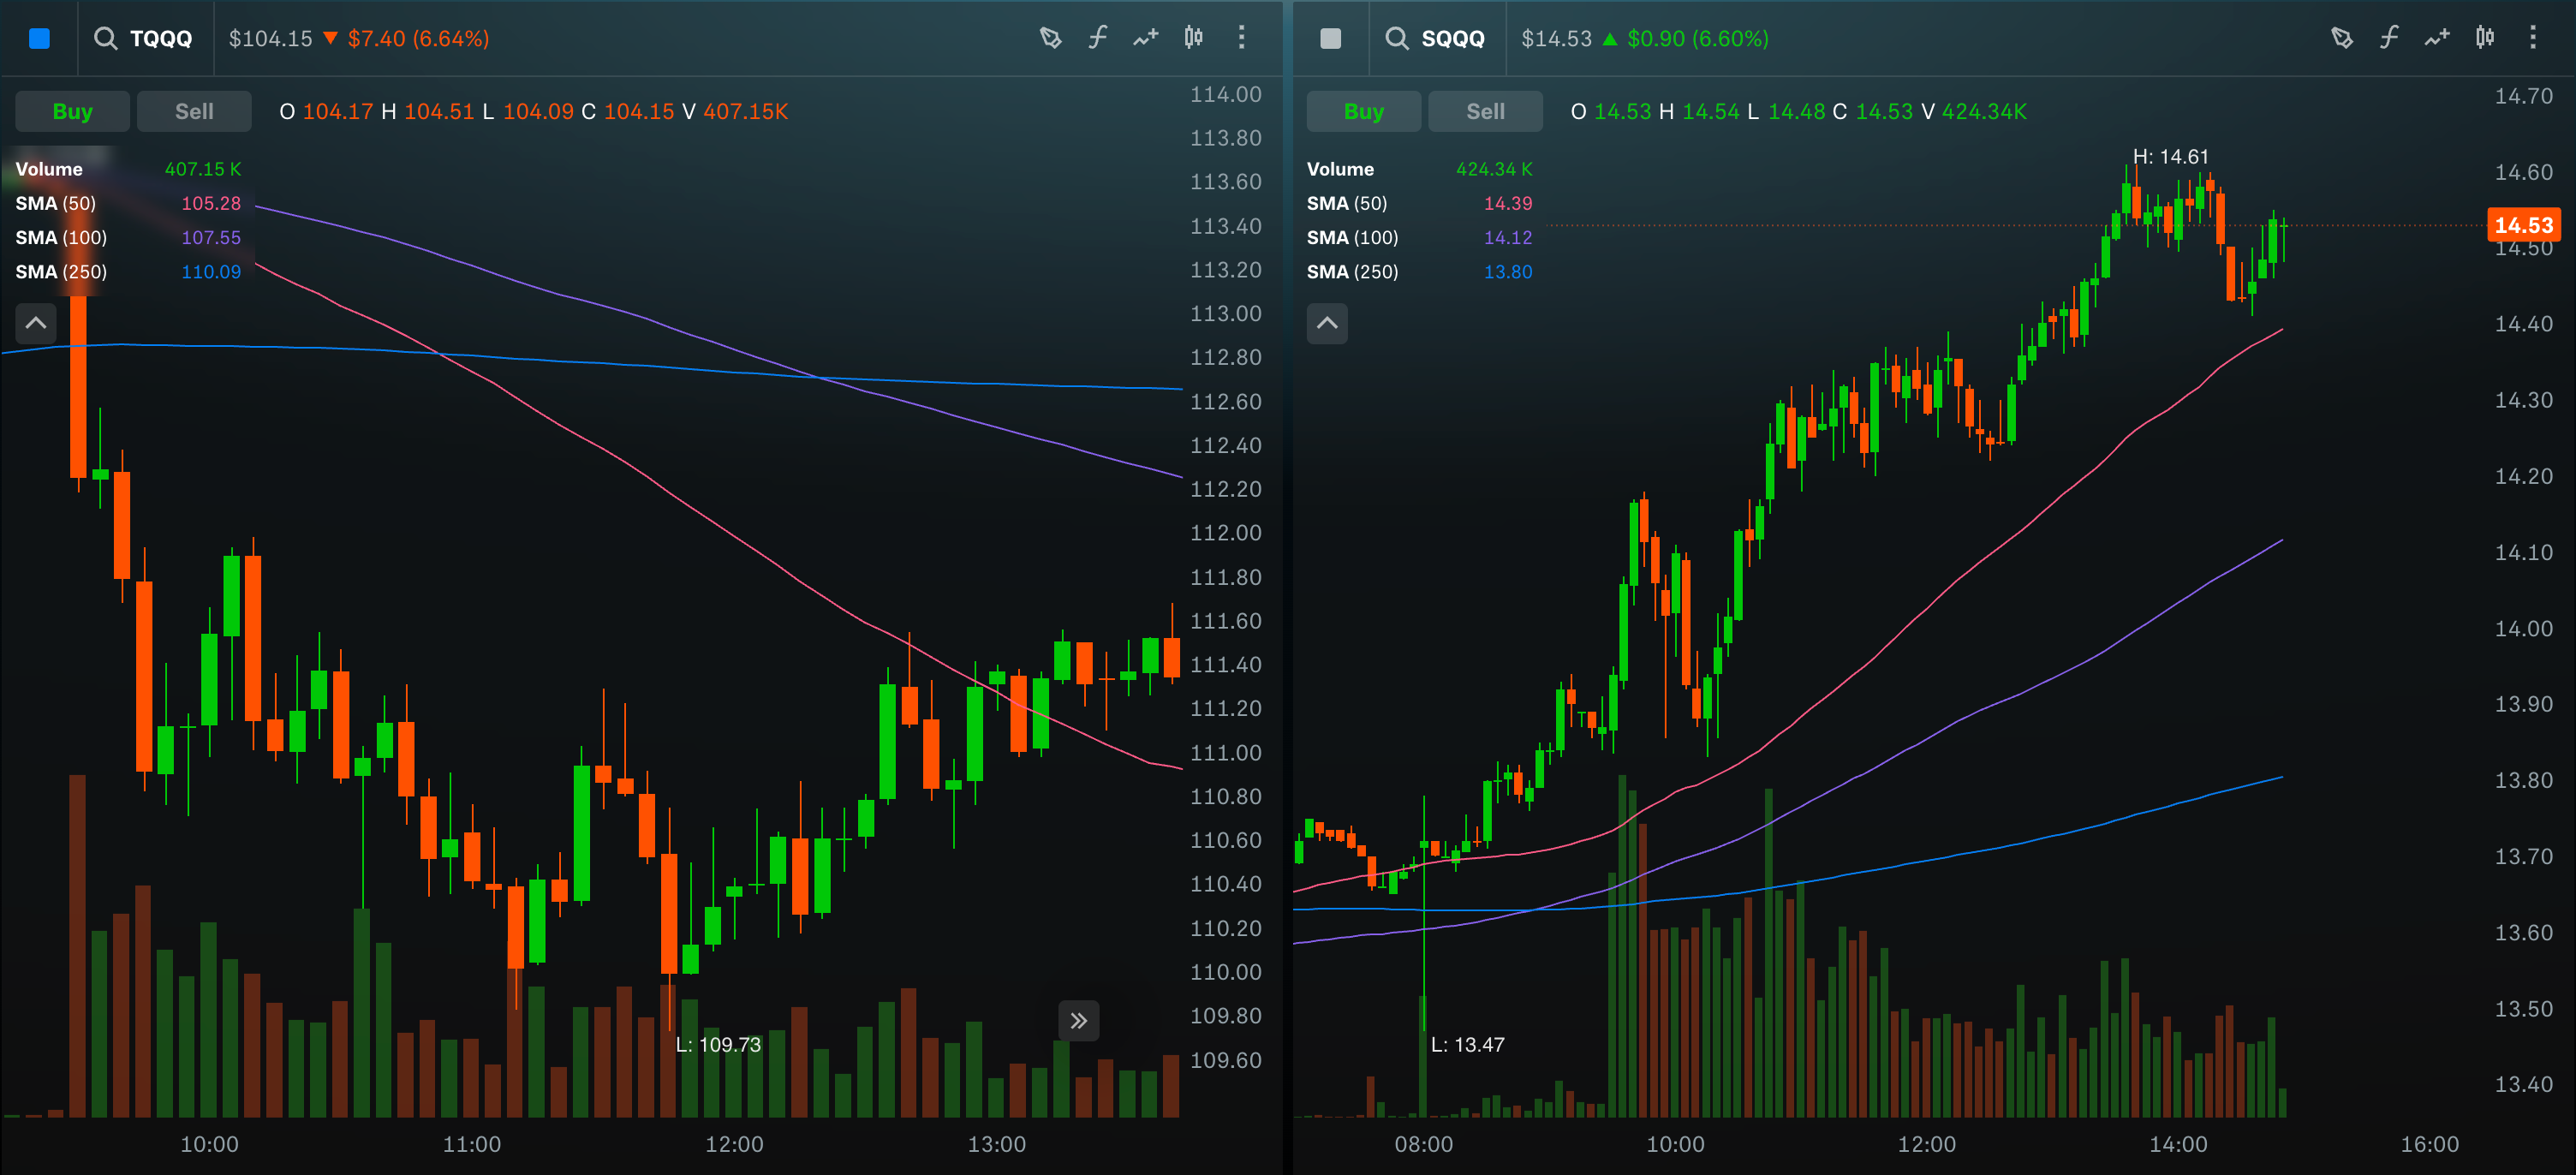
A simple core idea — using moving average ranges to measure how fast and how strongly a trend is moving (basically the velocity and acceleration of price). That drives the buy/hold/sell decisions.
I was an engineer in a past life, but I haven’t seriously coded in years (beyond the occasional tinkering). So this is as much a learning project as it is a trading one. I’m comfortable with statistics and probability, which helps, but everything else — data pipelines, execution, hosting — I’m rebuilding from the ground up.
It’ll be a combination of Python, dusting off some C++ cobwebs, scilab (maybe R at some point or some Perl if I’m feeling wicked) and lots of shell scripting.
I’ll be documenting the process here — the structure, design choices, and what I learn as my algorithms and strategies evolve.
Setup and Structure
I’m running everything on my Mac M2, using Python 3.12 (with the standard data/science stack of pandas, numpy, etc.), GCC and Scilab 2026.0.0.
Once I have a stable version, I’ll migrate it to AWS or GCP so it can run automatically each day.
Here’s the rough structure so far:
Data: Pull live and historical data from Polygon.io and Alpaca.
Trend Metrics: Analyze the data using statistical methods to measure strength and direction of movement.
Signal Decision: Based on the trend metrics, decide whether to go long or short, and what leverage level (1×, 2×, 3×) makes sense.
Backtest: Use historical data to test performance, visualize results, and measure risk metrics.
Feedback: Feed the backtest output back into the signal logic to refine weights and thresholds.
Execution: Eventually connect to Alpaca for paper trading and, later, real trades.
For now, everything runs locally and stores data in CSVs. It’s fast, easy to debug, and transparent. I’ll switch to a proper time-series database later if scale becomes a problem.
The point is to get something working fast, not perfect. I’m sure I’ll make questionable architectural choices that I’ll need to refactor at a later point in time but that’s fine.
Measuring Trends
The signal logic is based on moving averages — not just single crossovers, but ranges between multiple look-back periods. That range gives me a read on both direction and momentum.
When the short-term average pulls away from the long-term one, I treat that like acceleration. When it compresses, it’s a slowdown or reversal. The model converts that into a simple “trend score” that drives the position.
Right now, the weighting is manual — a mix of experience and quick testing. Once I have enough runs, I’ll explore using ML to auto-adjust those weights based on performance feedback. But that’s a later step. For now, the goal is to get the basic logic stable.
The strategy doesn’t predict the future; it will only react to what’s happening.
Backtesting and Iteration
Backtesting is where my model will meet reality. I built a simple testing loop that does three things:
Loads historical data.
Applies the trend and signal logic.
Evaluates results using ROI, CAGR, Sharpe ratio, and Max Drawdown.
The point isn’t to show big numbers; it’s to see if the logic behaves consistently under different conditions. I run multiple timeframes, change parameters, and check how sensitive the outcomes are.
The feedback loop uses these results to tweak the weights in the trend and signal modules. If something overfits or behaves oddly in volatile periods, I’ll hopefully know where to look.
Each iteration gets me closer to something stable enough to run daily without intervention.
Going Live (Carefully)
The last piece is trade execution. That will happen through Alpaca, starting in paper mode.
This lets me see how the strategy behaves in real time without putting money at risk. Once I’m confident in the behavior — timing, logging, and consistency — I’ll start deploying small amounts of real capital.
This stage is less about coding and more about discipline. It’s easy to second-guess your own model when markets move fast. The point of this system is to take those decisions out of my hands.
Eventually, I’ll automate the daily run — maybe at market open, mid-day, and at market close — and start tracking performance live.
Closing Thoughts
This is a build log, nothing more and nothing less.
I’m documenting each step — from getting the data to optimizing weights — and keeping the process transparent.
I don’t know if this will get me to a certain ROI target, but I’m hoping to have fun with math and markets.
The next step is simple: finish setup, run the code, and see what comes out.
The information presented in Math & Markets is not investment or financial advice and should not be construed as such.