
Backtesting, Allocators, and What the Data Actually Said
Part 4 below focuses on backtesting my strategy and the results of my findings

This is part 4 of my series — Building & Scaling Algorithmic Trading Strategies
This phase was about finding out if the math actually holds up.
Once the system ran end-to-end, I started running various models against historical data. The goal wasn’t to “optimize” performance — it was to understand how each design choice changes the character of returns.
I ran a backtest (to the best of my abilities) across multiple timeframes and market regimes to understand how the MA velocity/acceleration framework behaves — and what happens when you start layering allocators, adaptive overlays, and alpha sleeves on top.
Baseline Backtest
The baseline model is simple: static allocation, MA-based signal logic only, no adaptive tuning or external inputs.
This is my “truth table” — the reference I use to judge every variation.
ROI: ~196%
Sharpe: ~0.85
Max Drawdown: ~-26%
That’s decent — not flashy, but it shows the system has real directional bias and doesn’t fall apart in drawdowns.
You can tell it’s reactive, not predictive: it catches trends late, exits a bit late, but avoids most of the deep cuts.
Performance clusters around high-momentum stretches; it bleeds slightly in tight, low-volatility chop (as expected).
Adaptive Allocation (Cap-Only)
The next experiment was to make position sizing adaptive based on rolling volatility and available capital — essentially a “cap-aware allocator.”
On paper, it should smooth returns and reduce drawdowns. In reality, it dulled the edge:
ROI: ~174%
Sharpe: ~0.75
Max Drawdown: ~-26%
Adaptive sizing without any alpha filter ended up over-hedging and under-levering during most of the major runs.
Good idea in theory; too defensive in practice.
I have dropped it for now.
Adaptive + Partial Alpha Sleeve (Step 2)
Next I introduced a partial alpha sleeve — a secondary signal that activates only when the rolling Sharpe of the base strategy is above a certain threshold.
In other words: don’t apply additional risk unless the core system is already behaving well.
The improvement was immediate:
ROI: ~343%
Sharpe: ~0.96
Max Drawdown: ~-37%
Drawdown rose slightly because the sleeve adds exposure during strong phases, but the overall efficiency improved.
It feels more like a portfolio that leans in when it should, rather than sitting on its hands.
This version is also more realistic operationally — I can imagine running this live with a simple toggle for the alpha gate.
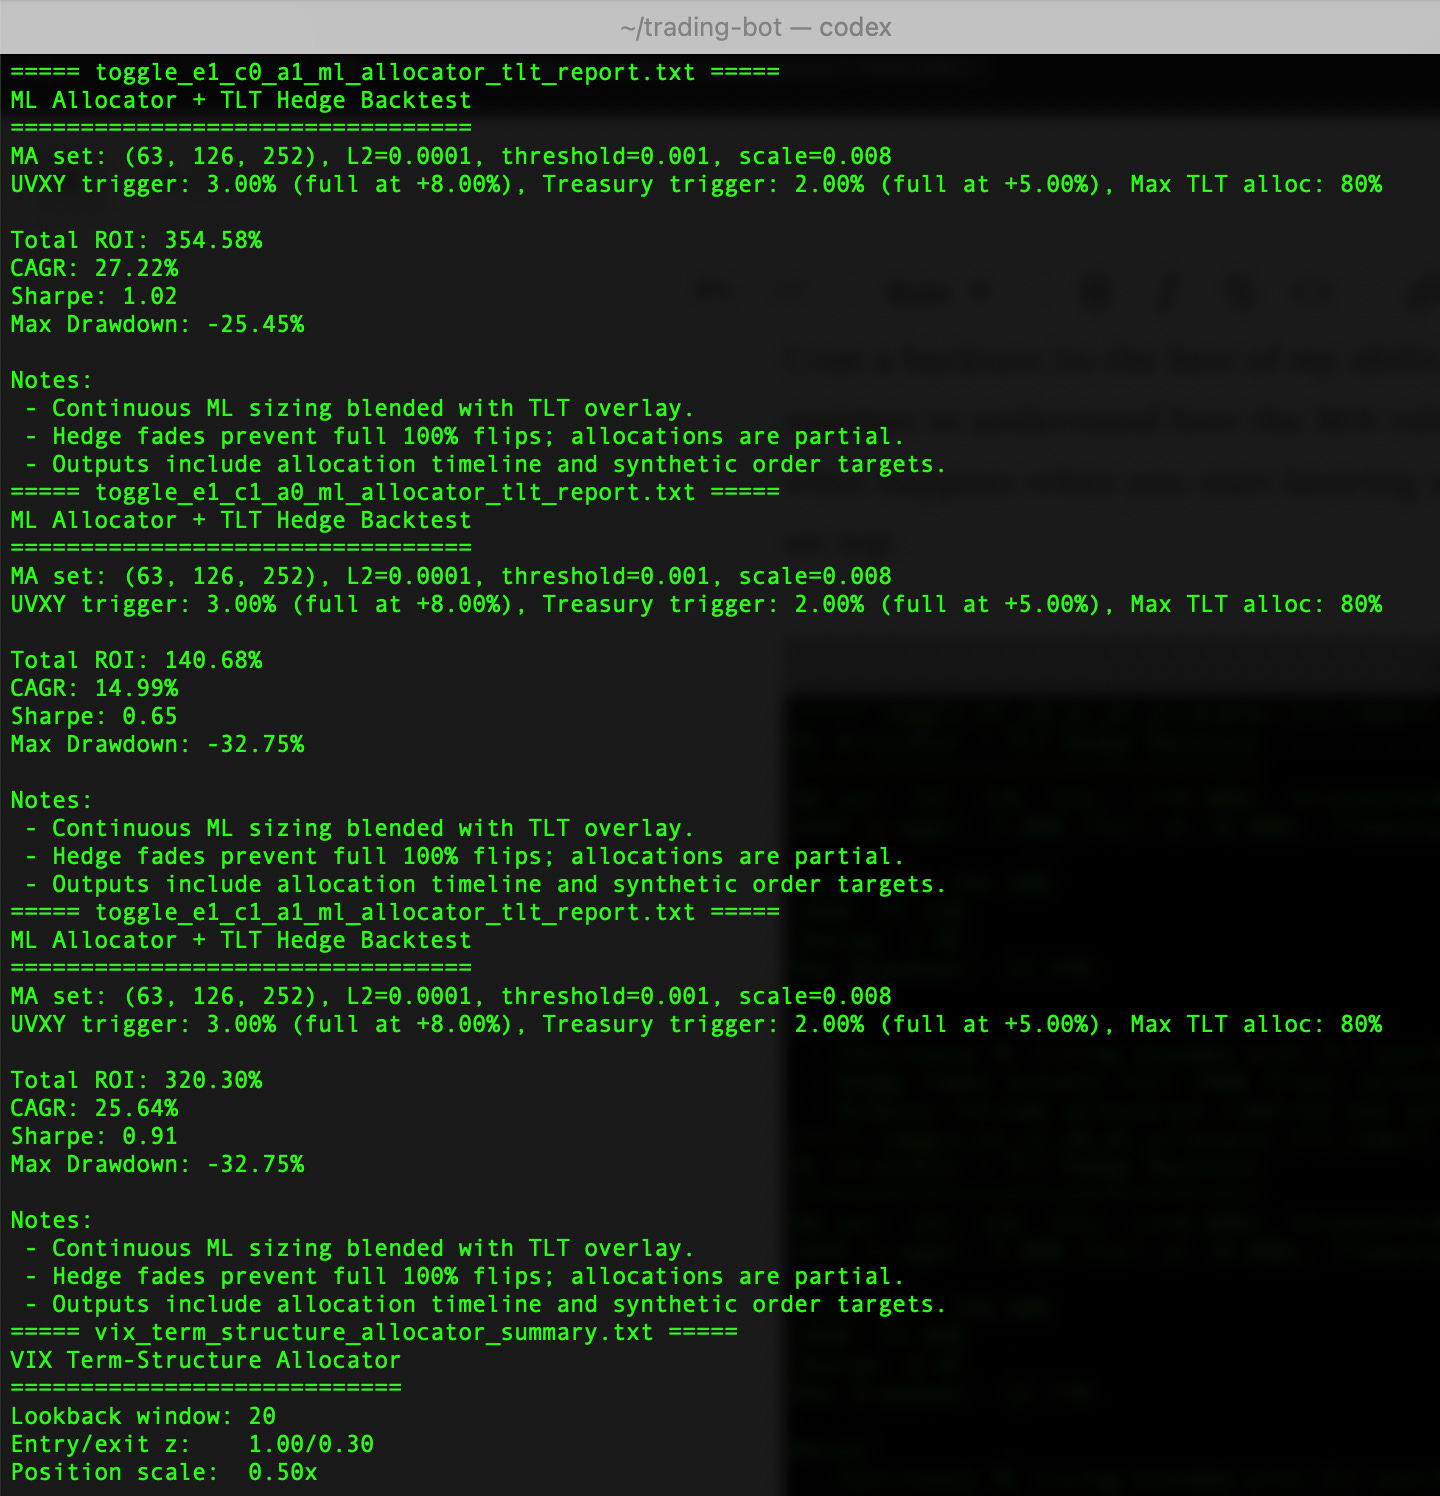
Full Stack: Ensemble + Adaptive + Alpha
Finally, I tested the full stack: the base strategy running as part of an ensemble, combined with adaptive overlays and the alpha sleeve.
This mix uses both internal velocity/acceleration logic and external signals from correlated asset classes — effectively letting the system “listen” to the broader market without directly trading those assets.
Results:
ROI: ~351%
Sharpe: ~0.97
Max Drawdown: ~-37%
At first glance, it looks great — higher return, good Sharpe — but the drawdown didn’t improve.
So I ran through all the permutations and combinations, and the clear winner was:
Ensemble: ON
Adaptive: OFF
Alpha: ON
That version delivered the cleanest profile:
ROI: ~361%
Sharpe: ~1.06
Max Drawdown: ~-30%
Essentially, the ensemble adds resilience across market regimes, while the alpha sleeve boosts conviction selectively.
The adaptive module alone was too conservative, but when used indirectly through ensemble weighting, it helped reduce whipsaws.
Allocator View (Manual, Not Programmatic)
I ran these allocator experiments manually — more like a discretionary PM reviewing model blends than an automated optimizer.
For each run, I adjusted weights by hand, tracked outcomes, and took notes on how the system responded under different stress periods.
I tried to make it programmatic (because I am lazy) but realized that doing it by hand was actually far more effective (plus helped me get a feel for the data). And this helped me actually understand the risk/reward curve rather than overfitting it.
Some findings:
Partial alpha sleeve works best when it’s gated — it shouldn’t always be active. I use a rolling Sharpe threshold to decide when it earns the right to deploy. YMMV on what threshold to use.
Cross-asset adaptive overlays (from other asset classes like bonds, vol, or commodities) helped stabilize returns in 2022-style selloffs, but they flatten peaks. I treat them as optional hedges, not core components. But to be fair, I used a very, very limited set of other asset classes in this modeling exercise.
The best blends come from simple ensemble averaging — multiple signals voting with weighted conviction. When they diverge, I size down (just to be safe).
I think of this part of the system as a structured discretion framework: an allocator layer that can run optimizations based on data, but still with my defining the logic and the weights.
At some point, I might write a python script to do a Bayesian classifier to learn from various allocator models.
Volatility Regimes and Flow Context
Backtests are fine, but every strategy needs context.
I mapped the performance across distinct volatility regimes:
Low-vol grind (2017, mid-2021): system under-performs, small long bias, low turnover.
High-vol directional (2020 crash, 2023 rebound): excellent performance; velocity/acceleration metrics react quickly and ride trends.
Choppy rotation (2022): mixed; alpha sleeve helps avoid over-trading.
Adding volatility and flow awareness — especially tracking index futures positioning, ETF flow data, and implied vol term structure — improved the allocator’s ability to stand down during noise.
The system doesn’t directly trade these, but treats them as environmental variables.
Macro, Seasonality, and Options Chain Context
Beyond pure price action, I’ve started layering in optional context flags:
Macro flow: rate expectations, liquidity indicators, fiscal/monetary direction.
Seasonality: calendar-based drift patterns (earnings cycles, quarterly rebalances).
Options chain data: skew and open interest concentrations; these help identify crowded positioning or gamma walls.
These won’t be driving trades directly. They’ll be informing risk weighting — essentially nudging the allocator to be cautious or opportunistic depending on backdrop.
Example: if options flow shows heavy call concentration and realized vol is collapsing, I’ll gate the alpha sleeve even if signals are positive. These will simply gate leverage or delay entries when the backdrop feels one-sided.
Additional Strategies to Explore
As the core long/short allocator stabilizes, I’m mapping out other sleeves that could diversify risk and monetize orthogonal edges:
1. Volatility Term-Structure Carry
Run a small sleeve that shorts front-month panic against mid-curve VIX futures — or goes long vol when the curve flips to backwardation.
The idea is to treat vol spreads as a mean-reversion carry trade.
Done right, it could help me diversify the equity beta and earn the same skew premiums that drive the long/short allocator.
2. Rates / Credit Relative Value
Build pair trades between equity beta and macro proxies — fading dislocations between equity and credit or between growth and real rates.
It gives me convex exposure to regime shifts without leaning on outright direction (I think).
Tracking real-rate spreads and stress gauges could evolve into a small systematic RV book — long credit risk premium, short growth beta — a natural hedge for the allocator during macro shocks.
3. Commodity Trend & Carry Sleeve
A rules-based program across liquid commodity indices (energy, metals, ags) trading both momentum and term-structure carry.
Adds inflation and supply-shock beta that’s largely orthogonal to Nasdaq behavior, helping smooth portfolio Sharpe when tech volatility clusters.
4. Event-Driven Macro Straddles
Short-horizon trades around scheduled releases — delta-hedged options or futures straddles exploiting implied vs realized gaps.
Because they’re flat outside event windows, they don’t cannibalize the daily long/short book but can add convex P&L during surprise prints.
5. Leveraged ETF Decay Arbitrage
Systematically harvest decay from leveraged ETFs using dollar-neutral pairings or rolling calendar spreads.
It’s a slow, mean-reverting neutral P&L stream with strict vol caps — a way to offset directional risk in the main allocator.
Real-World Costs & Frictions
Backtests are friction-free; reality isn’t.
Here’s what eats into ROI once you start trading size:
ETF trading costs: assume 2–3 bps of notional per entry/exit to cover spreads and impact (VIXY/VIXM typically 1–2 ¢ per share).
Financing / short borrow: the short leg can go hard-to-borrow; VIXY borrow fees can spike into double digits annualized. Haircut returns accordingly.
Management fees & decay: ETFs embed fees and daily roll; leveraged products add compounding drag. Model these explicitly.
Rebalancing slippage: every z-score sign-flip means crossing the spread — add ~5 bps per rebalance to stay honest.
Capacity limits: VIXY averages ≈ 200 k shares/day, VIXM < 10 k. Liquidity premiums grow fast with size; haircut returns for that fill risk.
These don’t break the system, but they turn “backtest perfect” into “realistic deliverable.”
Accounting for them early keeps the Sharpe honest.
What I Learned
The raw MA velocity model works — it captures real structure in market behavior.
Adaptive sizing looks smart in theory but adaptive allocators can easily overshoot; selective alpha gating works better.
Manual iteration (adjusting weights, testing regimes by hand) teaches more than any optimizer can.
Volatility and macro context matter, not for prediction, but for avoiding dumb exposure (particularly leverage).
Next: turning all of this into a live process — daily runs, paper execution, logging, and risk controls.
That’s where the “trading bot” stops being a backtest and starts becoming infrastructure.
The information presented in Math & Markets is not financial advice and should not be construed as such.
Can you share what adaptive overlays and alpha sleeve you you considered?